
Published: August 6th, 2025
Binance Coin (BNB) has shown remarkable durability throughout the ongoing market drop that has impacted the majority of the major digital currencies. BNB's highest drawdown has stayed within a 30% barrier, although most of the top cryptocurrencies have seen large drops from their peak periods, ranging from 60% to 80%. Despite ongoing volatility in the larger digital asset marketplace, this relative stability has enabled the token to retain a price level near its record peak.
Market data showing performance from recent peaks shows a dramatic difference between BNB's actions and those of its competitors. BNB has continuously maintained a stronger position than other leading cryptocurrencies over the past few months. In contrast to tokens like XRP and Ethereum, which had declines of up to 38%, its reductions have ranged from 6% to 30%. Solana experienced the most severe losses, falling more than 60% from its high point. These figures support BNB's reputation as a reasonably steady and reliable performer amid erratic times.
BNB has also seen an increase in institutional interest. Numerous publicly traded businesses have announced BNB-related activities, including CEA Industries, Windtree Therapeutics, Liminatus Pharma, and Nano Labs. One noteworthy action among them was the purchase of 128,000 BNB by Nano Labs as a component of its planned treasury management.
The token is still being closely watched as BNB consolidates close to important support and advances toward possible breakout zones. It may be well-positioned for sustained supremacy in the altcoin industry should general sentiment improve, as evidenced by its steady performance, technical prowess, and expanding adoption.
Let's see the further outlook of the Binance Coin from the BNB/USDT technical analysis:
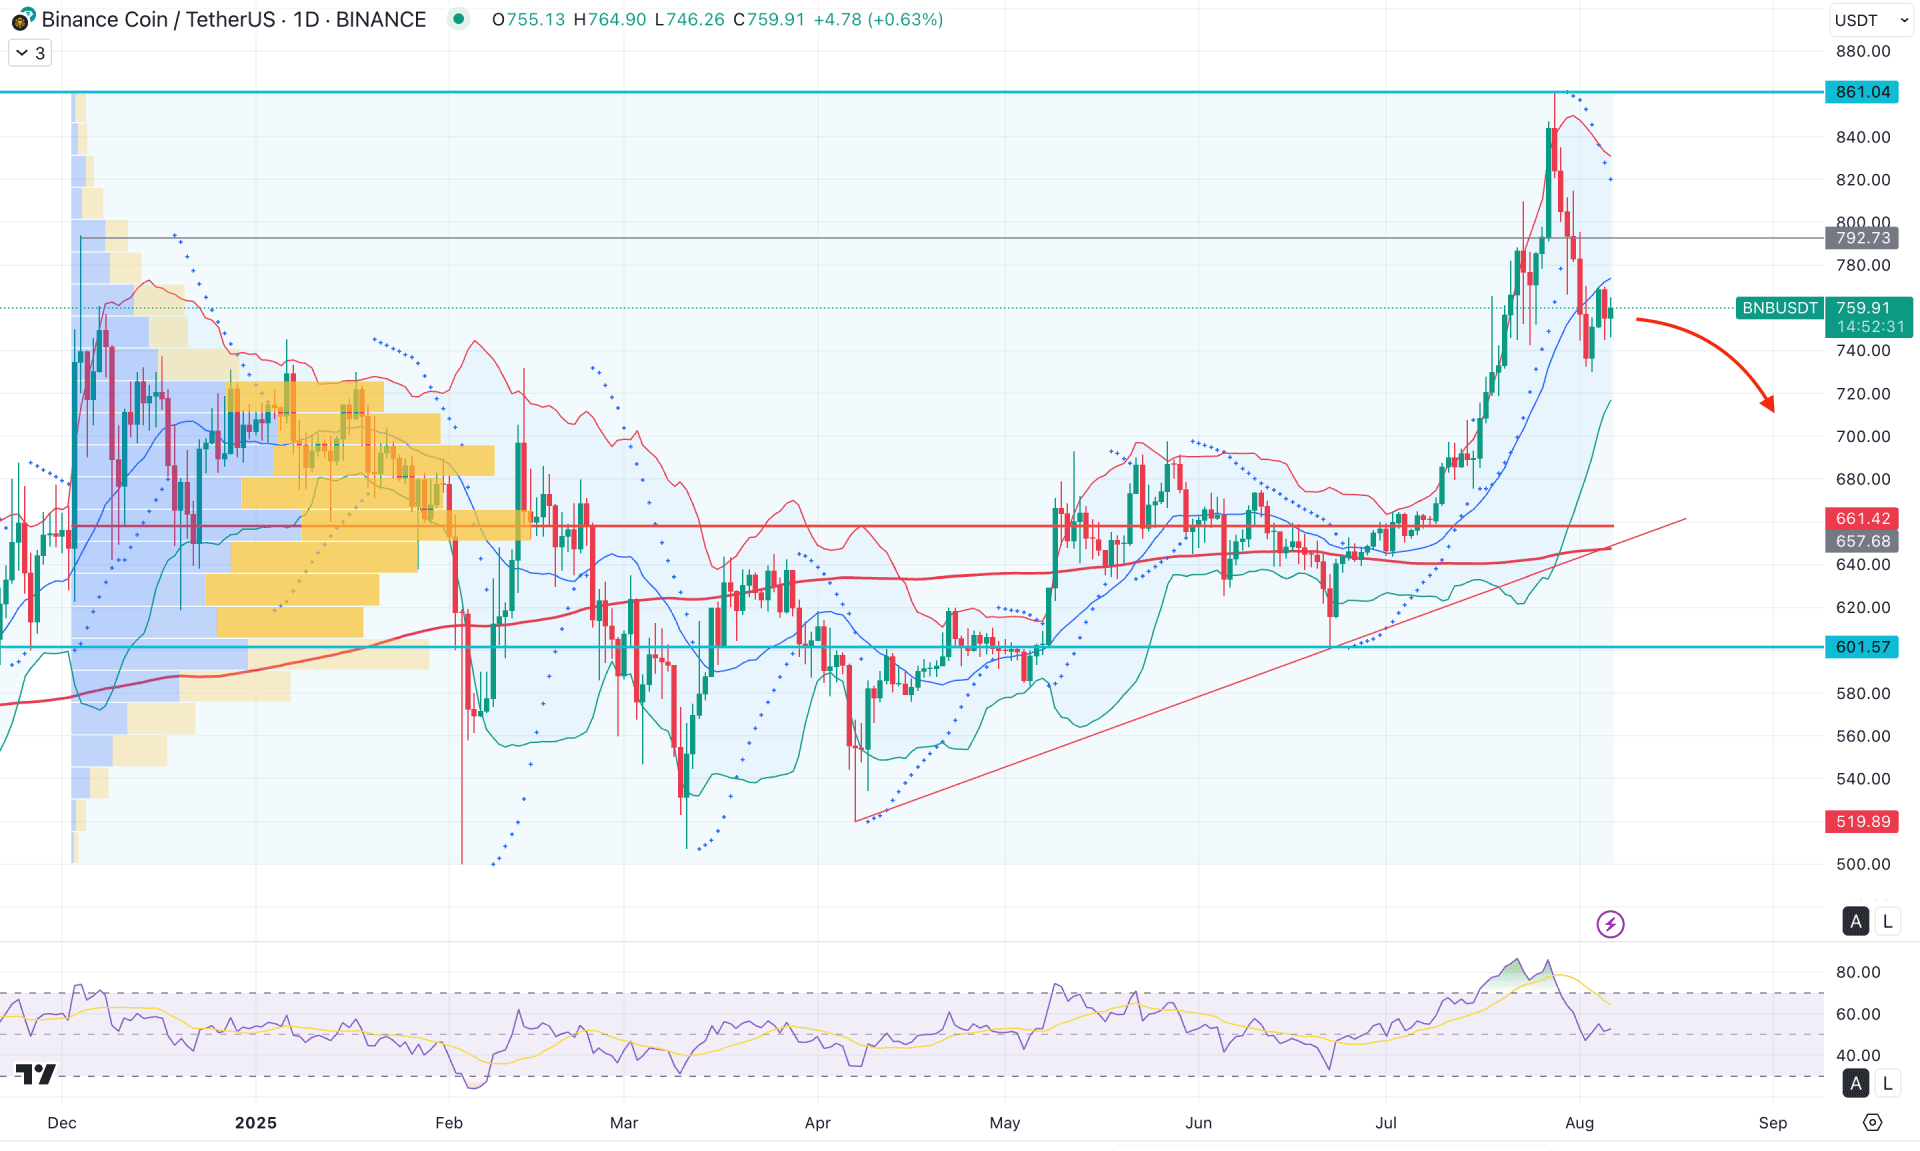
In the daily chart of BNB/USDT, the ongoing price action is bullish, with the most recent candle forming a new all-time high, surpassing the previous market top. After setting this peak, an immediate downside recovery followed, raising concerns of a potential "pump-and-dump" scheme.
On the higher timeframe, the monthly chart shows that the price is moving within an ascending wedge pattern, with the recent high testing the existing resistance level. Although the July 2025 close formed a massive bullish bar, pushing the price to a seven-month high, the sustainability of the move from this premium level remains uncertain. On the weekly chart, a bearish engulfing candle has formed at the all-time high, while the 729.28 level acts as a critical weekly support to monitor.
From a volume perspective, institutional buying interest is evident, with the highest activity since November 2024 centred around the 657.68 level, approximately 13% below the current price. Although selling pressure is apparent at the all-time high, it's premature to anticipate a complete trend reversal. As long as the price remains above this high-volume area, renewed buying momentum could emerge at any time.
On the daily chart, an averaging bottom pattern has developed, and BNB recently broke above its neckline at about $745. This level is now being used as support for the price. In addition to maintaining the bullish structure, a good hold at this crucial area can open the door for additional upward action. Technical analysis suggests potential price objectives around $790, $850, $900, and $1,000 if momentum picks back up. Recent behavior, however, indicates that the gain is temporarily consolidating, as evidenced by stabilizing RSI levels and low trading volume.
In the daily chart, price action extended above the upper Bollinger Bands, indicating extreme buying pressure, before retreating below the midline, signalling a shift to sideways momentum. As a result, the Parabolic SAR has flipped, with multiple dots appearing above the price, indicating potential short-term bearishness.
Based on the overall market structure, investors should closely observe how the price behaves below the midline of the Bollinger Bands. A continuation of sideways movement with a lower low formation could confirm a bearish trend. In that scenario, immediate support is found at 718.16, followed by the high-volume node at 657.68.
The bearish outlook would strengthen with a confirmed daily close below 730.84, potentially paving the way for a drop toward 647.51. However, a bullish recovery above the December 2024 high could invalidate the bearish setup and open the door for a rally toward the 861.04 resistance area.
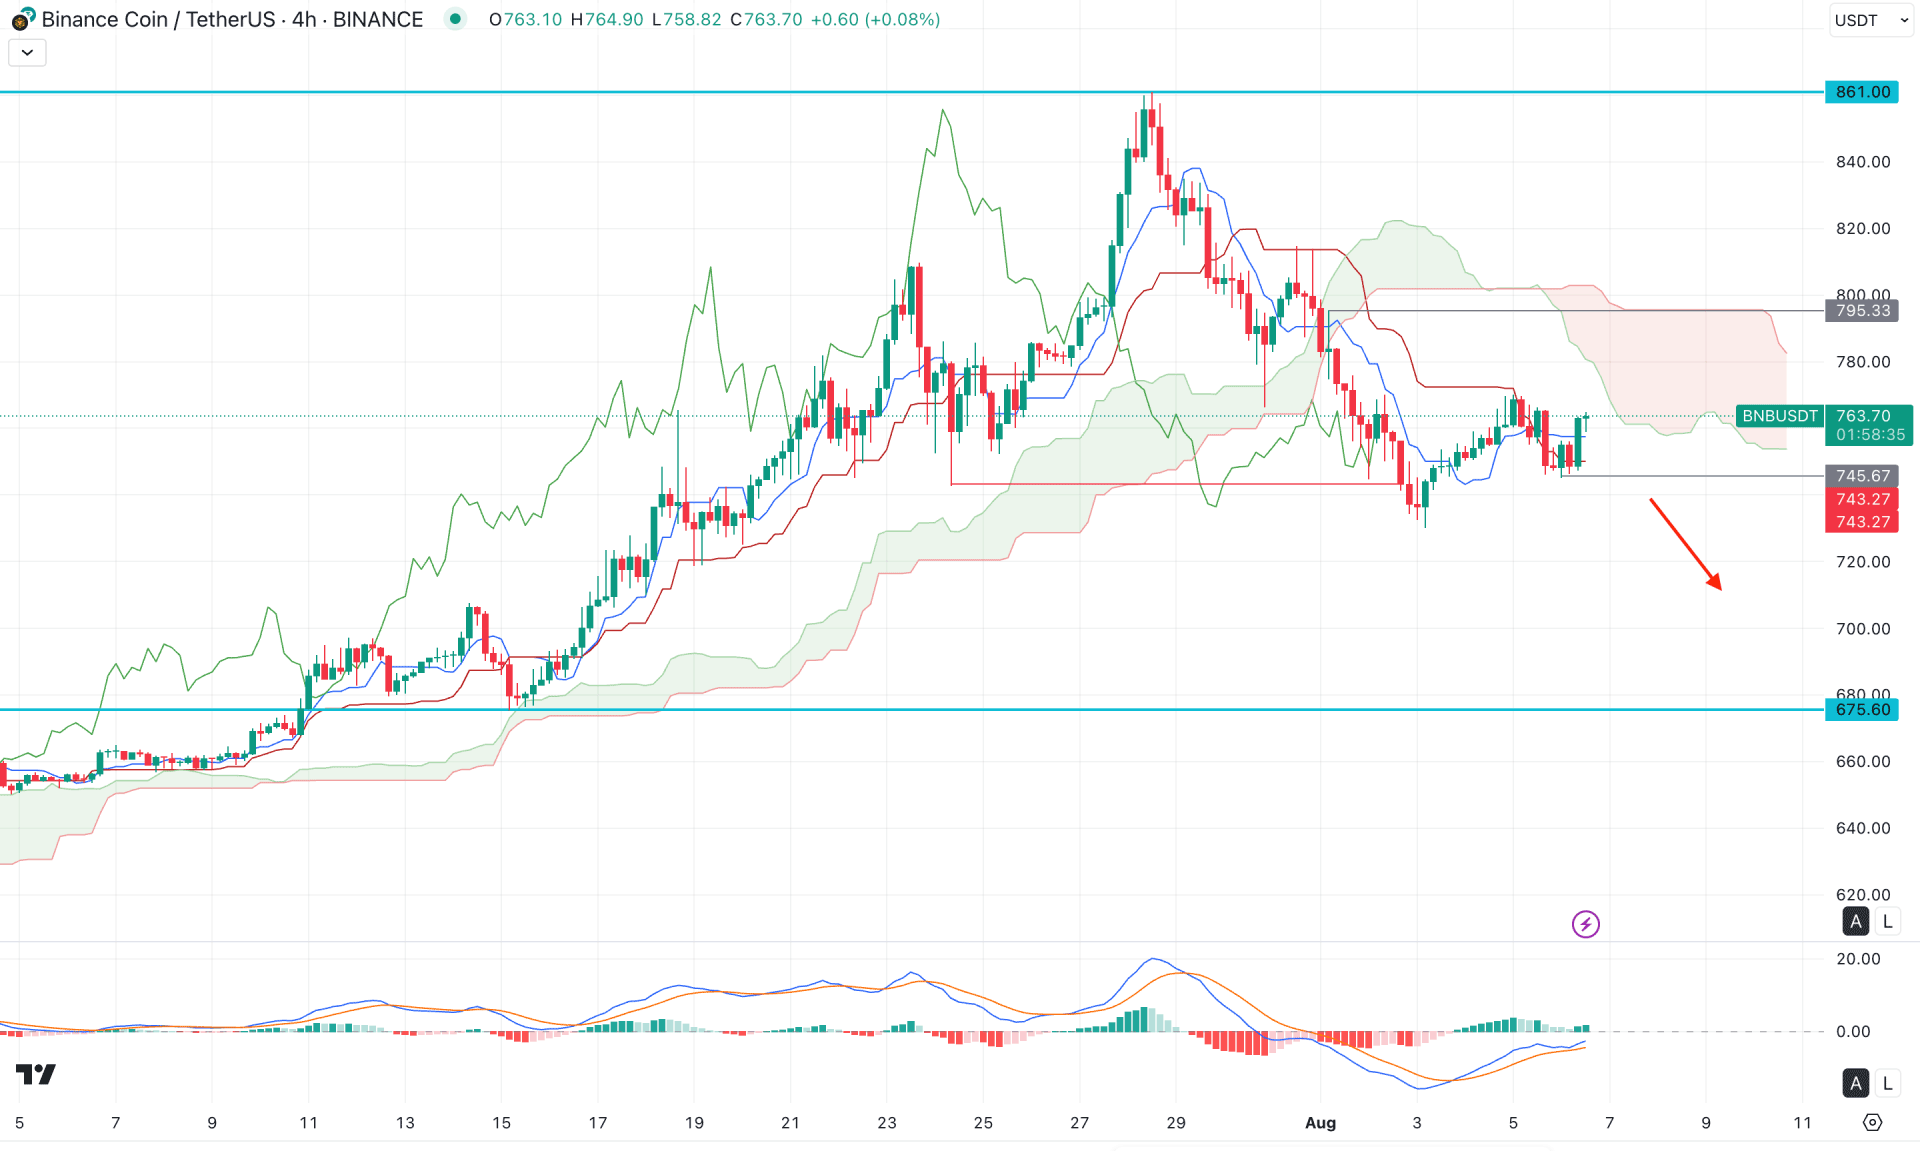
In the H4 timeframe, the most recent price has flipped the position below the Ichimoku Kumo Cloud level, suggesting a potential bearish breakout. Moreover, the thickness in the Future Cloud looks promising to sellers, suggesting a confluence of selling pressure.
On the other hand, a consolidation phase is also visible below the cloud zone, where the most recent price is trading above the dynamic Kijun Sen level.
In the secondary indicator window, the MACD Histogram maintained the bullish position by remaining above the neutral line for a considerable time. Moreover, the signal line has flipped the position and formed a bullish crossover at the neutral area.
Based on the H4 outlook, the downside pressure is questionable as the price failed to hold the momentum below the Kijun Sen line. As a result, a bullish continuation with an H4 close above the 795.33 level could flip the market momentum. In that case, a long opportunity might open, where the main aim would be to test the 861.00 level.
The alternative approach is to find a bearish continuation with an H4 close below the 745.67 level. In that case, the price could extend the selling pressure and find support from the 675.60 low.
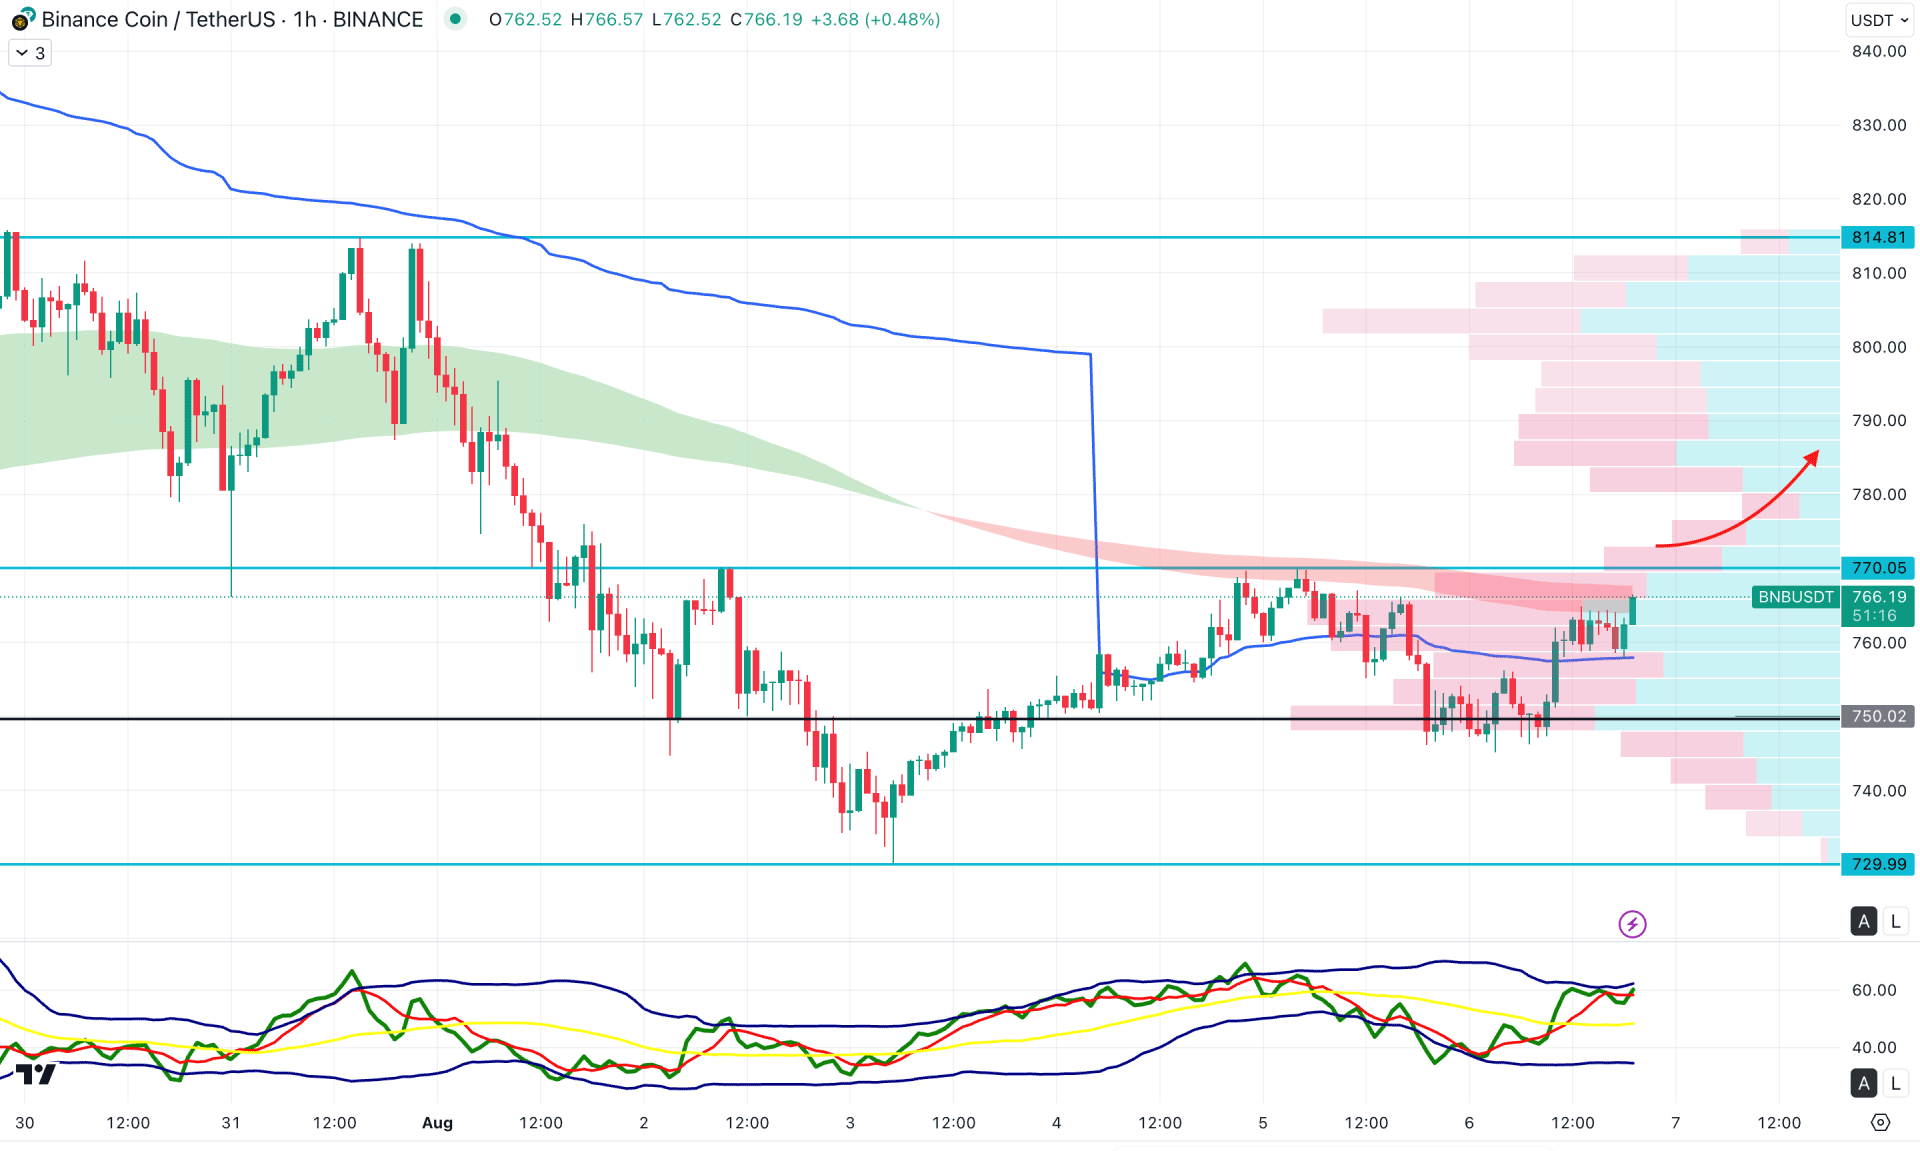
In the intraday chart, bullish pressure is visible as the recent price is hovering above the weekly VWAP line. Moreover, the Visible Range High Volume level is below the current price, working as a major support.
On the other hand, a minor barrier is visible as the EMA wave is still above the current price with a bullish overextension,
Based on this outlook, the intraday momentum is bullish and likely to extend the upward pressure soon. In that case, overcoming the EMA wave with an hourly candle above the 770.00 level could be an immediate long approach.
On the other hand, a failure to hold the momentum above the 750.00 high-volume line could eliminate the entire bullish structure. In that case, a bearish continuation opportunity might open, where the main aim would be to test the 718.79 static level.
Based on the overall market outlook, BNB/USDT is trading at the premium zone, from where a sufficient bearish correction is pending before offering a long opportunity. As the price reached the peak, investors should monitor how it stalls at the daily mid Bollinger Bands level.
The intraday price remains bullish, but further confirmation will be needed after a daily bottom formation.


