
Published: November 23rd, 2022
Q3 result for Best Buy Co Inc was better than the expectation but below the fiscal 2022 forecast. The company expected the full-year comparable sales to be about 10%. Meantime, management underlined that it does not expect Q4 sales to surpass previous expectations.
It seems the management is under-promising to over-deliver once again as the team already has some sight into the holiday season. Especially for an undoubtedly cyclical retailer such as Best Buy, the management style is often observed to have an opposite behavior- missing estimates for excessively optimistic guidance.
In other words, taking good Q3 results into consideration, management expects the holiday season to be similar in 2022 as in 2019. However, obviously, the company is facing gaining output costs as other retailers and struggling to pass those on to end consumers. It occurs as evidenced by operating margin weakening. However, this effect is similar to temporary to some extent as a well-run company, which is a sign that the buying pressure in this instrument is potent for the near future.
Let’s see the future price of Best Buy Co stock (BB) from the multi-timeframe analysis:
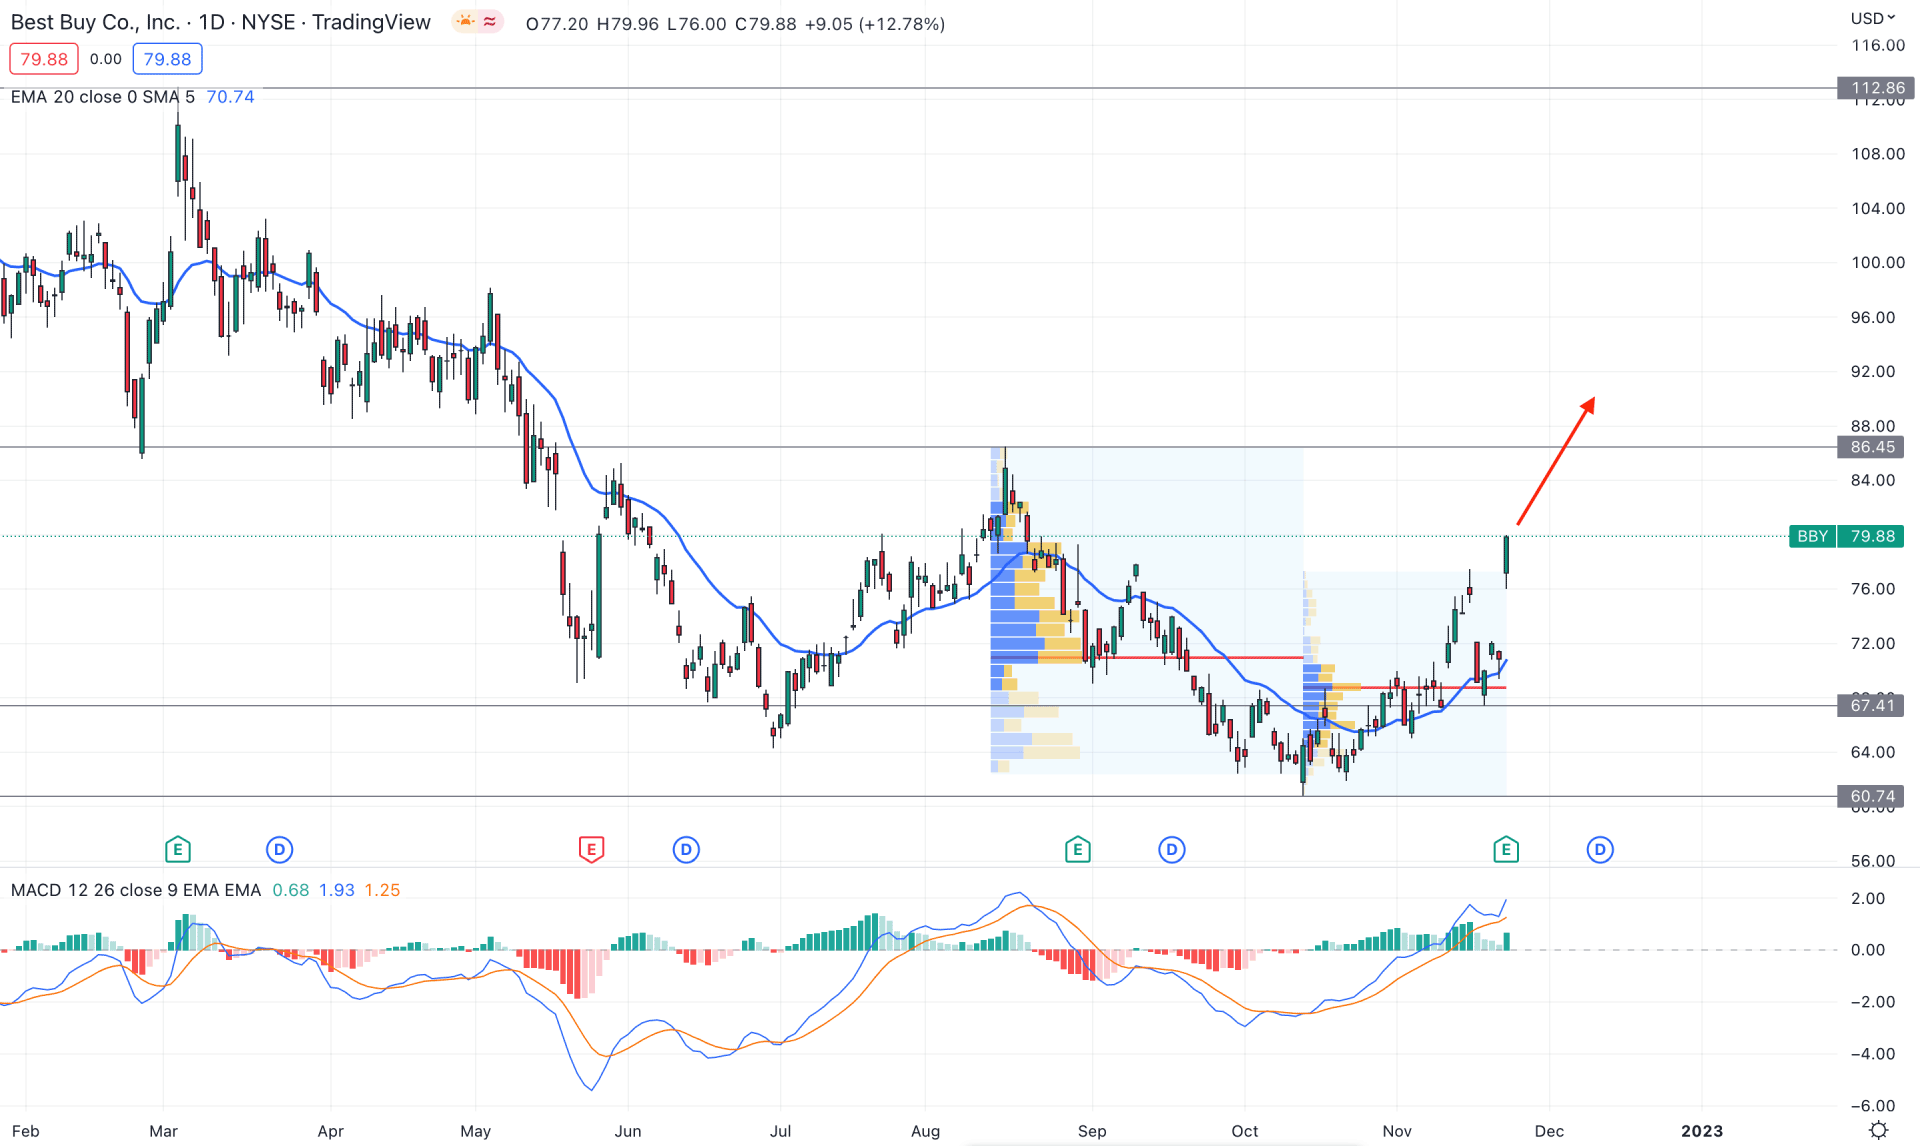
In the daily chart, The broader outlook of BB is clearly bullish as the recent earnings report came with a massive 13% increase in the daily candle. Moreover, there is a strong buyers' presence in the price that initiated the buying momentum from a reliable consolidation zone.
Based on the fixed range high volume indicator, the highest trading volume in the daily price is at 68.67 level, from October low to the current high. It is a sign that the buying pressure was present before the earnings report release, which could extend in the coming days.
If we analyze the price from left to right, it is clearly visible that the 112.86 level is the top, from where a bearish Quasimodo pattern appeared with a selling momentum. As the current price is trading at the discounted level from 112.87 high to 60.74 low, any bullish opportunity could offer a reliable trading opportunity.
In the main price chart, the dynamic 20 Day Exponential Moving Average is below the price and acting as a support level. Meanwhile, the MACD Histogram is bullish above the neutral line, while MACD lines are showing buying pressure.
Based on the current market outlook, a bullish trend continuation opportunity needs validation from the intraday chart, which could offer a long opportunity toward the 86.45 resistance level.
The alternative trading approach is to wait for the price, coming below the 20-day EM before aiming for the short opportunity.
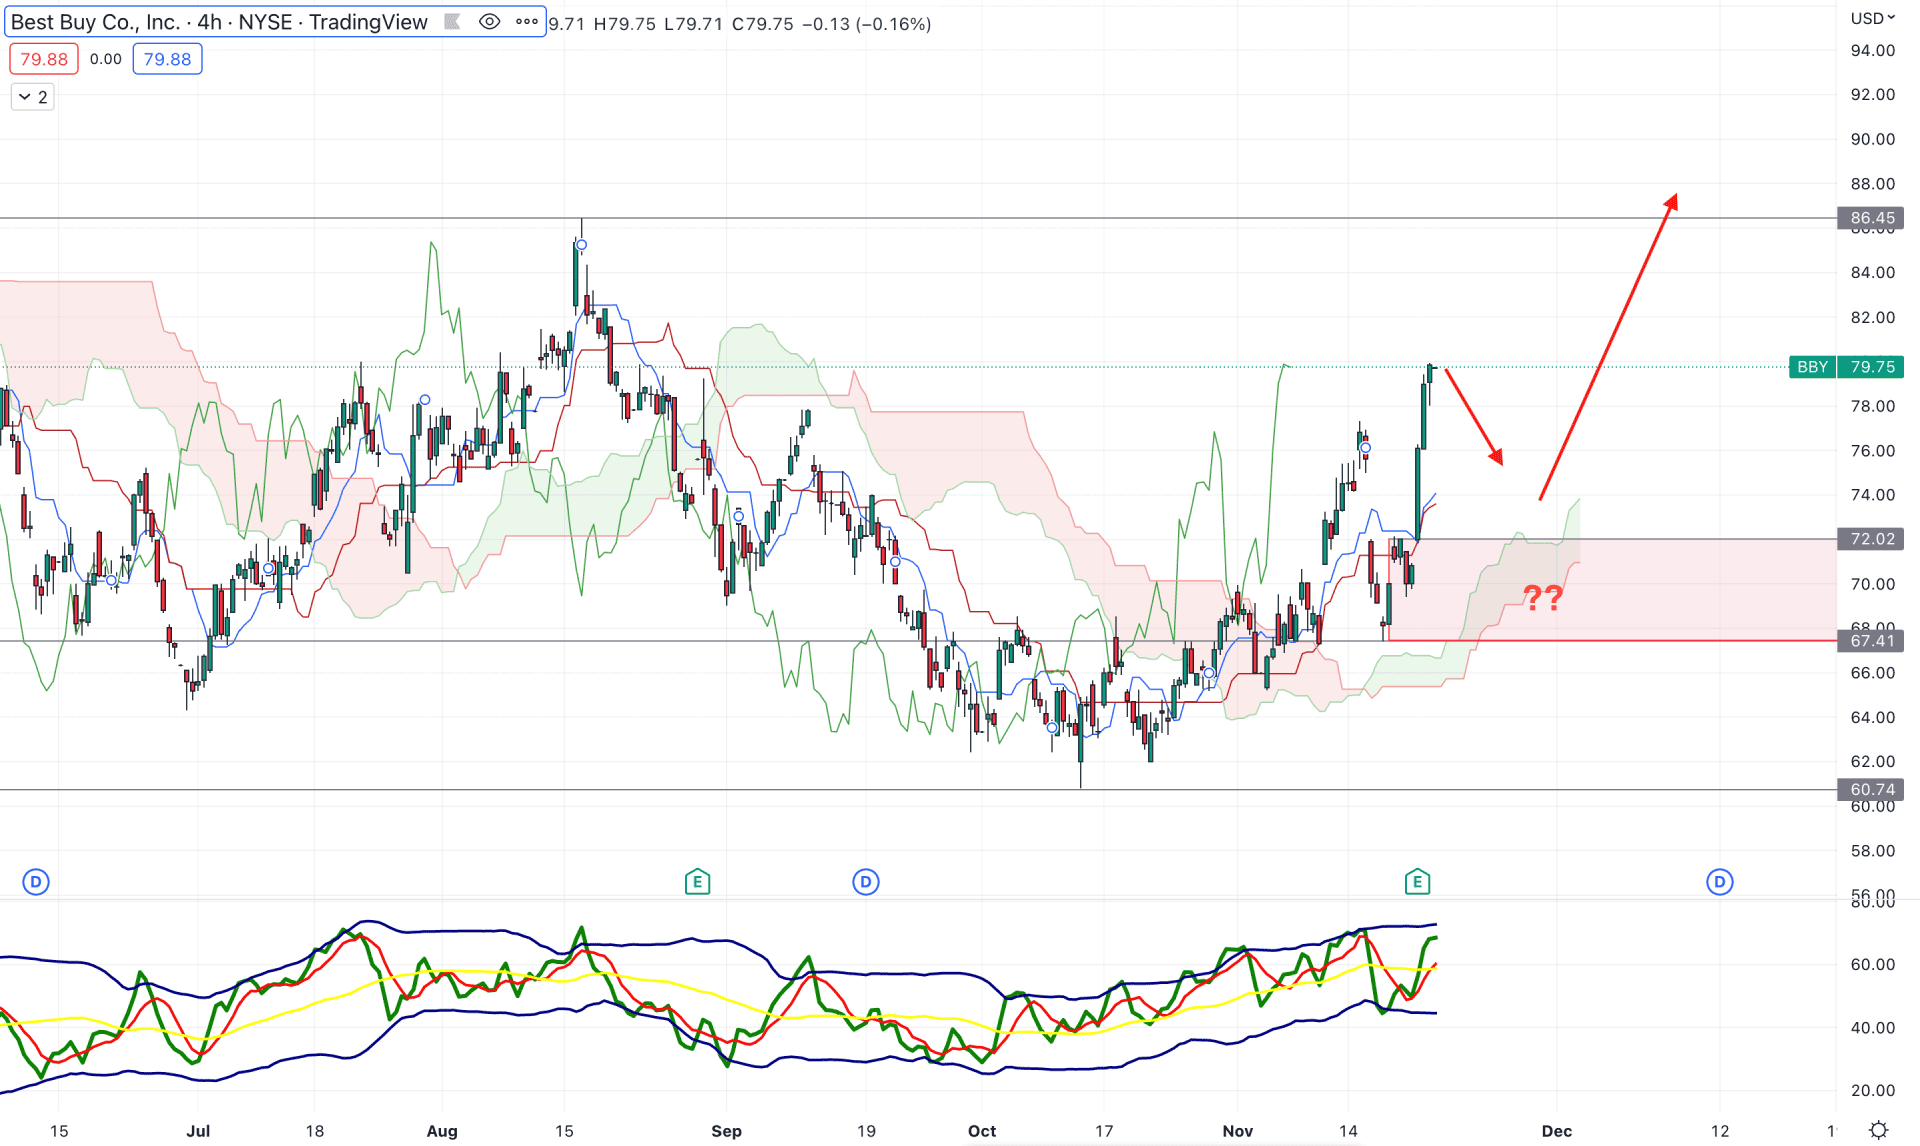
In the 4-hour chart, the bullish outlook in the BB price is potent as the current price is aiming higher above the Kumo Cloud area. Moreover, the Senkou Span A and B are moving higher in the future cloud, which is a sign that bulls are still strong in short-term and medium-term timeframes.
The indicator window shows how bulls are active in the market, where the current TDI level is above the 50% area, backed by a bullish crossover. Moreover, the dynamic Kijun Sen and Tenkan Sen formed a bullish crossover, which is a sign of strong buyers’ presence in the market.
Based on the current H4 outlook of BB stock, the bullish possibility is solid, where a minor bearish correction is pending. In that case, investors should wait for a bearish recovery and a bullish rejection from the 72.02 to 67.41 zone, from where a bullish opportunity may come.
On the other hand, the bearish possibility is valid once the price makes a new low below the 67.41 support level, where the main aim is to test the 60.74 key support level.
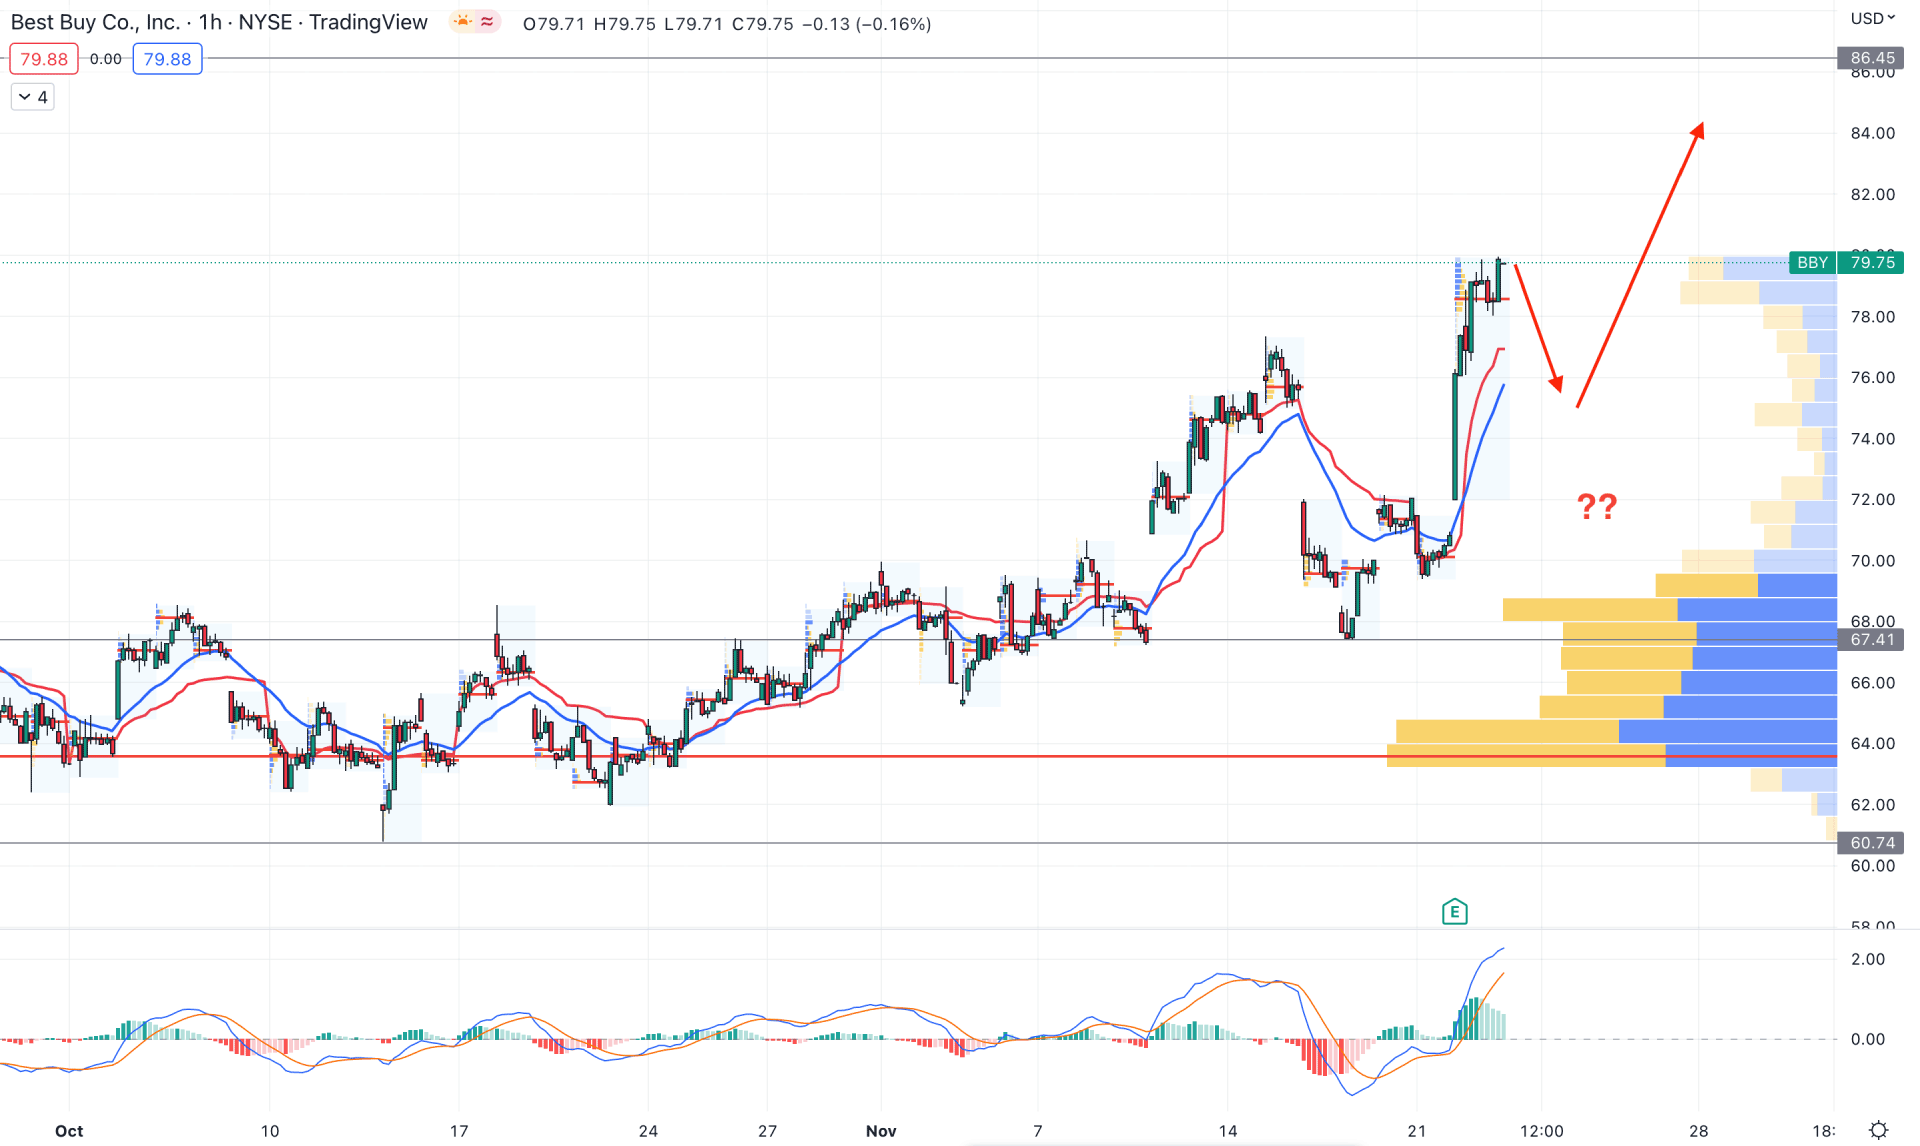
In the Best Buy Stock (BB) H1 timeframe, the current price is trading above the visible range high volume level of 63.60. It is a sign that the current buying pressure is backed by institutional traders’ interest, where any bearish correction could offer a long opportunity.
The dynamic 20 EMA and weekly VWAP are below the current price and might work as immediate support. Moreover, the MACD Histogram is still bullish, which needs to move below the neutral level before offering a short opportunity.
Based on the H1 outlook, the broader market context is bullish for the BB price but a minor bearish correction is pending. In that case, any bullish rejection from the dynamic 20 EMA or 70.01 support level could offer a long opportunity, where the main aim is to test the 86.45 level.
On the other hand, a solid break below the 63.60 level could eliminate the current outlook and open a bearish opportunity toward the 60.00 area.
Based on the current market outlook, a bullish opportunity in the BB price is solid if there is a reliable bearish correction and bullish recovery. Investors should closely monitor the intraday H4 chart as a bullish recovery from the dynamic Kijun Sen zone could offer a profitable buying opportunity.


