
Published: October 18th, 2022
In the latest quarterly earnings report, the Bank of America had 81 cents a share, which is above the expectation of 78 cents a share or $6.4 billion. Revenue topped $24.5 billion, whereas the expectation was $23.5 billion. The most revenue gain comes as net interest income jumped to $13.8 billion by 24%. The Bank had revenue of $22.8 billion and $7.7 billion in profits in a year ago.
Bank of America is one of the big banks expected to fare excellently in the current climate. The spread between deposit and earning interest increases by increasing the interest rate. Year over year, the bank saw loan balance jump by 12%, thanks to placing more funds on their credit cards from households and an enhancement in commercial borrowing.
On the other hand, the Federal Reserve’s continuous rate hike has been a blessing to bank stocks, and there is no expectation for BAC. Let’s see the future price of Bank of America (NYSE: BAC) from the Bank of America (BAC) Technical Analysis:
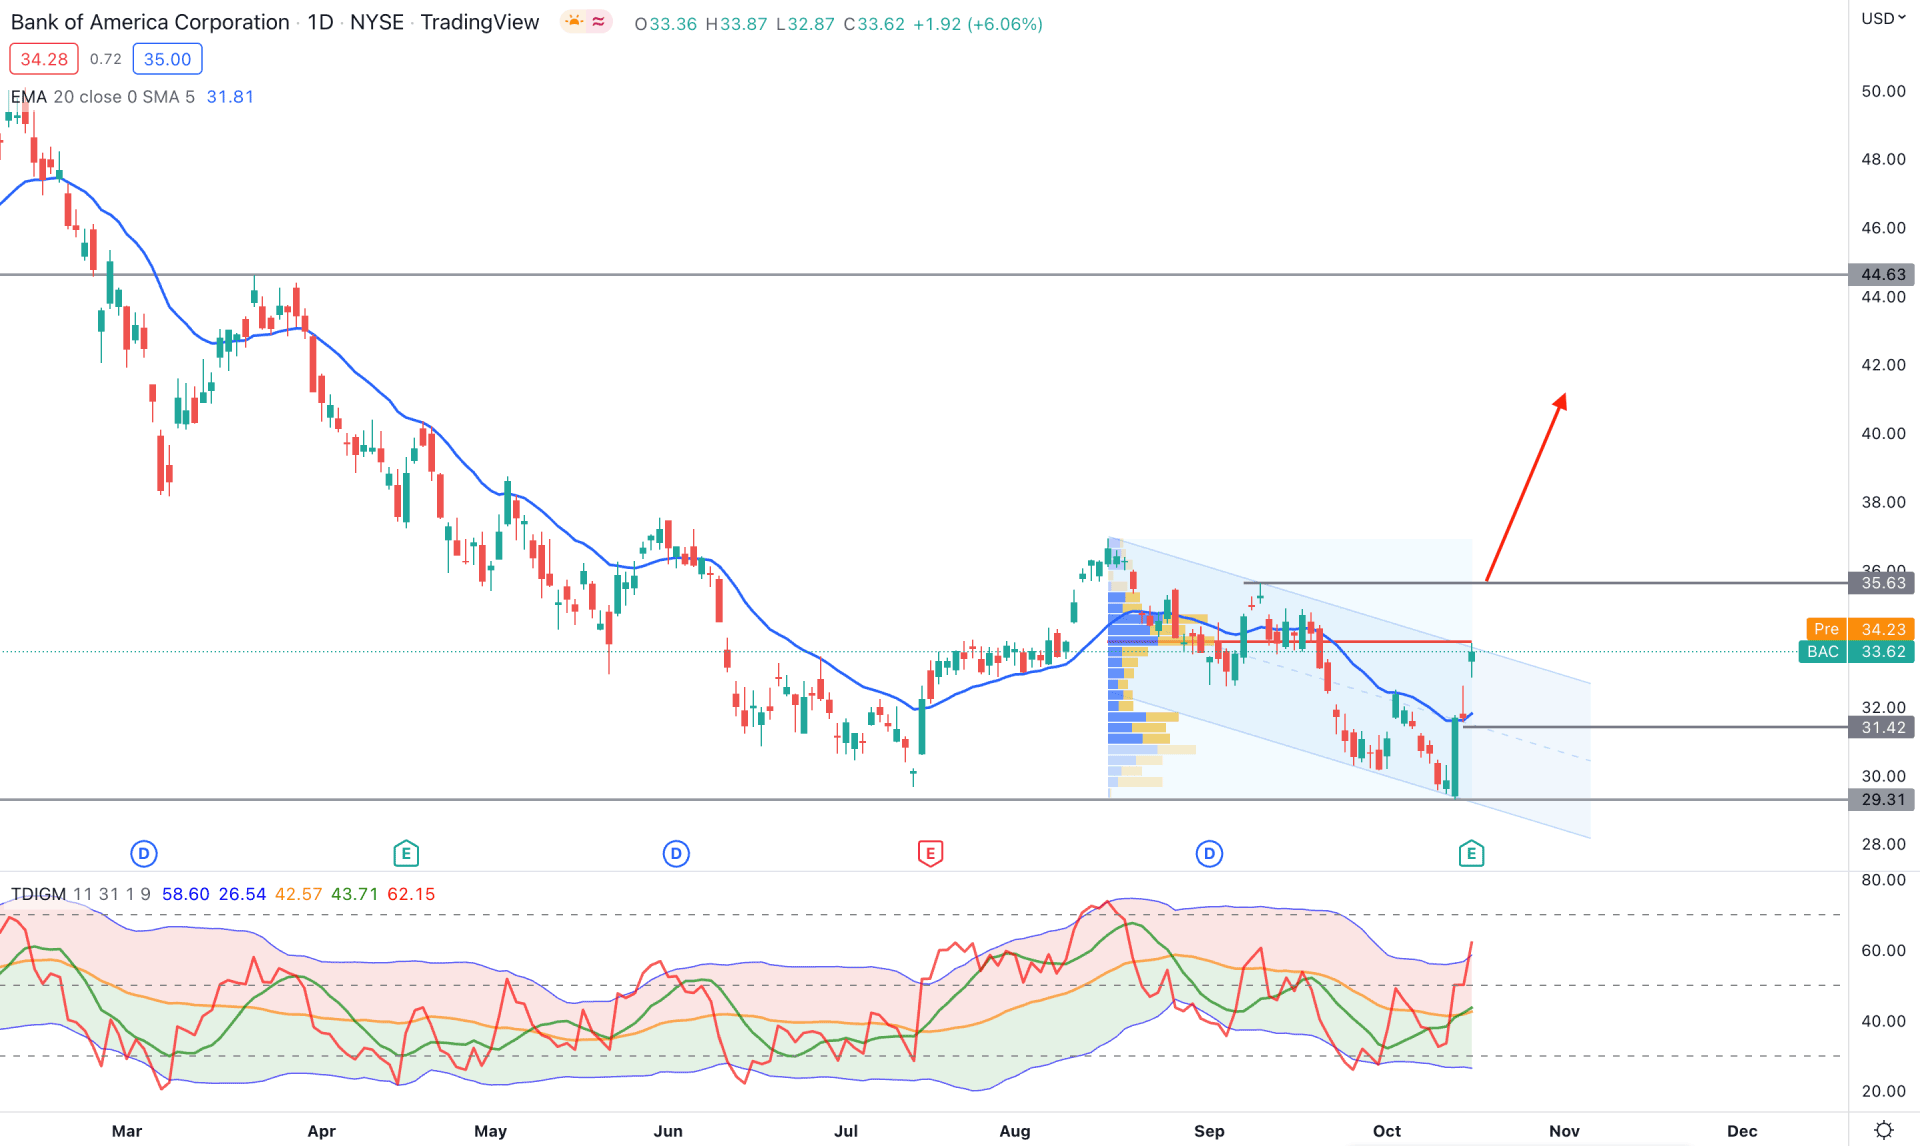
The broader market context for BAC is bearish as the price consistently made lower lows from February high to October low. However, the most recent price showed decent buying pressure as the Q3 report came with upbeat data. Although the buying pressure was solid, it is still trading within a descending channel, from where a bullish breakout is needed.
Based on the visible range high volume indicator, BAC is still trading below the highest activity level in the last three months. Therefore, the primary outlook of this instrument is to find the price above the 33.94 high volume level before aiming for a 24% gain to the 44.63 resistance level.
In the main price chart, the price formed a bullish breakout above the 20-day Exponential Moving Average, which came with a liquidity hunt below the 29.66 swing low. However, the price failed to close above the channel resistance, which increased the possibility of another bearish correction before aiming higher.
The indicator window shows extreme bullish pressure in the market, where the current TDI level is at an overbought area. However, the bullish momentum would be strong until the TDI line comes below the 50% neutral line.
Based on the daily structure, a bullish breakout above the 33.94 level could offer a buying opportunity, targeting the 44.63 resistance level. The alternative approach is to find a strong bearish rejection with a daily close below the 20 DMA before aiming towards the 28.00 level.
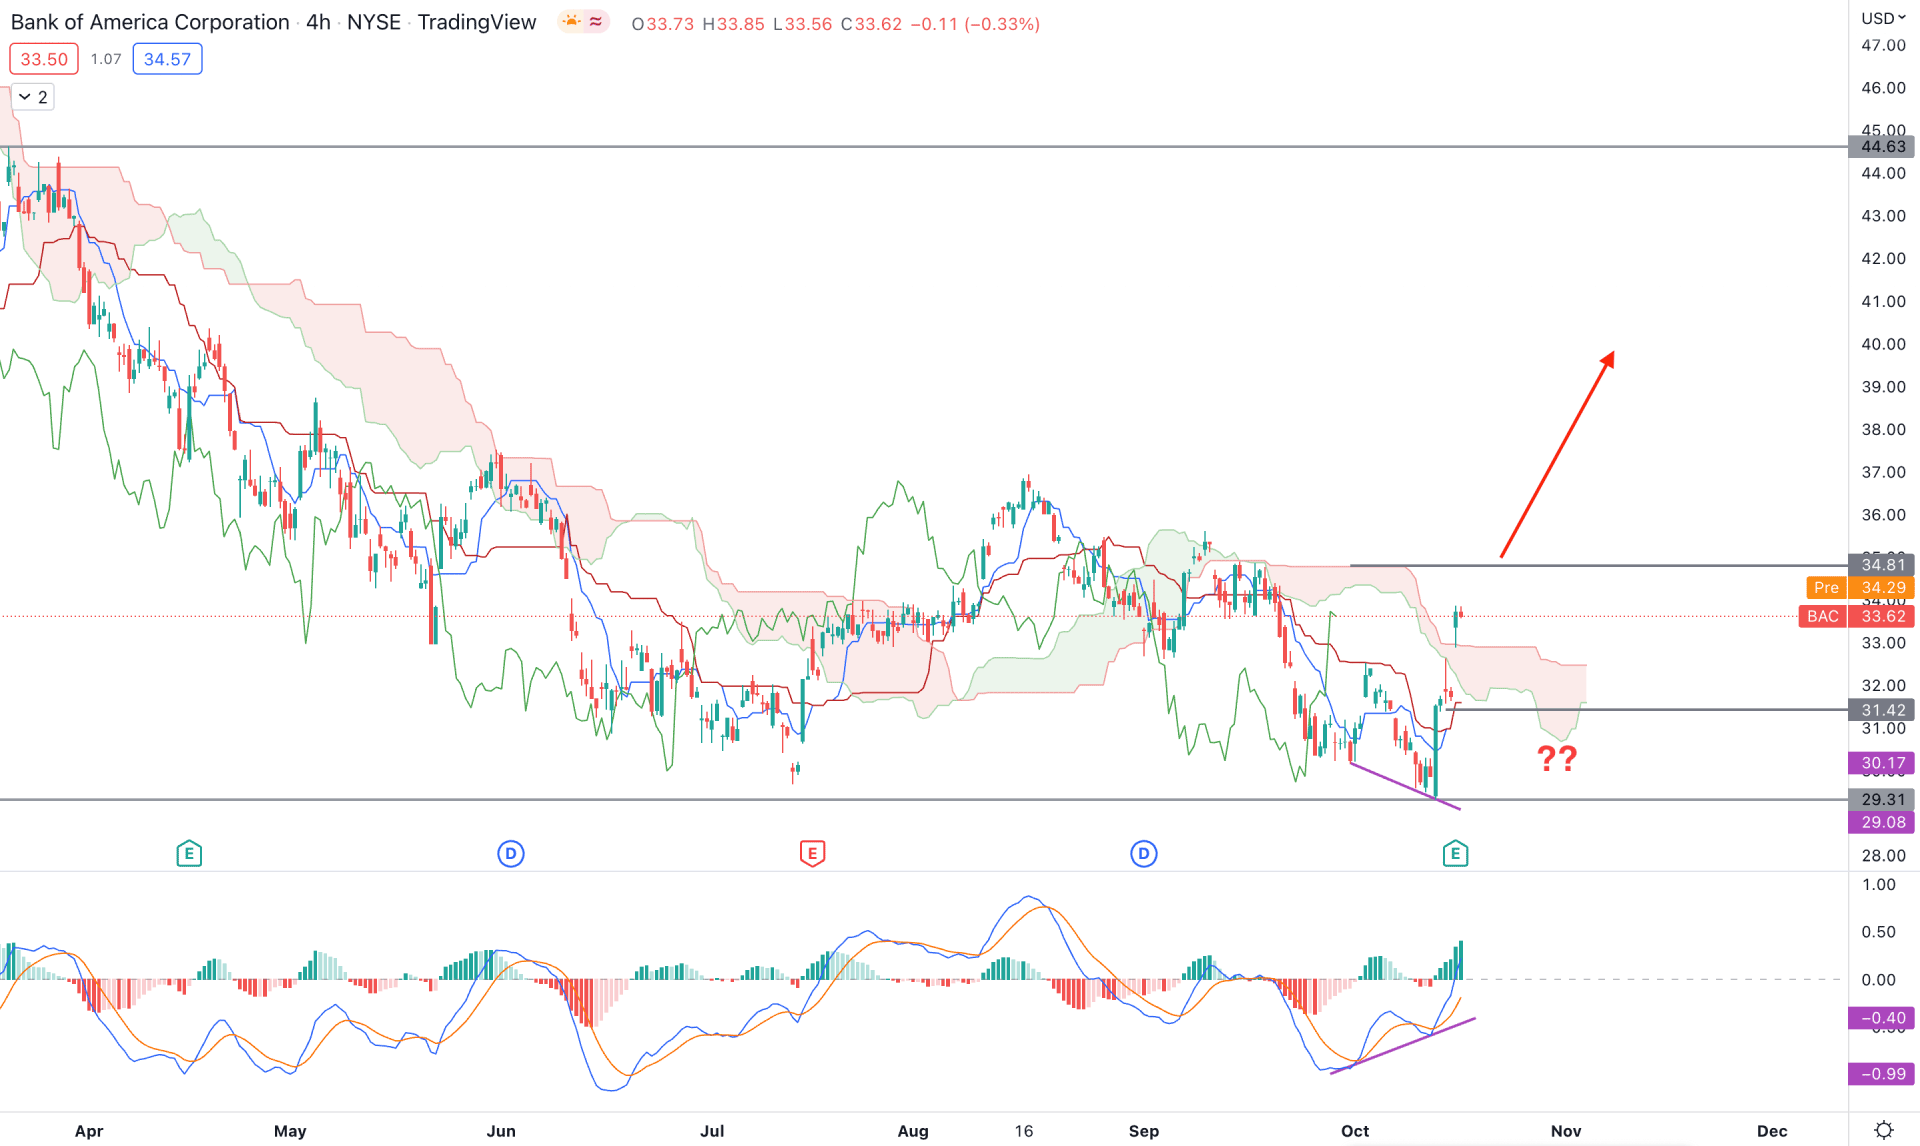
In the H4 chart of BAC, the existing bearish trend has become weaker with a bullish breakout above dynamic levels. Moreover, the price soared higher above the Cloud zone and formed a strong H4 close. Therefore, investors should closely monitor near-term swing lows to find a bullish opportunity in this instrument.
The future cloud is still bearish, but the Senkou Span A started to Move higher, while the Senkou Span B remained flat. The indicator window also shows a buying pressure with a positive MACD Histogram, followed by divergence.
Based on the H4 structure, an immediate buying pressure with an H4 close above the 34.81 level could open a bullish opportunity. Moreover, another opportunity would be a minor correction and additional bullish rejection from 33.00 to 31.00.
On the other hand, if the price comes below the 31.00 level and forms a bearish H4 candle, we can consider the upside possibility as invalid. In that case, any bearish opportunity targeting the 28.00 psychological level.
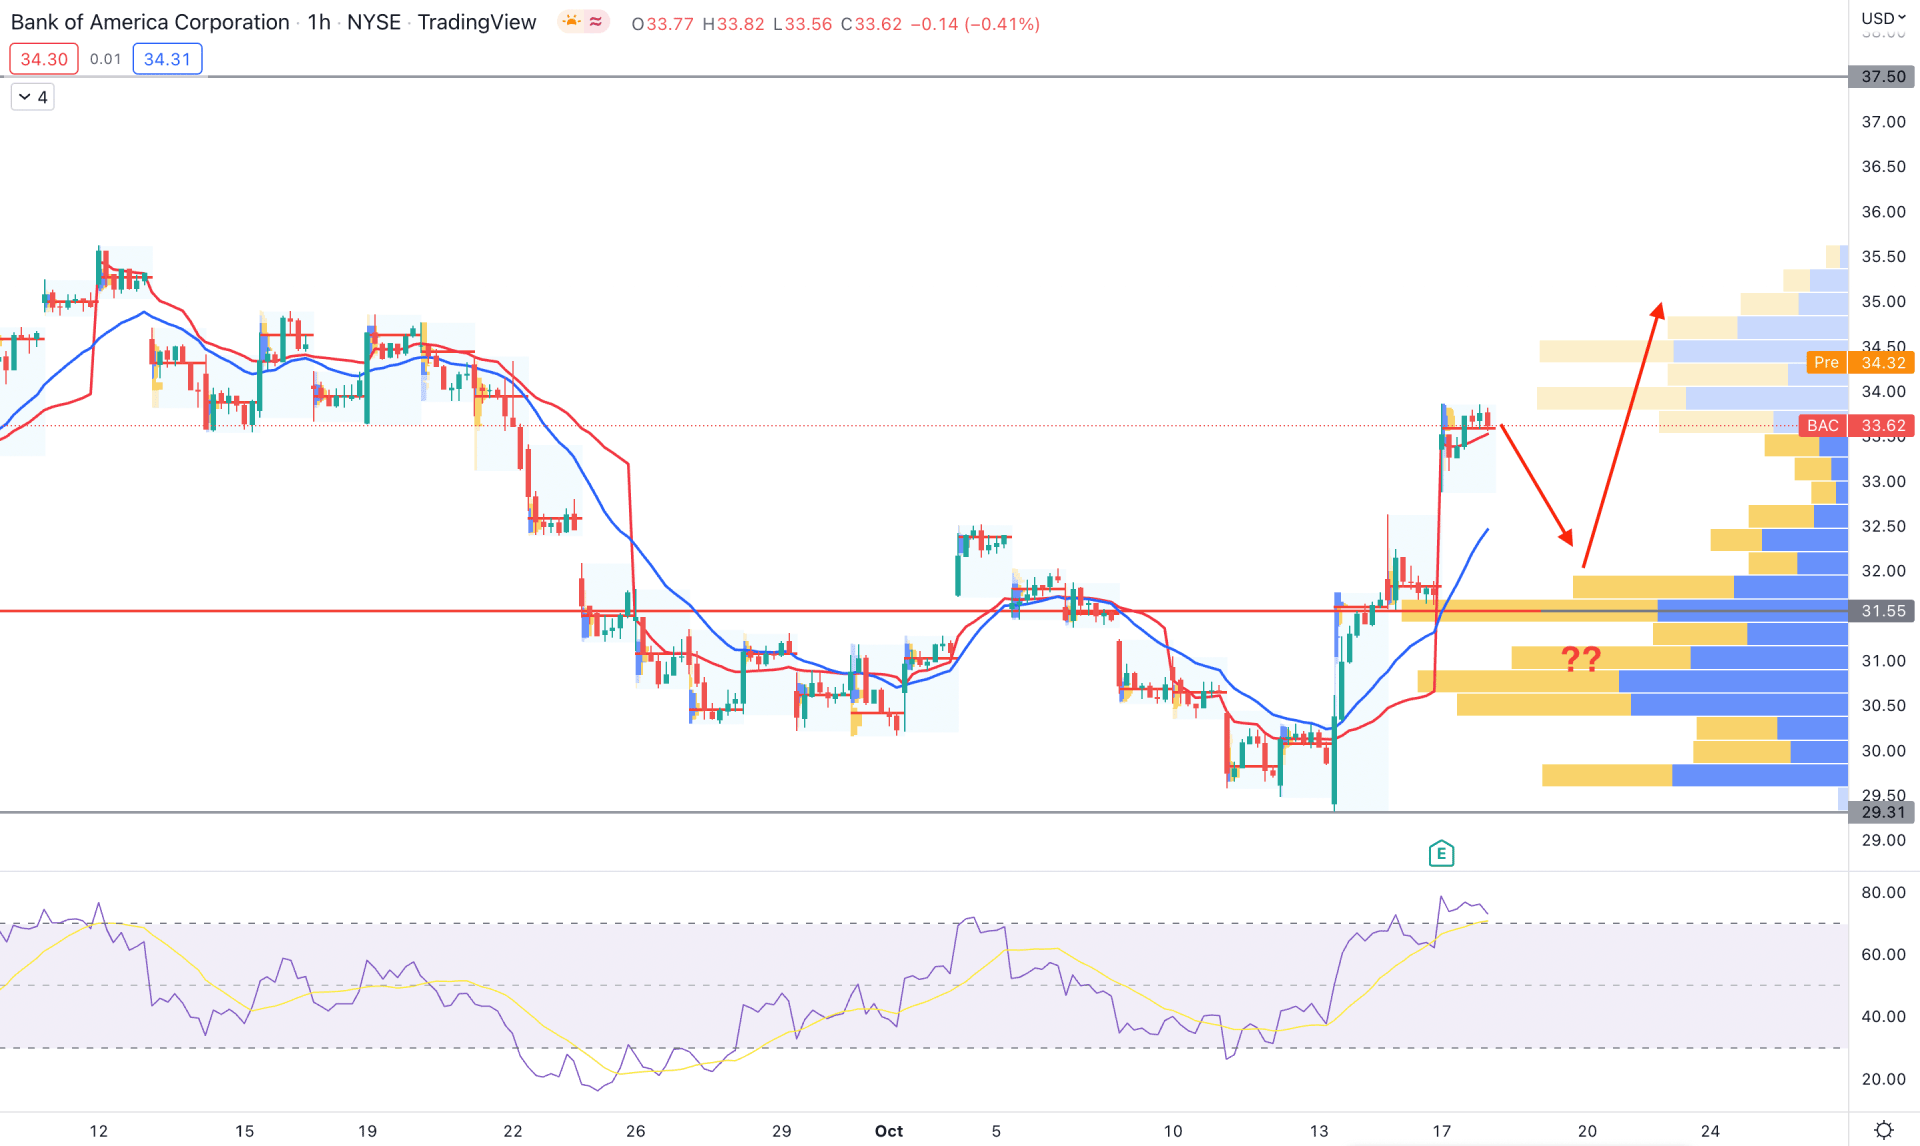
The intraday chart also shows buying pressure as the current visible range high volume level of 31.55 is below the impulsive bullish pressure. It is a sign that the upside pressure from the earnings report sentiment came with a solid volume change.
The extreme bullish pressure made a breakout above the dynamic 20 EMA and weekly VWAP, which indicates a strong buyers' presence in the intraday market. However, the gap between the price and 20 EMA extended while the Relative Strength Index (RSI) moved beyond the 70% overbought zone. It is a sign that a minor bearish correction is still pending before forming the actual move towards the near-term key resistance level.
As per the price outlook from the H4 chart, any buying pressure from 31.55 to 33.00 would be a bullish opportunity, targeting the 37.50 level. The alternative approach is to wait for the price, coming below the 31.50 level, which could offer a bearish opportunity.
Based on the current multi-timeframe analysis, Bank of America (BAC) could offer a bullish opportunity if intraday price action forms bullish rejections. In that case, the main aim is to find the price at the 44.63 level with a 24% gain.


