Published: January 15th, 2025
Over the previous year, Bank of America's stocks have outpaced the S&P 500 index by a significant margin (+37% vs. +23%), while they have somewhat underperformed their peer JPMorgan (+37% vs. +43.4%).
A relaxing Fed and predictions of pro-growth, reduced restrictive regulatory measures from the Trump administration are two factors contributing to the stock's current high performance. Many in the market anticipate this week's fourth-quarter earnings announcement, which the firm releases in the early hours of Thursday, January 16th, to boost this performance.
According to the analyst, non-interest revenue is expected to increase 9.7% in 2024 and just 1.8% in 2025. Costs will continue to be high because of ongoing franchise investments. In 2024, investors anticipate a 1.2% increase in total non-interest expenditures. Rate reductions will have a favorable effect on the business's net interest income (NII), even while excessive funding costs remain a worry.
The business intends to enhance its digital capabilities and create financial centers in both new and existing areas. These will support the top line. In 2024, we predict a 3.1% increase in overall revenues.
Let's see the future price direction from the BAC technical analysis:

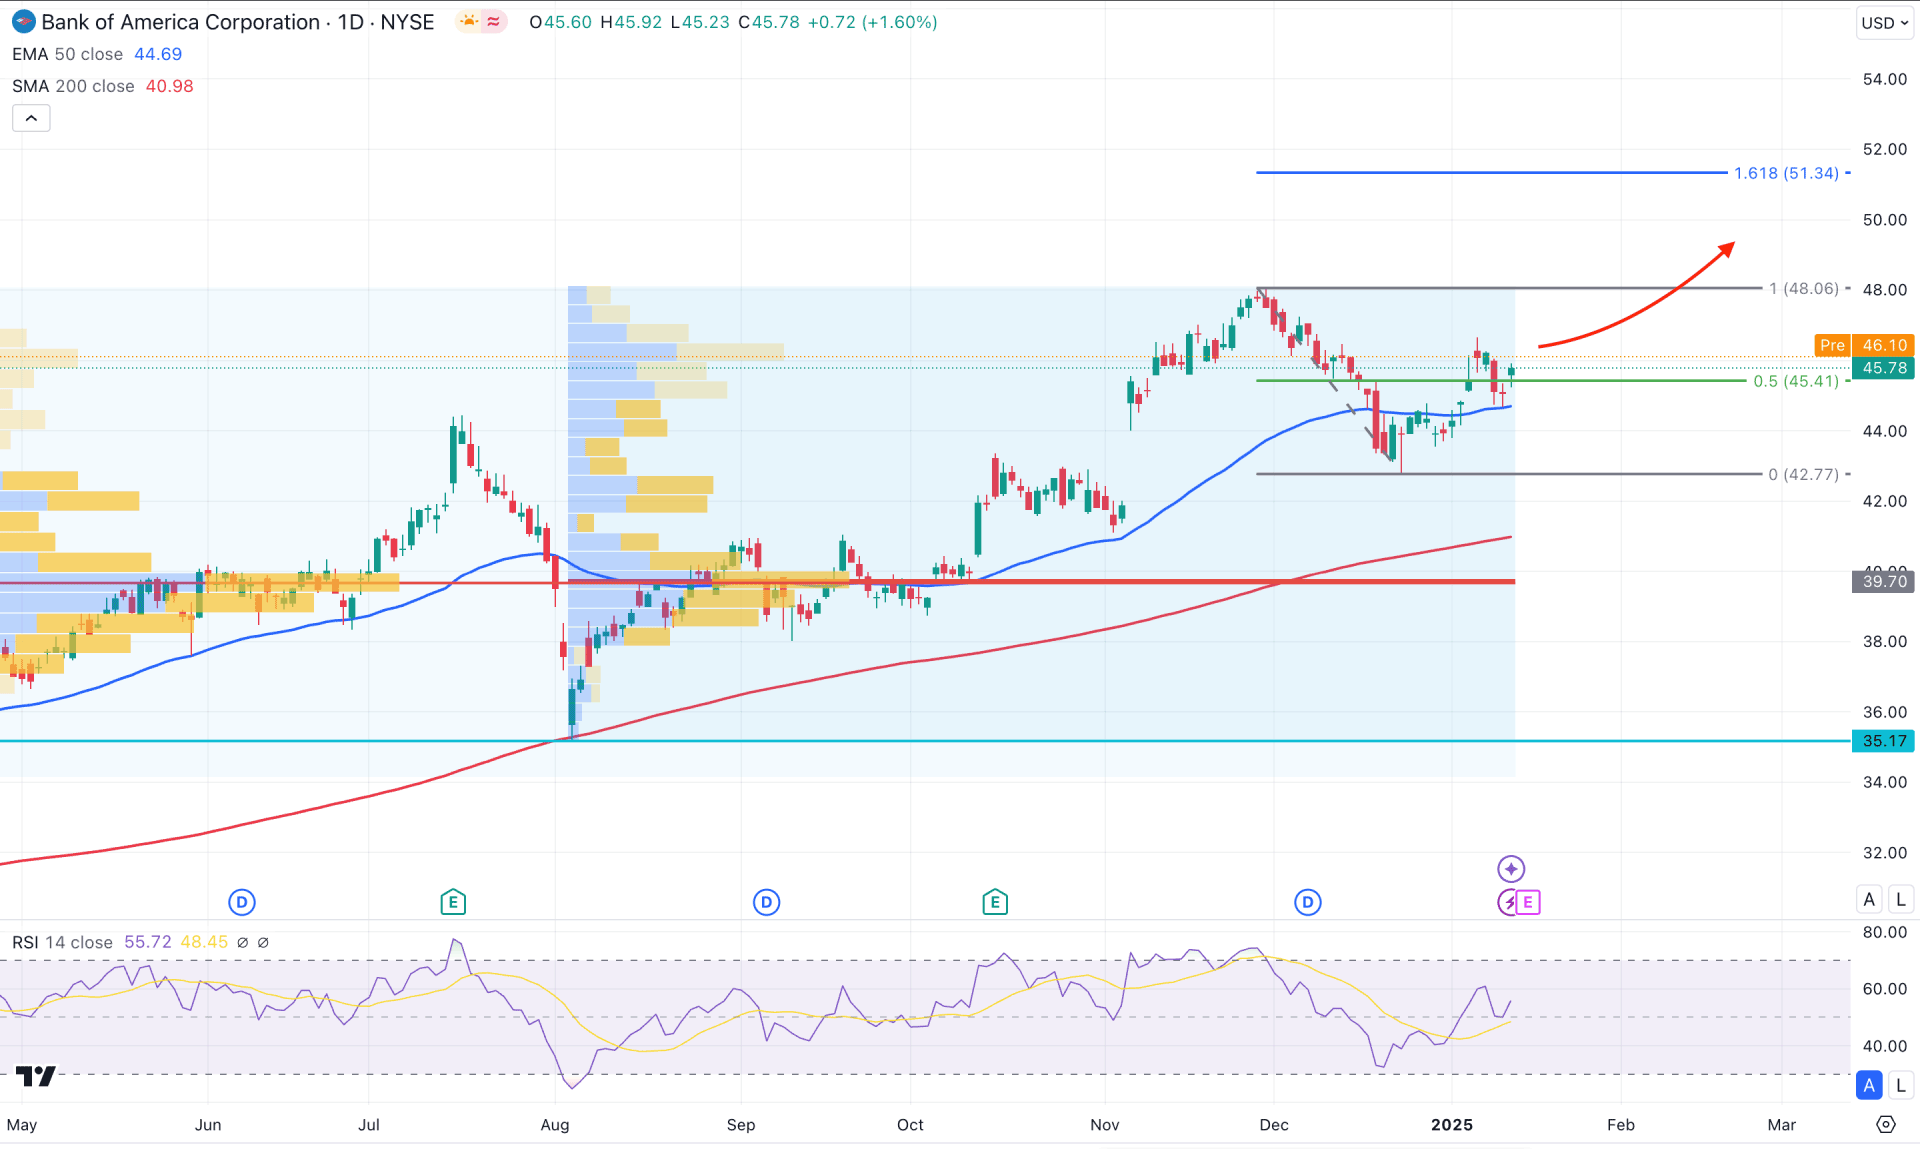
In the daily chart of BAC, the long-term market outlook is bullish, supported by a decent recovery from the August 2024 dip. Primarily, investors might expect the upward continuation to extend until exhaustion appears at the top.
In the higher timeframe, the December 2024 close was bearish, but it failed to breach the November low. As the current bullish continuation is supported by a bullish inside bar formation, an upward extension above the December high could be a potential trend continuation opportunity.
The volume shows institutions' activity in the market, where the most active level since April 2024 and August 2024 is 39.70 levels. As long as the highest activity level remains below the current price, investors might expect the bullish continuation to extend.
In the tradable range, the recent downside recovery from the 48.06 high could be a potential peak, from where a decent recovery has come towards the 42.77 level. As the most recent price reached beyond the 50% Fibonacci Retracement level of this range, more clues are needed before anticipating an upward continuation.
In the broader structure, the 200-day SMA and 100-day SMA are below the 42.77 low, acting as a major support. Moreover, the 50 day Exponential Moving Average is just below the current price and acting as an immediate support.
Based on the current market outlook, BAC bullish continuation awaits validation from the upcoming earnings report. Primarily a better-than-expected quarterly earnings report with a daily close above the 46.66 swing high could extend the buying pressure above the 48.00 level. Moreover, a consolidation above the 48.06 high might extend the momentum towards the 51.34 and even 60.00 level.
On the bearish side, a selling pressure with a daily candle below the 42.77 level could be the early bearish sign. A consolidation below this level could extend the bearish pressure towards the 35.17 static level.

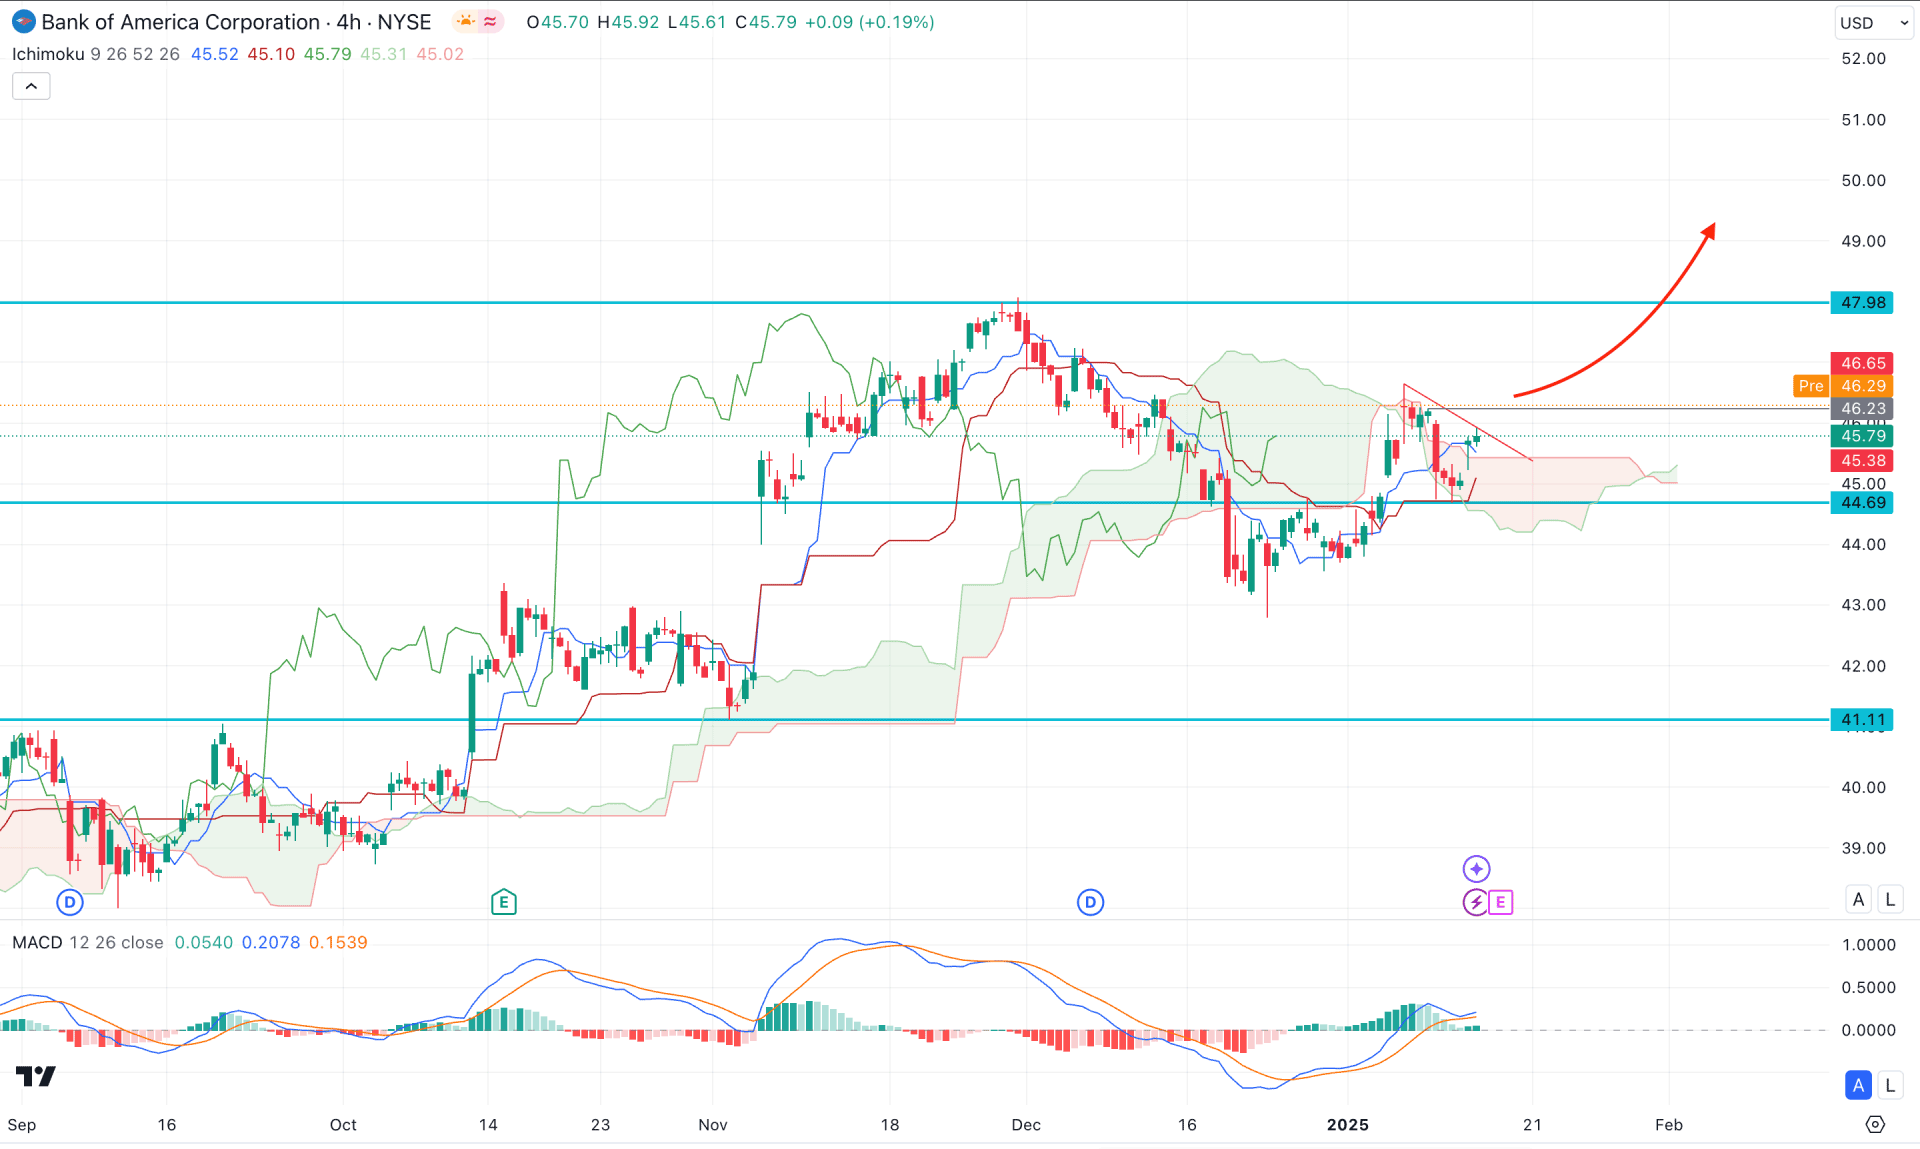
In the H4 timeframe, the recent bullish U-shape recovery came with a counter impulsive pressure, taking the price above the Ichimoku Cloud zone. Moreover, the bullish recovery came with corrective selling pressure before showing another buyers' attempt from the cloud support.
Moreover, the Tenkan Sen and Kijun Sen supports are below the current price, working as an immediate barrier to sellers. Moreover, the thickness of the Futures Cloud looks optimistic as the Senkou Span A aimed higher.
Based on this outlook, investors should monitor how the price reacts on the trendline resistance, a successful break with the recovery of 48.23 level could validate the long opportunity, aiming for the 47.96 level.
On the other hand, the 45.79 to 46.23 level would be a crucial zone to look at as a valid selling pressure from this zone could lower the price towards the 44.00 area.

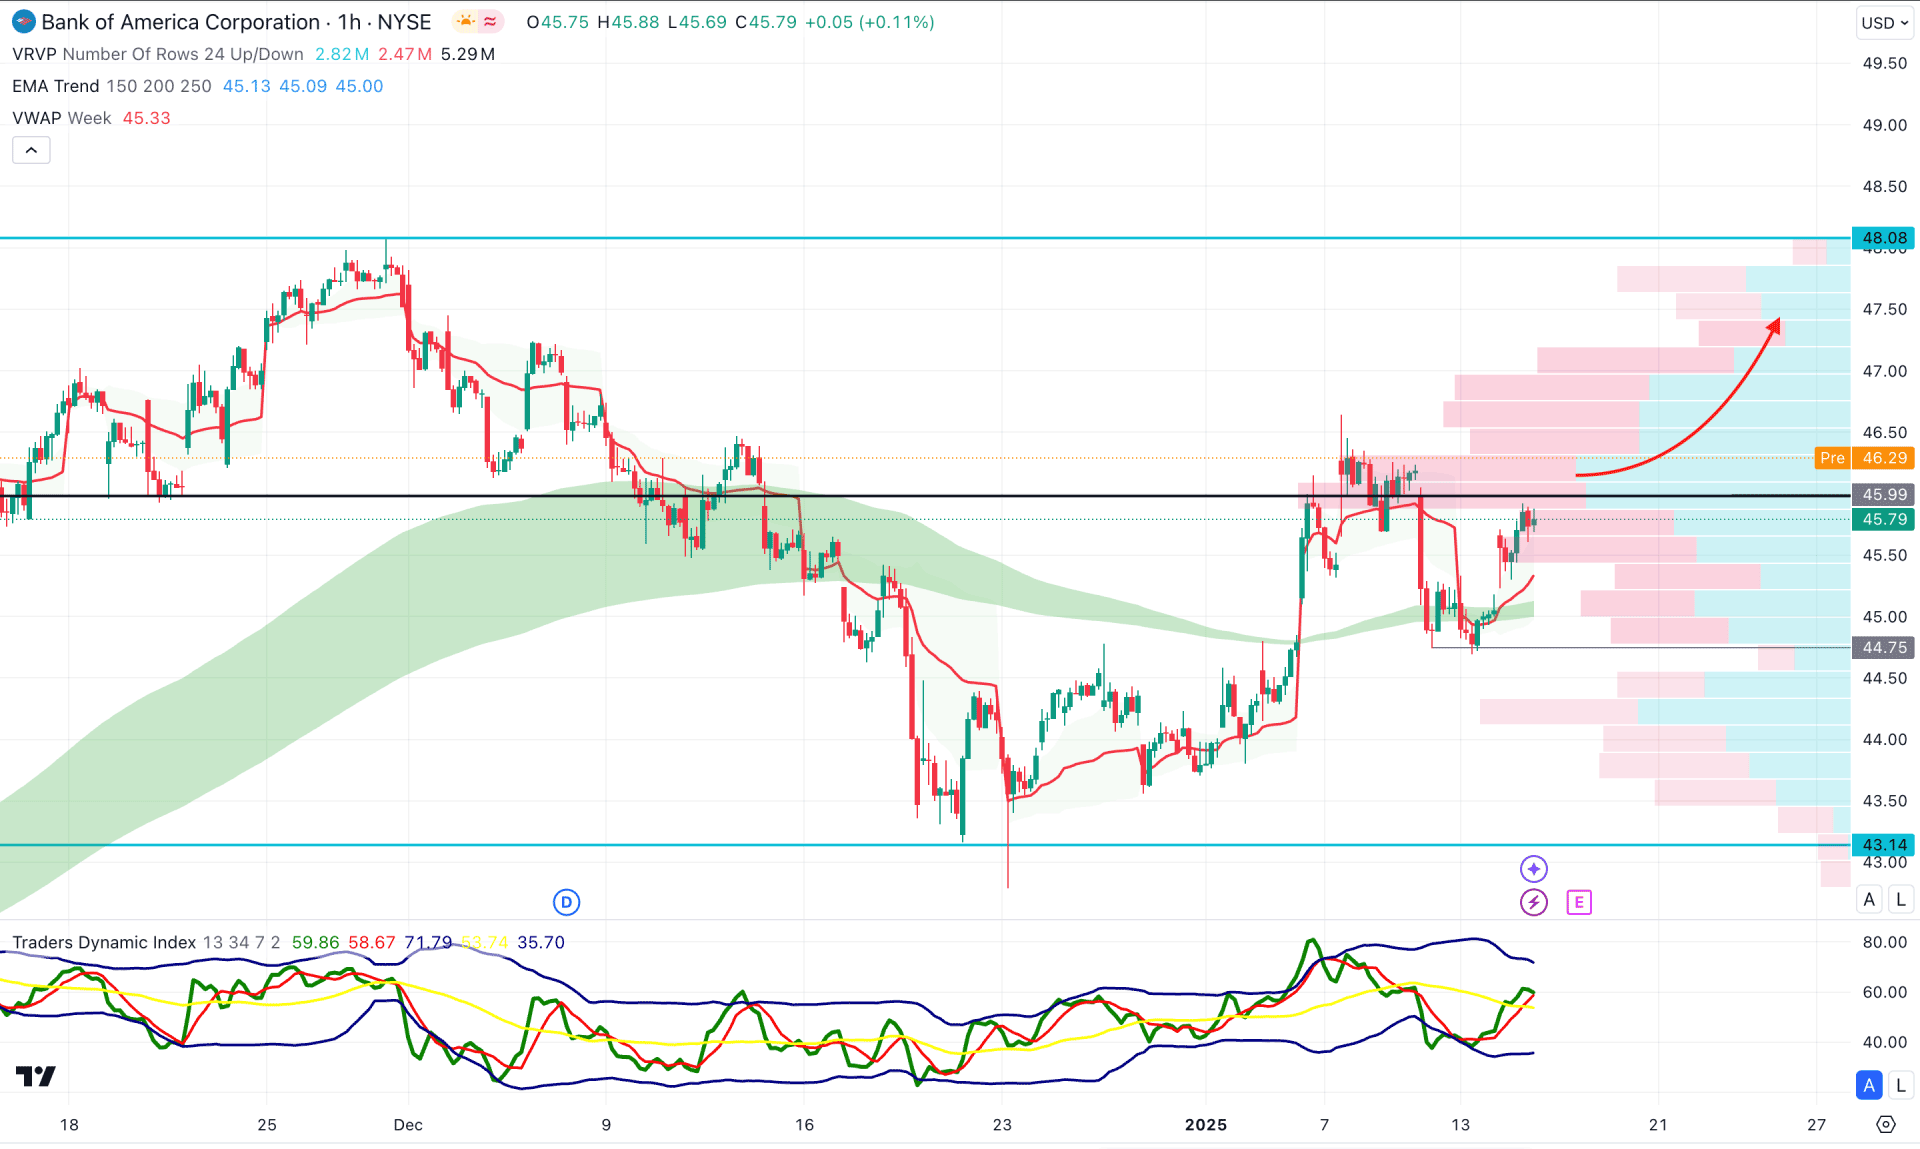
In the hourly time frame, the BAC price is facing resistance from the intraday high volume line, which needs to recover before forming a bullish trend.
On the other hand, the Moving Average Wave is acting as a major support as the current price hovers above the zone, supported by the weekly VWAP.
Based on this outlook, the upward pressure in the TDI line with the recovery of the intraday high volume line could open a long opportunity, aiming for the 48.00 level.
On the other hand, any immediate selling pressure with an hourly candle below the weekly VWAP line could initiate a selling pressure towards the 43.14 level.
Based on the current market structure, BAC stock is more likely to extend the gain as no potential sellers are attempting from the top. In that case, the ideal approach is to look for the earnings report as any upbeat result could validate the trend continuation opportunity.