
Published: December 5th, 2023
Band Protocol is a platform for cross-chain data oracles, enabling the interconnection of smart contracts, APIs, and real-world data. The intrinsic cryptocurrency of the platform, referred to as the BAND token, serves a crucial function in the Band Protocol ecosystem.
By staking their tokens, BAND holders can participate in governance and be granted voting rights on protocol updates, modifications, and proposals. Moreover, these tokens function as the mechanism to obtain access to particular data streams on the Band Protocol, granting developers the ability to construct tailored data oracles.
Additionally, BAND tokens serve a pivotal function in contributing to the Band Protocol's network fee coverage by incentivizing validators to process transactions and maintain the network's security.
Band Protocol substantially improves smart contracts by providing dependable data sourced externally, eliminating the need for a central authority or single points of failure. This enables programmers to effortlessly incorporate a wide variety of data into their smart contracts, including but not limited to real-world occurrences, sports results, meteorological information, and stochastic values.
Given the information presented, a substantial surge in open interest for BAND can potentially incite a notable upswing.
Let’s see the further insight of this coin from the BAND/USDT technical analysis:
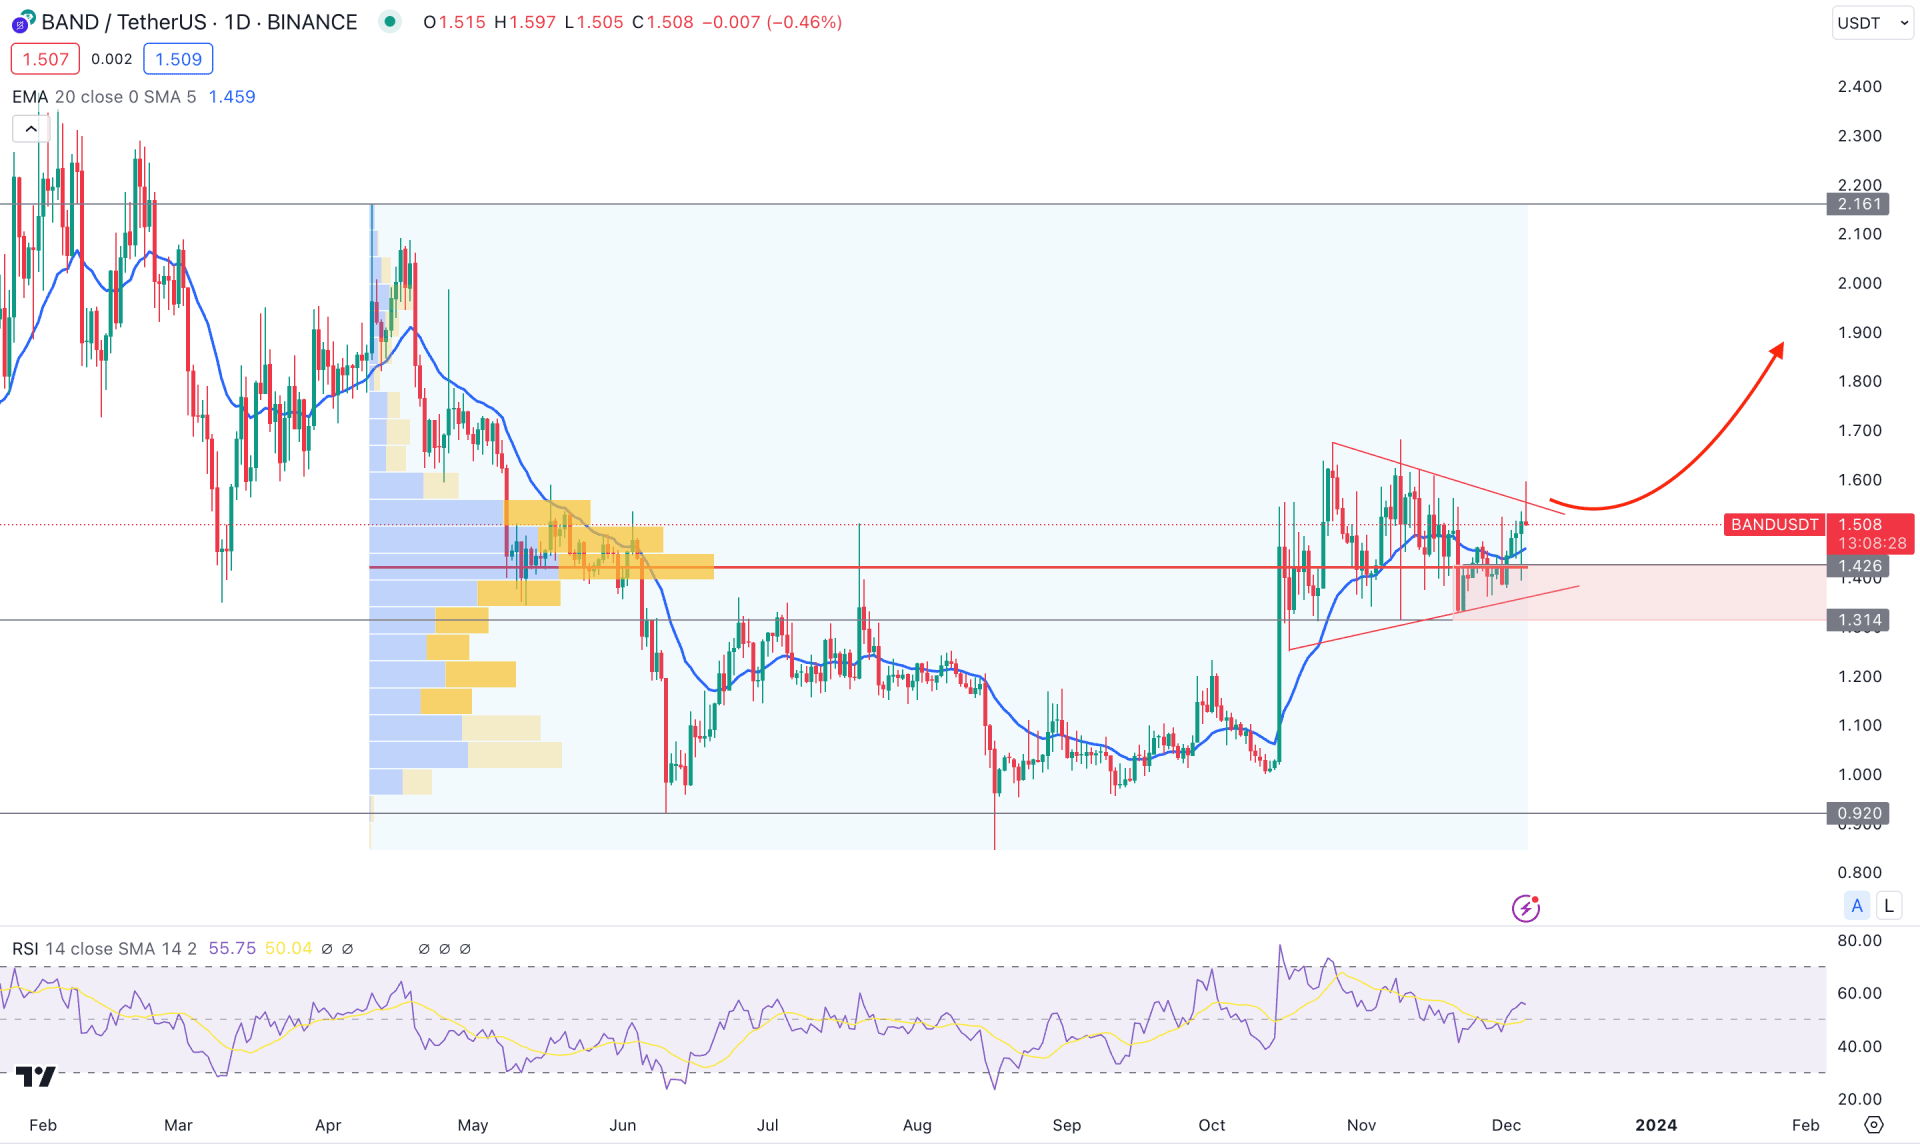
In the BAND/USDT daily chart, the last price found a bottom from where a bullish re-accumulation is visible. As a result, an additional bullish continuation is possible from the range breakout, which could appear as an impulsive trend.
In the higher timeframe, the weekly chart suggests a discounted price as it remains within a long-term zone. Moreover, the November close came as a minor downside correction, followed by October’s 26.74% gain. Based on this, we may consider the long-term outlook as bullish, where bears showed less interest than bulls.
Coming to the daily chart, a bullish pennant pattern is visible after an impulsive bullish candle on 15 October 2023. It is a sign that bulls still hold the position after the gain, anticipating further upward pressure in the coming days. The dynamic 20-day EMA supports the possibility of an upside as it stalls below the recent price.
An ongoing bullish possibility is visible from the secondary window, where the current 14-day RSI remains steady above the neutral 50.00 line. In that case, an upward continuation is pending in the RSI, where the 70.00 level could come as a bullish continuation in the main price.
The volume remains supportive to bulls, as the most active level since April 2023 is at 1.420 level, which is within the near-term consolidation. Based on the daily outlook of BAND/USDT, a bullish signal might come after revisiting the 1.426 to 1.314 demand zone. A strong bullish reversal from this area could increase the price towards the 2.000 psychological level.
The alternative approach is to wait for the price below the 1.314 demand zone and hold the daily candle. In that case, further downside pressure might come, where the next support level would be the 1.000.
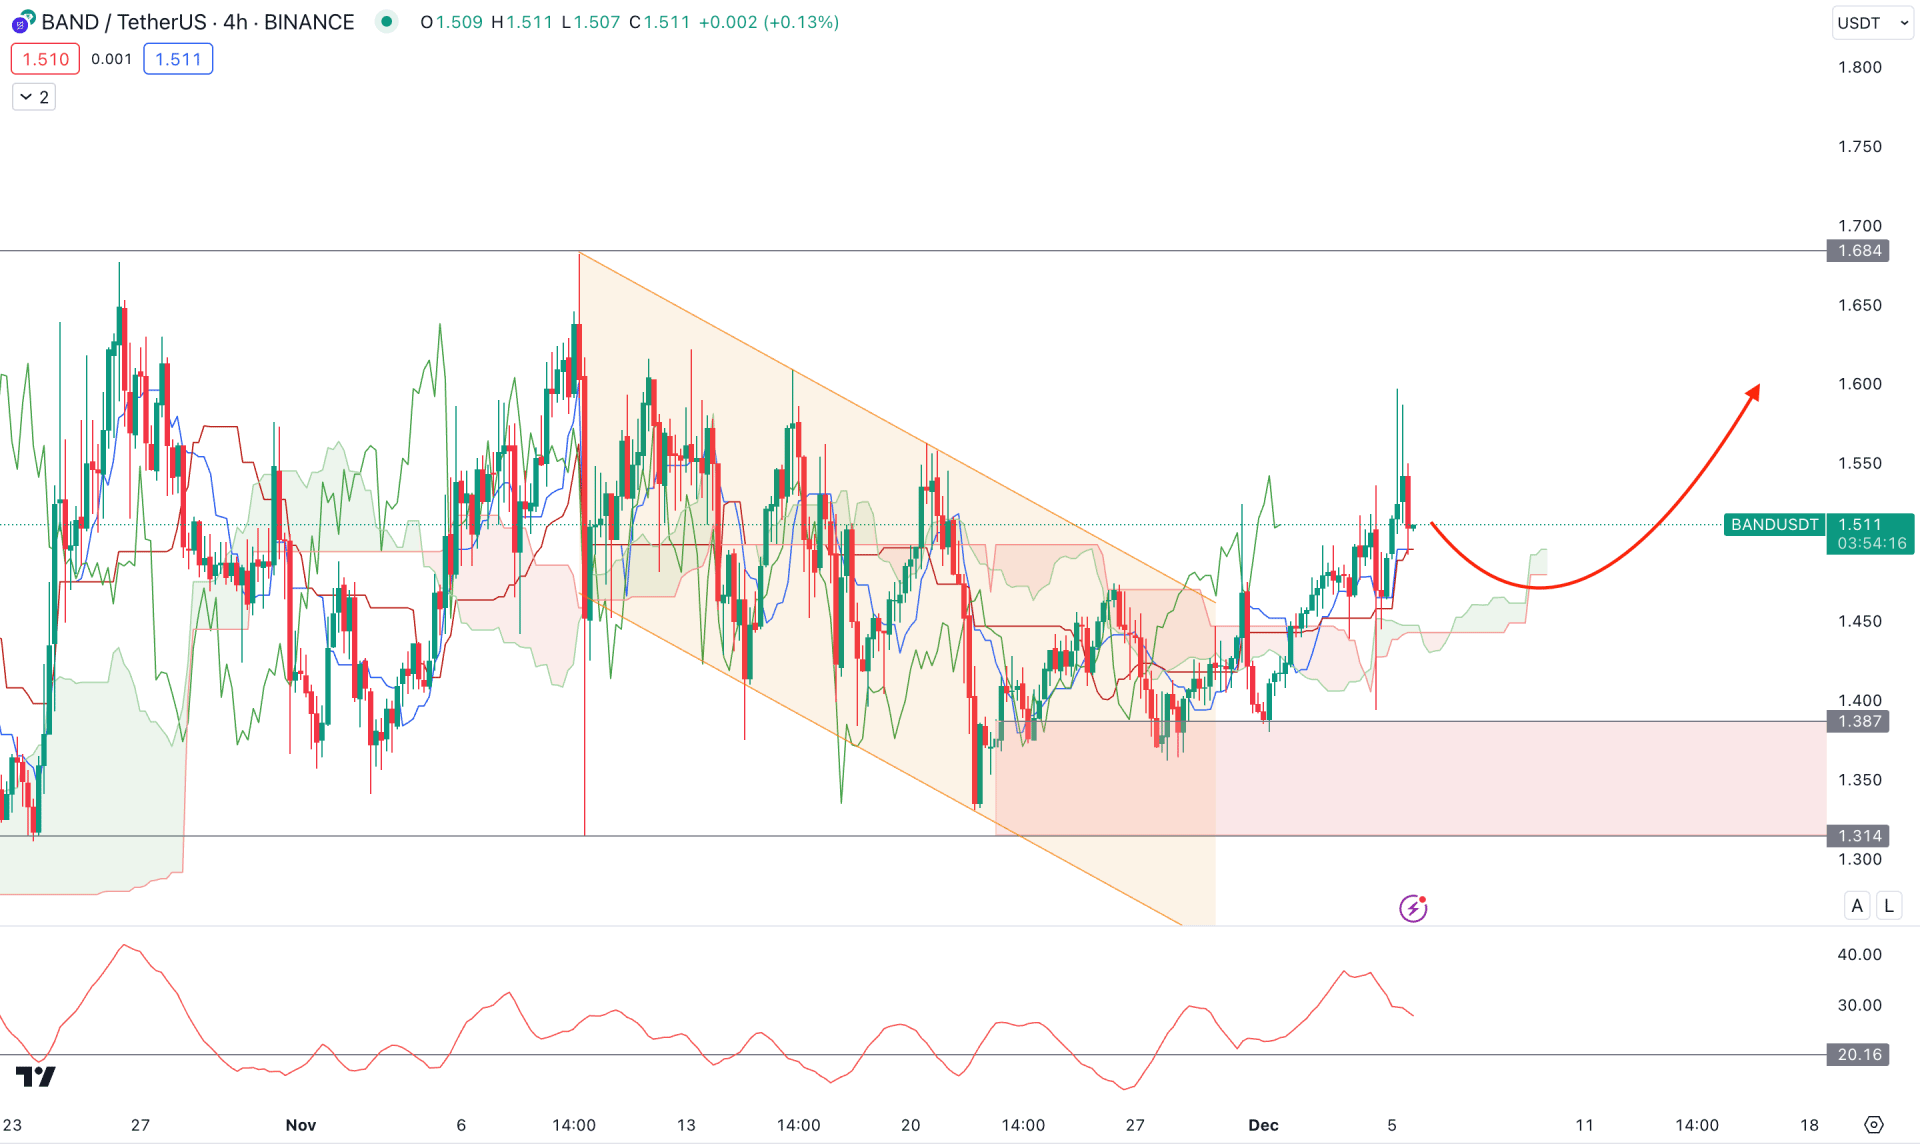
In the H4 timeframe, the broader market direction is corrective, where an ongoing consolidation is visible above the dynamic Ichimoku Cloud area. Moreover, the future cloud suggests an upward pressure as both lines are within a bullish slope.
In the secondary window, the current Average Directional Index (ADX) shows buying pressure as it remains above the 20.00 line. However, a downward slope is visible from the 36.71 level, which might work as a bearish factor for the main price.
Based on the H4 chart, the overall market momentum is bullish as long as the price remains above the cloud support. However, a deeper correction towards the 1.378 to 1.314 area with a bullish reversal could be a long opportunity, targeting the 1.700 resistance level.
On the bearish side, strong downside pressure is needed below the 1.300 level, which could be a short opportunity that may lower the price toward the 1.000 level.
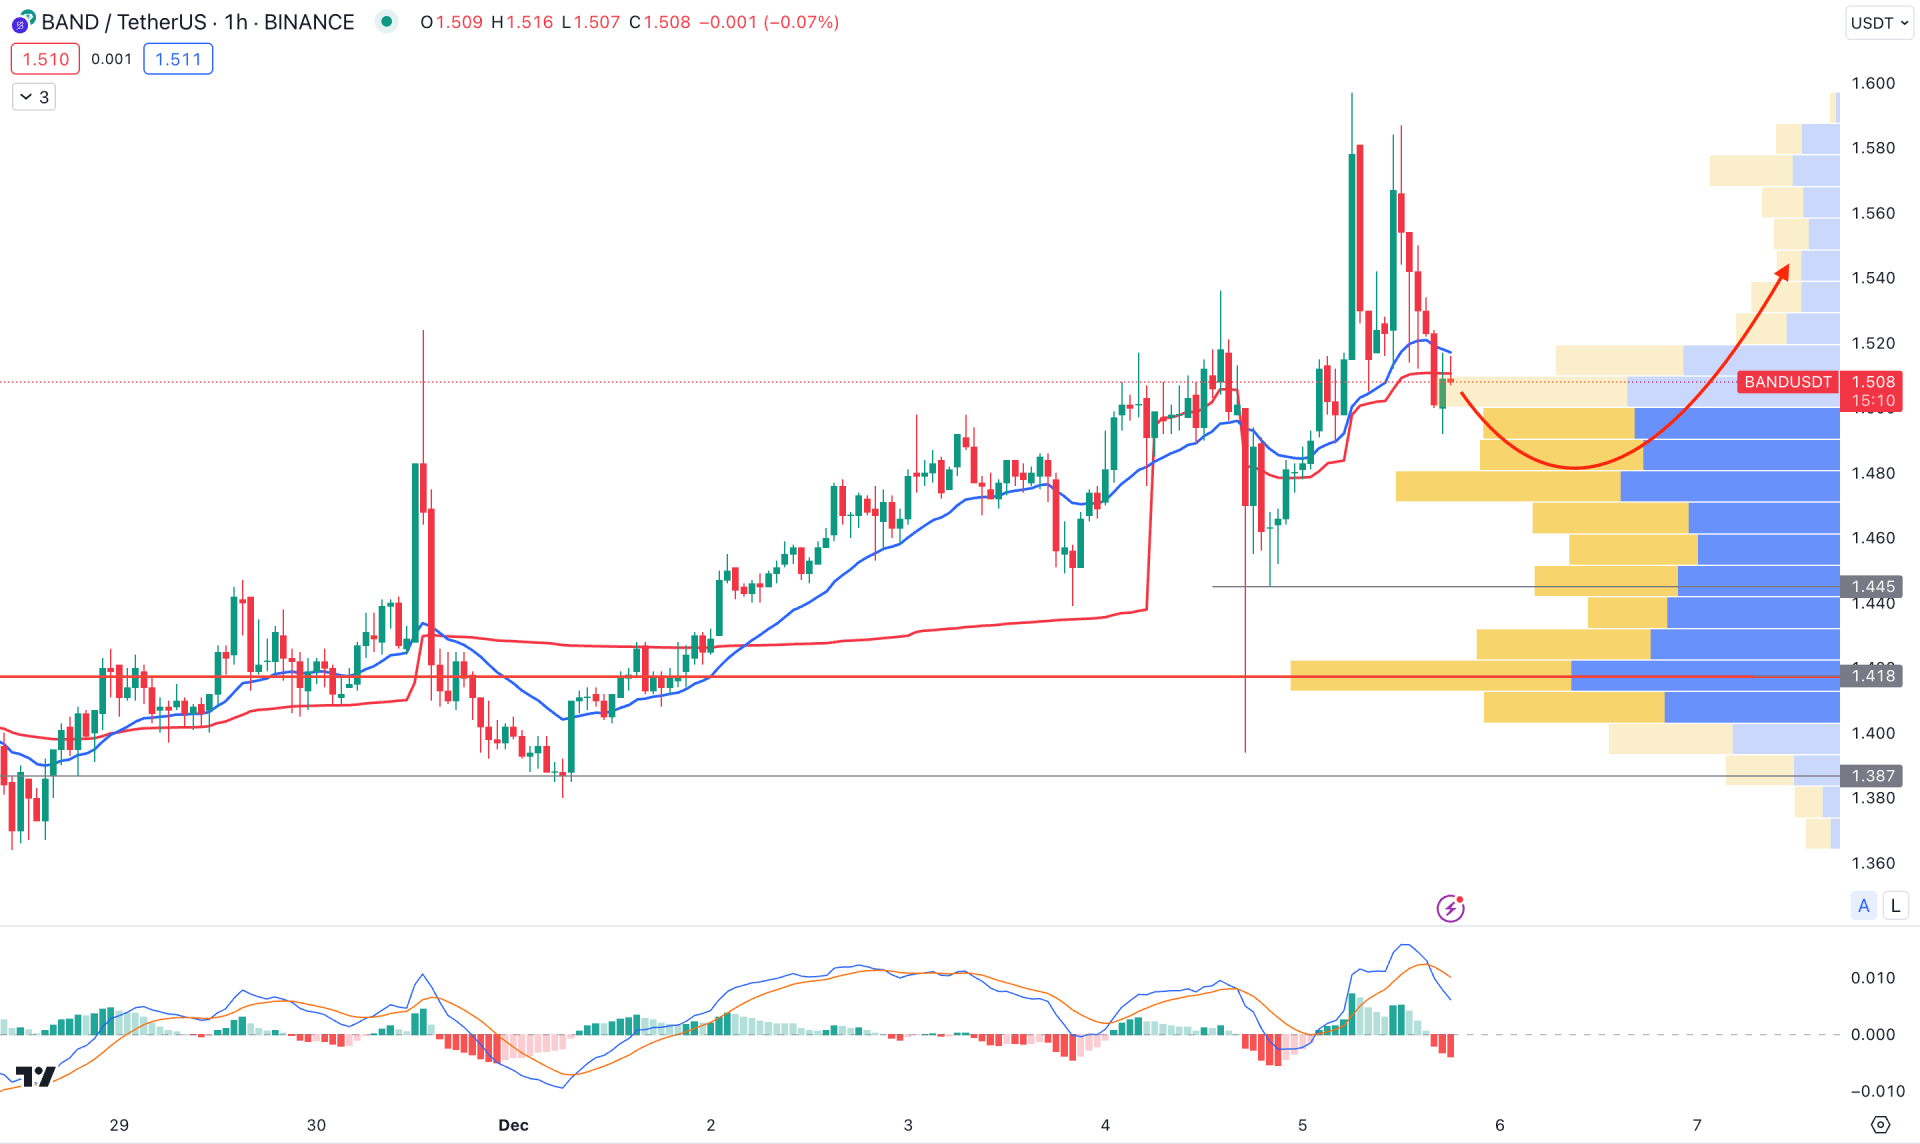
In the hourly chart, a bullish continuation is visible as the current price trades above the visible range high volume level. Moreover, the dynamic 20 EMA is acting as an immediate support level, which is above the 1.445 static level.
Moreover, the dynamic line in the MACD Histogram shows a bearish possibility as a downside crossover is seen at the top, which indicates a bearish signal.
Based on this outlook, any bullish rejection from the 1.500 to 1.418 area with an H1 close above the 20 EMA could be a long opportunity. However, a bearish H1 candle below the 1.400 level could eliminate the long opportunity for this pair.
Based on the current market outlook, BAND price could offer a bullish continuation after forming a bullish pennant breakout. Moreover, an early buying opportunity might come if the hourly chart shows a massive reversal from the near-term demand zone.


