
Published: May 16th, 2023
Baidu's (BIDU) share price increased by 6.28 percent on Tuesday after earnings and revenue surpassed expectations.
The company's first-quarter growth was primarily attributable to a rebound in advertising revenue, despite its heavy emphasis on artificial intelligence investment. Due to the Covid lockdowns in China, Baidu's search business declined, but the company's online marketing revenue returned to growth, increasing by 6% to $2.42 billion.
Non-online marketing revenue increased by 11% to $928 million, including cloud and AI enterprises. Before the report's release, J.P. Morgan analysts had predicted 2% advertising growth and 8% cloud growth.
Baidu's American Depository Receipts (ADRs) have increased by 12% this year. It came due to the excitement surrounding the launch of its ERNIE Bot generative artificial intelligence product. Baidu competes with Alibaba (BABA) and Tencent (TCEHY) to become China's dominant artificial intelligence company.
According to a recent research note by some prominent analysts, Baidu's efforts in generative AI should benefit the company in the long run. At the same time, investments in advanced semiconductors are likely to have a negative influence on the company. Baidu currently employs its own Kunlun AI chips, which it claims will help mitigate the effects of U.S. export restrictions on advanced semiconductor technology in China.
Let’s see the upcoming price direction of this stock from Baidu (BIDU) technical analysis:
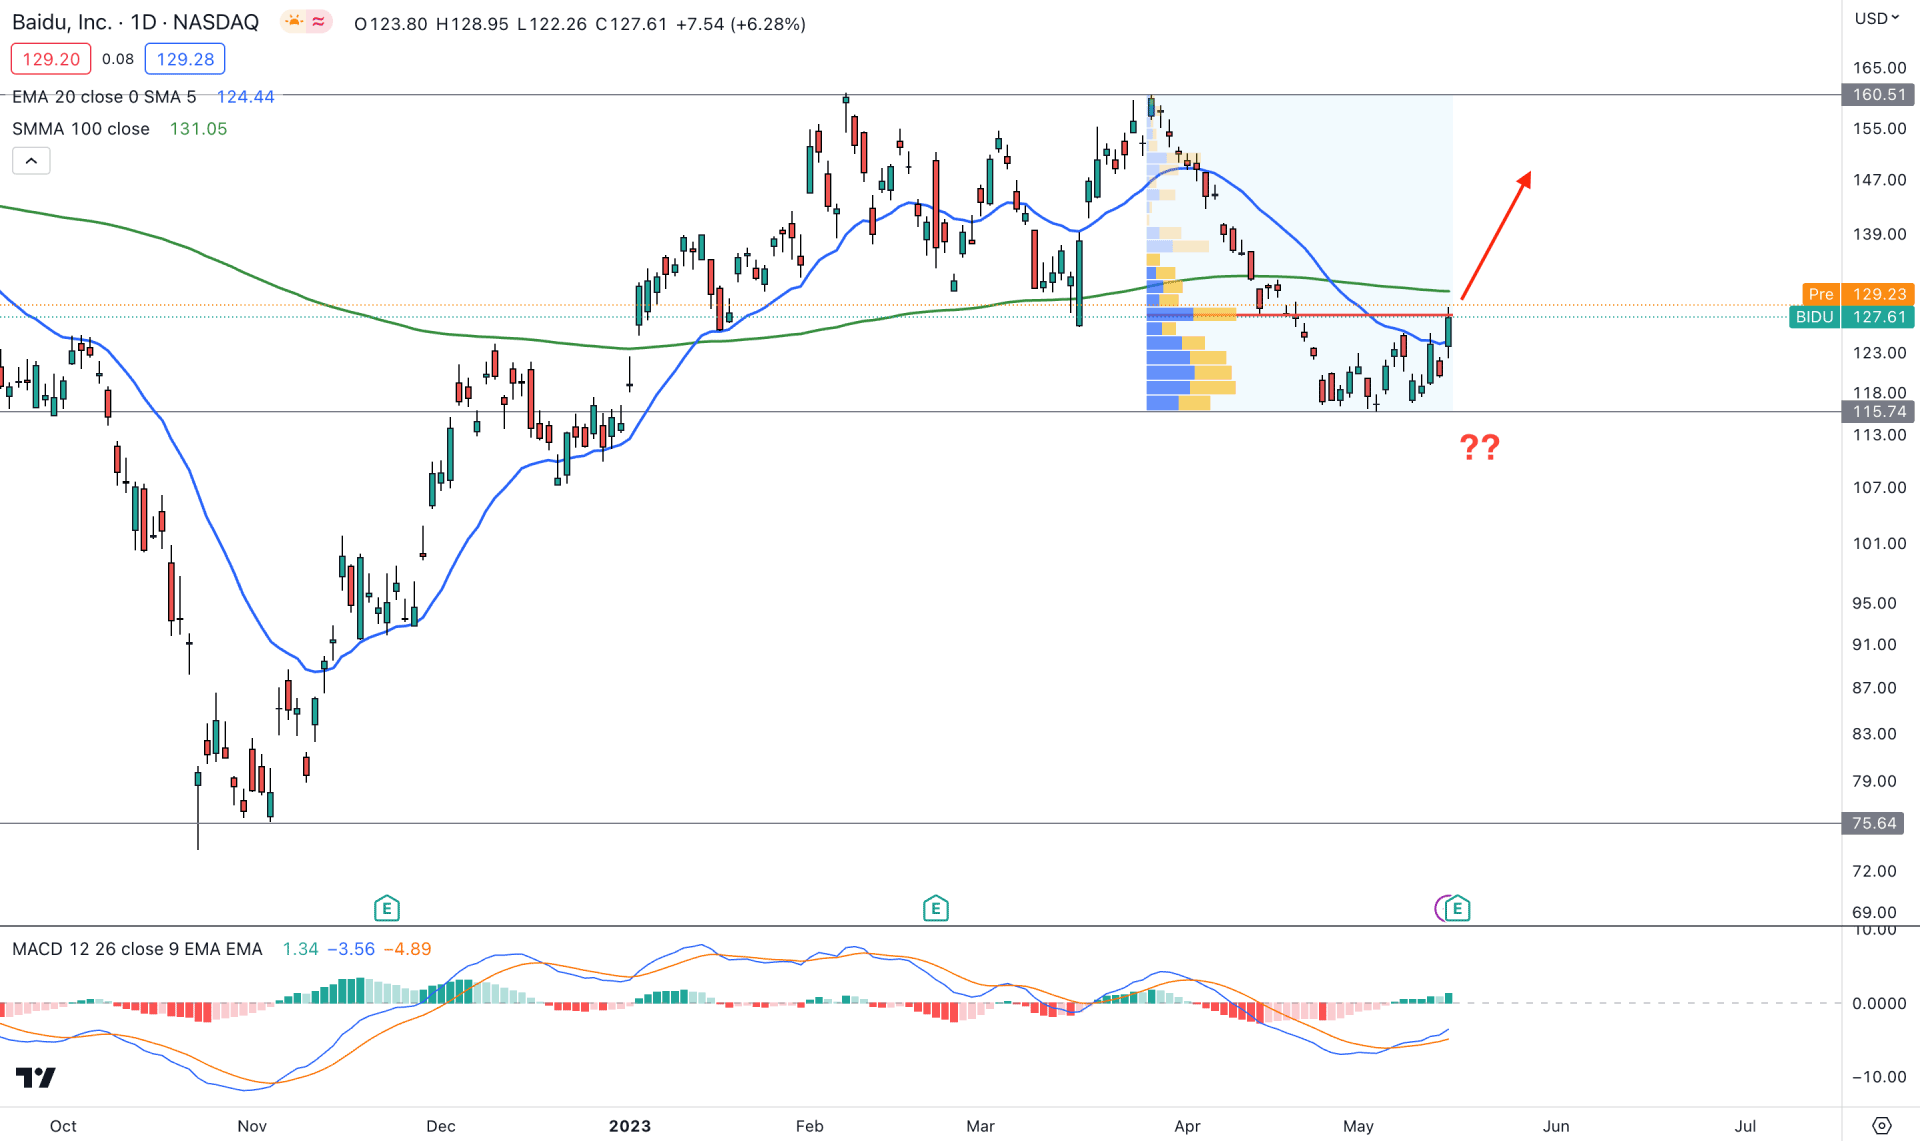
In the daily price of BIDU, the broader market outlook is strongly bullish initiated from the liquidity sweep at the 75.64 level.
The price formed an immediate bullish counter-trend momentum, which found a ceiling at the 160.50 resistance level. As the most recent price showed downside pressure from the 160.50 level, many traders anticipated a bearish momentum in this instrument.
The price went sideways after a 27.98% discount from the 160.50 to 115.60 level. Now, it is time to see how the price breaks out from the range, where the dynamic 100-day SMA is the immediate barrier to bulls. However, the recent daily candle above the 20 DMA, with an upbeat quarterly earnings report, might work as an early bullish sign, but it is not valid until the 100 SMA is taken over.
Regarding traders' activity, the highest trading volume level since 5 April 2023 is closer to the price at the 127.96 level. It signifies a perfect battle between bulls and bears where a strong upside pressure would indicate buyers' presence.
A bullish pre-breakout signal is provided by the MACD indicator, where a bullish crossover is formed among EMA lines with a strong upside possibility.
Based on the daily price structure, the conservative buying approach is to wait for a D1 candle to form above the 100 SMA before aiming for the 165.00 and 170.00 area.
Conversely, a strong bearish pressure with a daily candle below the 115.74 support level could increase the possibility of testing the 93.00 support level.
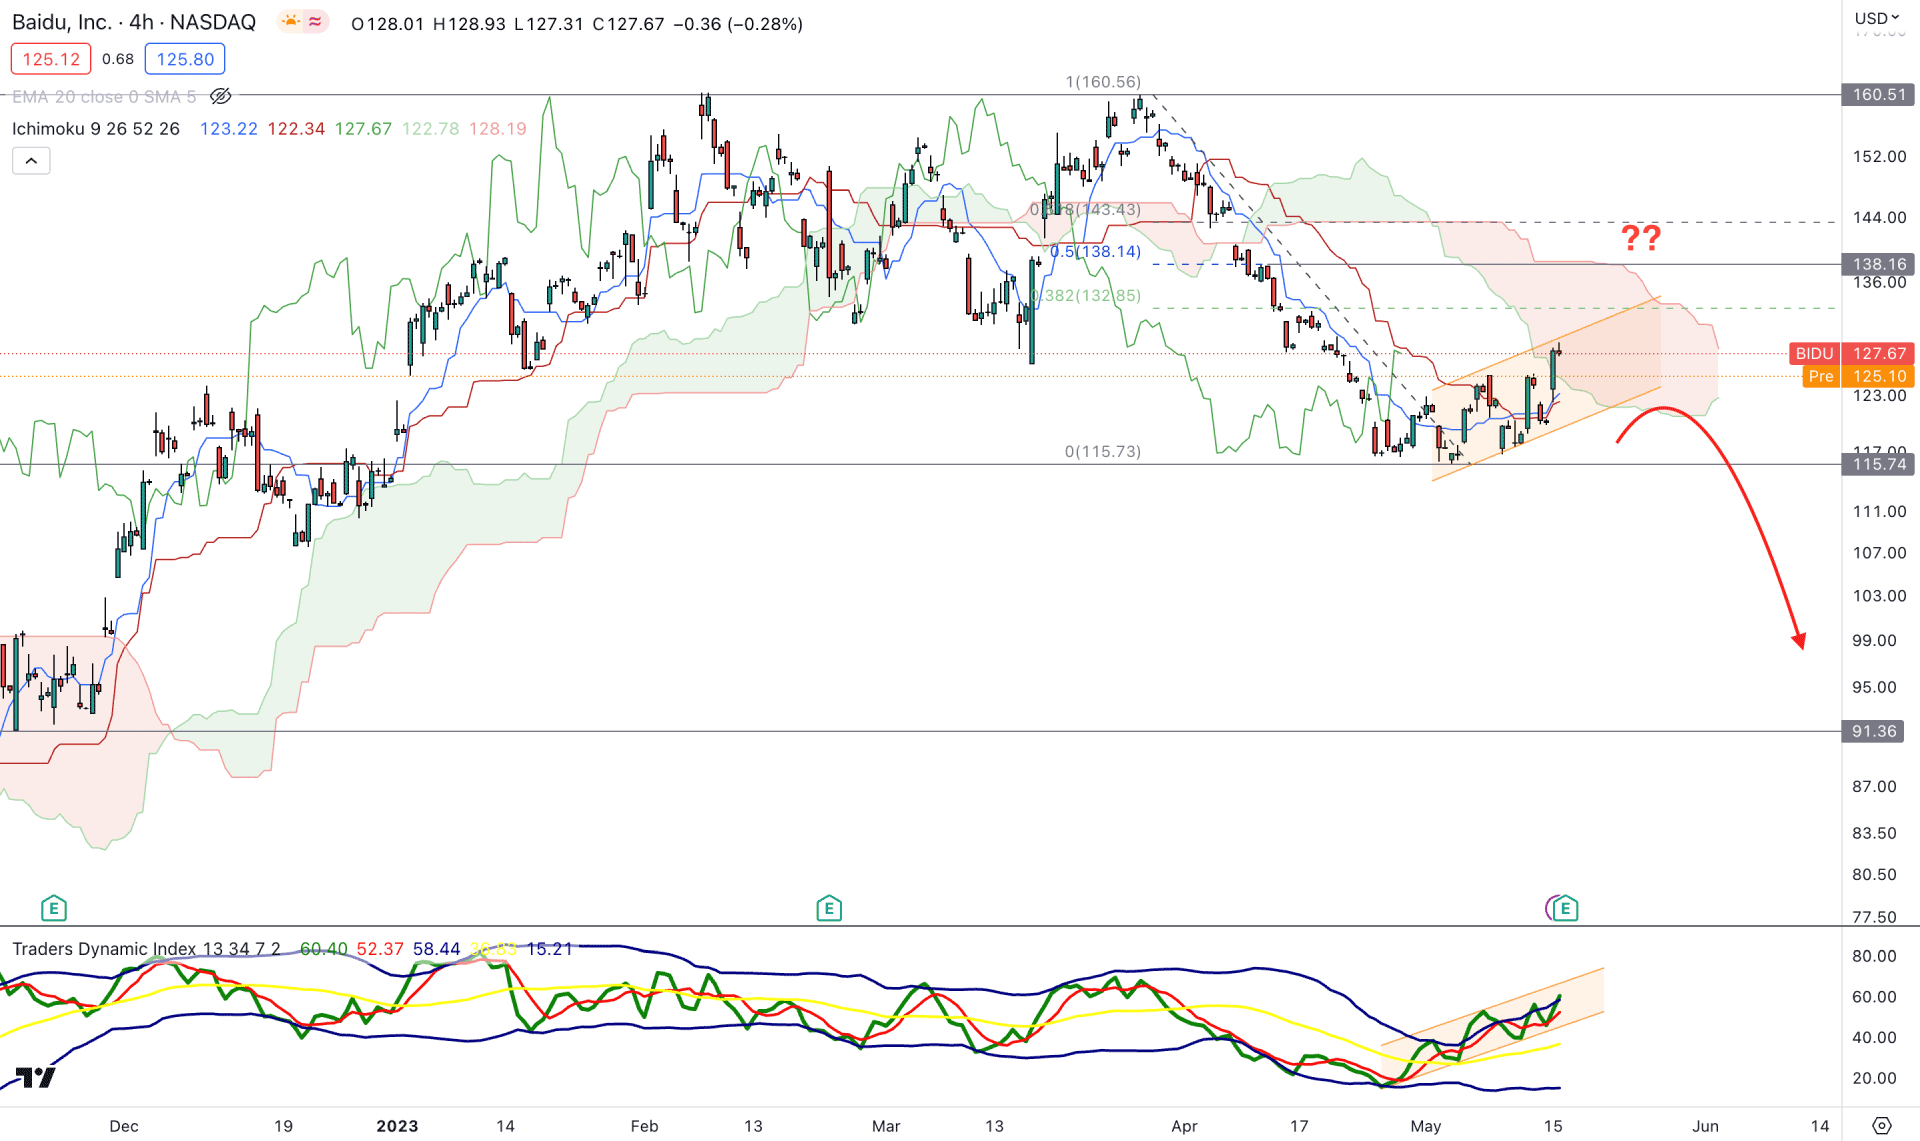
In the intraday chart, BIDU showed a corrective structure where an ascending channel formation is ON, and a proper price action might come after validating the breakout from the pattern.
A strong sell-side pressure from the 160.50 level, an H4 candle below the Ichimoku Kumo Cloud, and ascending channel breakout could be a perfect combination for a sell trade. However, the thickness of the future cloud is not supportive of going short, as investors should monitor how the price reacts to the 115.74 level.
In the indicator window, the current Traders Dynamic Index (TDI) shows a bullish range formation, where the current TDI level reached the overbought area. In that case, a solid bearish pressure may come if the TDI level comes below the 50.00 level.
Based on the current H4 outlook, the current market momentum is bearish, where a bearish H4 candle below the 115.00 level could lower the price toward the 91.36 level.
On the other hand, a bullish recovery with an H4 candle above the 50% Fibonacci level from 115.75 to 160.50 level, could resume the existing trend towards the 170.00 area.
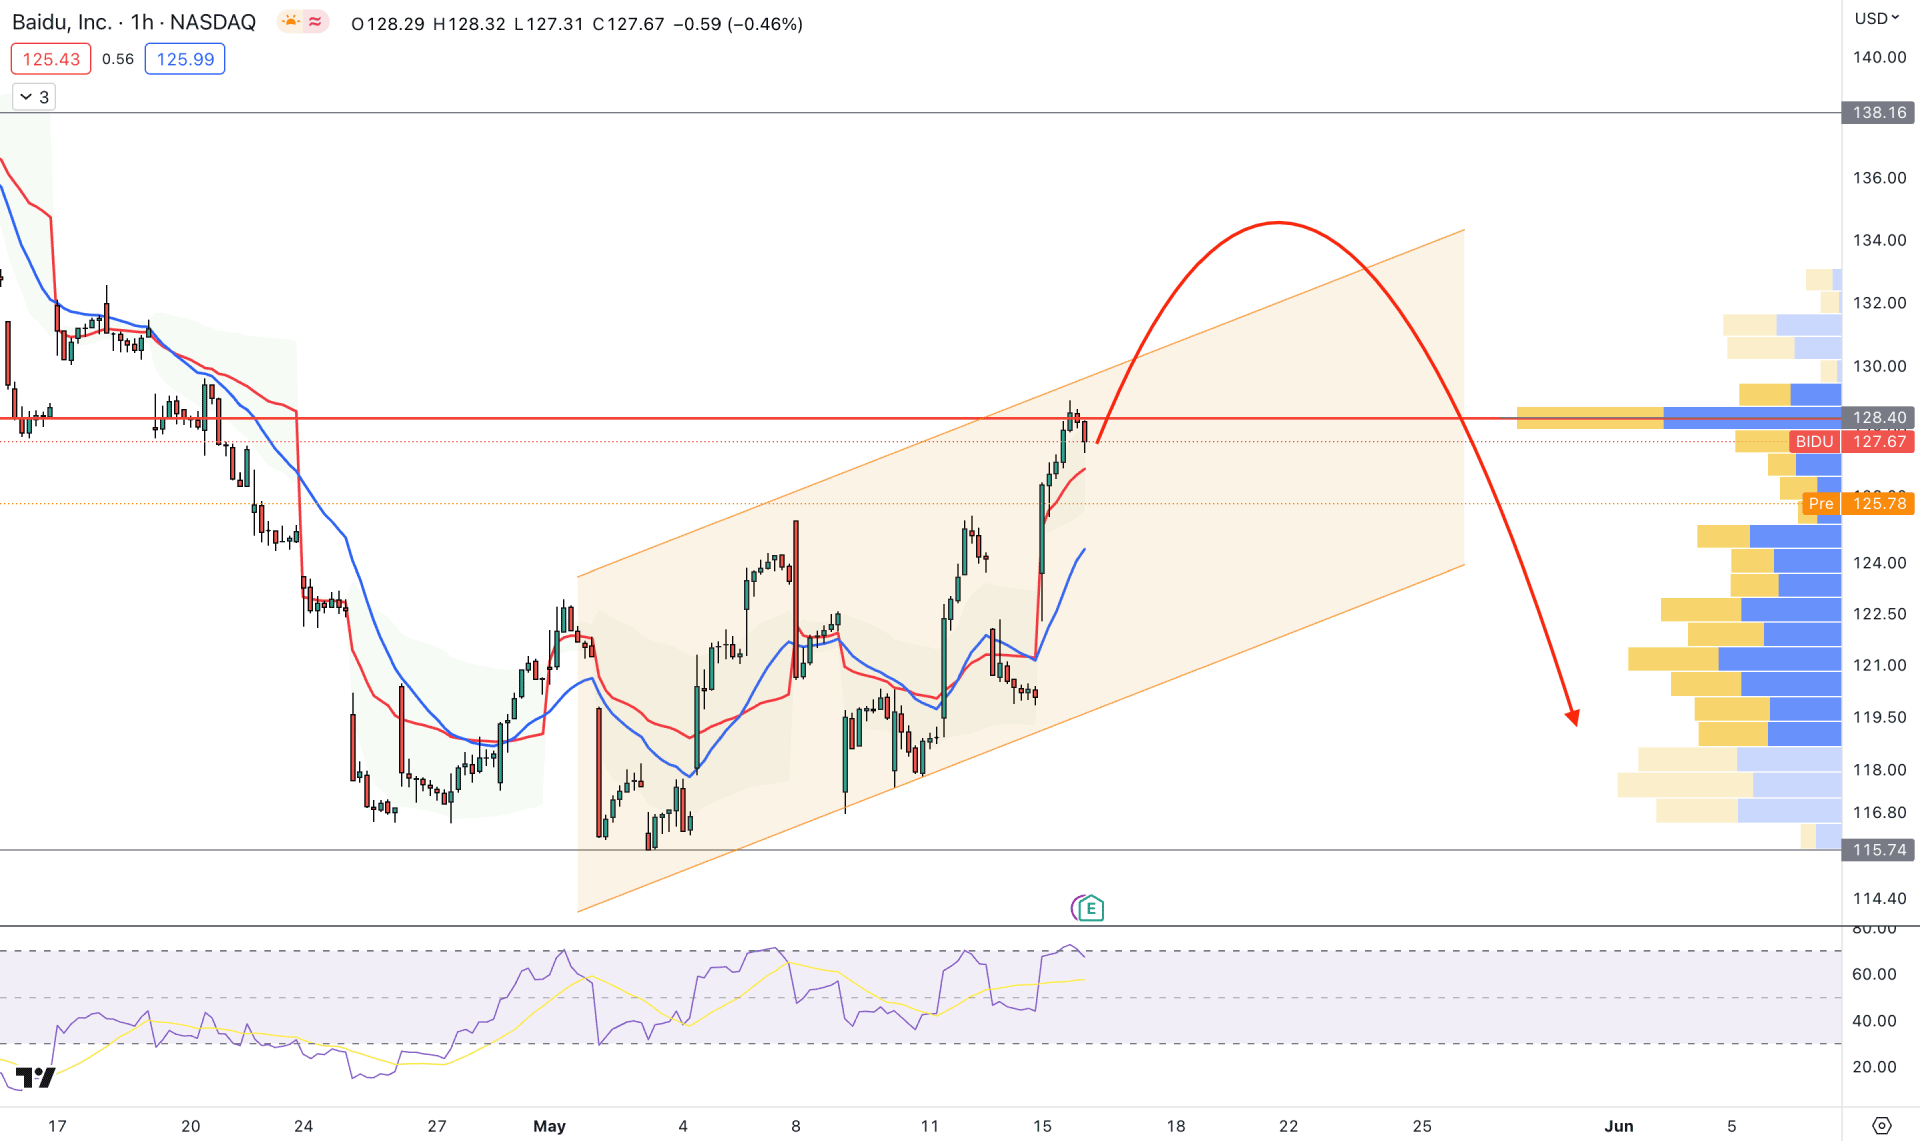
In the hourly chart, the current price trades at the channel resistance, while the visible range high volume level is above it.
The dynamic 20 EMA and VWAP are below the current price, working as a dynamic support, which needs to breach before offering a bearish opportunity. The indicator window also shows a strong position at the overbought zone from where downside pressure may come.
Based on the H1 outlook, the downside possibility is valid as long as the price trades below the 138.00 level. However, a bullish pressure above the high volume level of 128.90 level could increase the bullish possibility, where the main aim is to test the 150.00 level.
Based on the current technical outlook of BIDU, the overall structure is still bullish, where a push from institutional buyers with an H1 candle above the 100-day SMA could offer a long opportunity. The structure is still bearish in the intraday chart, where sufficient evidence is needed before opening an early buying opportunity.


