
Published: July 4th, 2023
In recent months, Avalanche (AVAX) has experienced significant growth in its user base, activity, transaction volume, and future prospects.
These factors have contributed to the Avalanche token's optimistic outlook. Despite these accomplishments, AVAX investors are now gravitating towards a new meme coin due to the possibility of a 100x return in a short period of time.
Avalanche (AVAX) is not a typical token, so it is somewhat perplexing why its holders are transferring their attention to Anarchy. AVAX is on par with Ethereum in terms of strength as a cryptocurrency. Avalanche, like Ethereum, uses smart contracts to support numerous blockchain projects. However, what truly distinguishes it is its near-instant transaction completion. Essentially, this implies that Avalanche blockchain transactions receive rapid confirmations.
This essential feature has been instrumental in Avalanche's recent increase in addresses and user activity. Even the NFT community on Avalanche has grown substantially, which is fantastic news for NFT enthusiasts and devoted Avalanche supporters.
Let’s see the future price direction of Avalanche (AVAX) from the AAVE/USDT technical analysis:
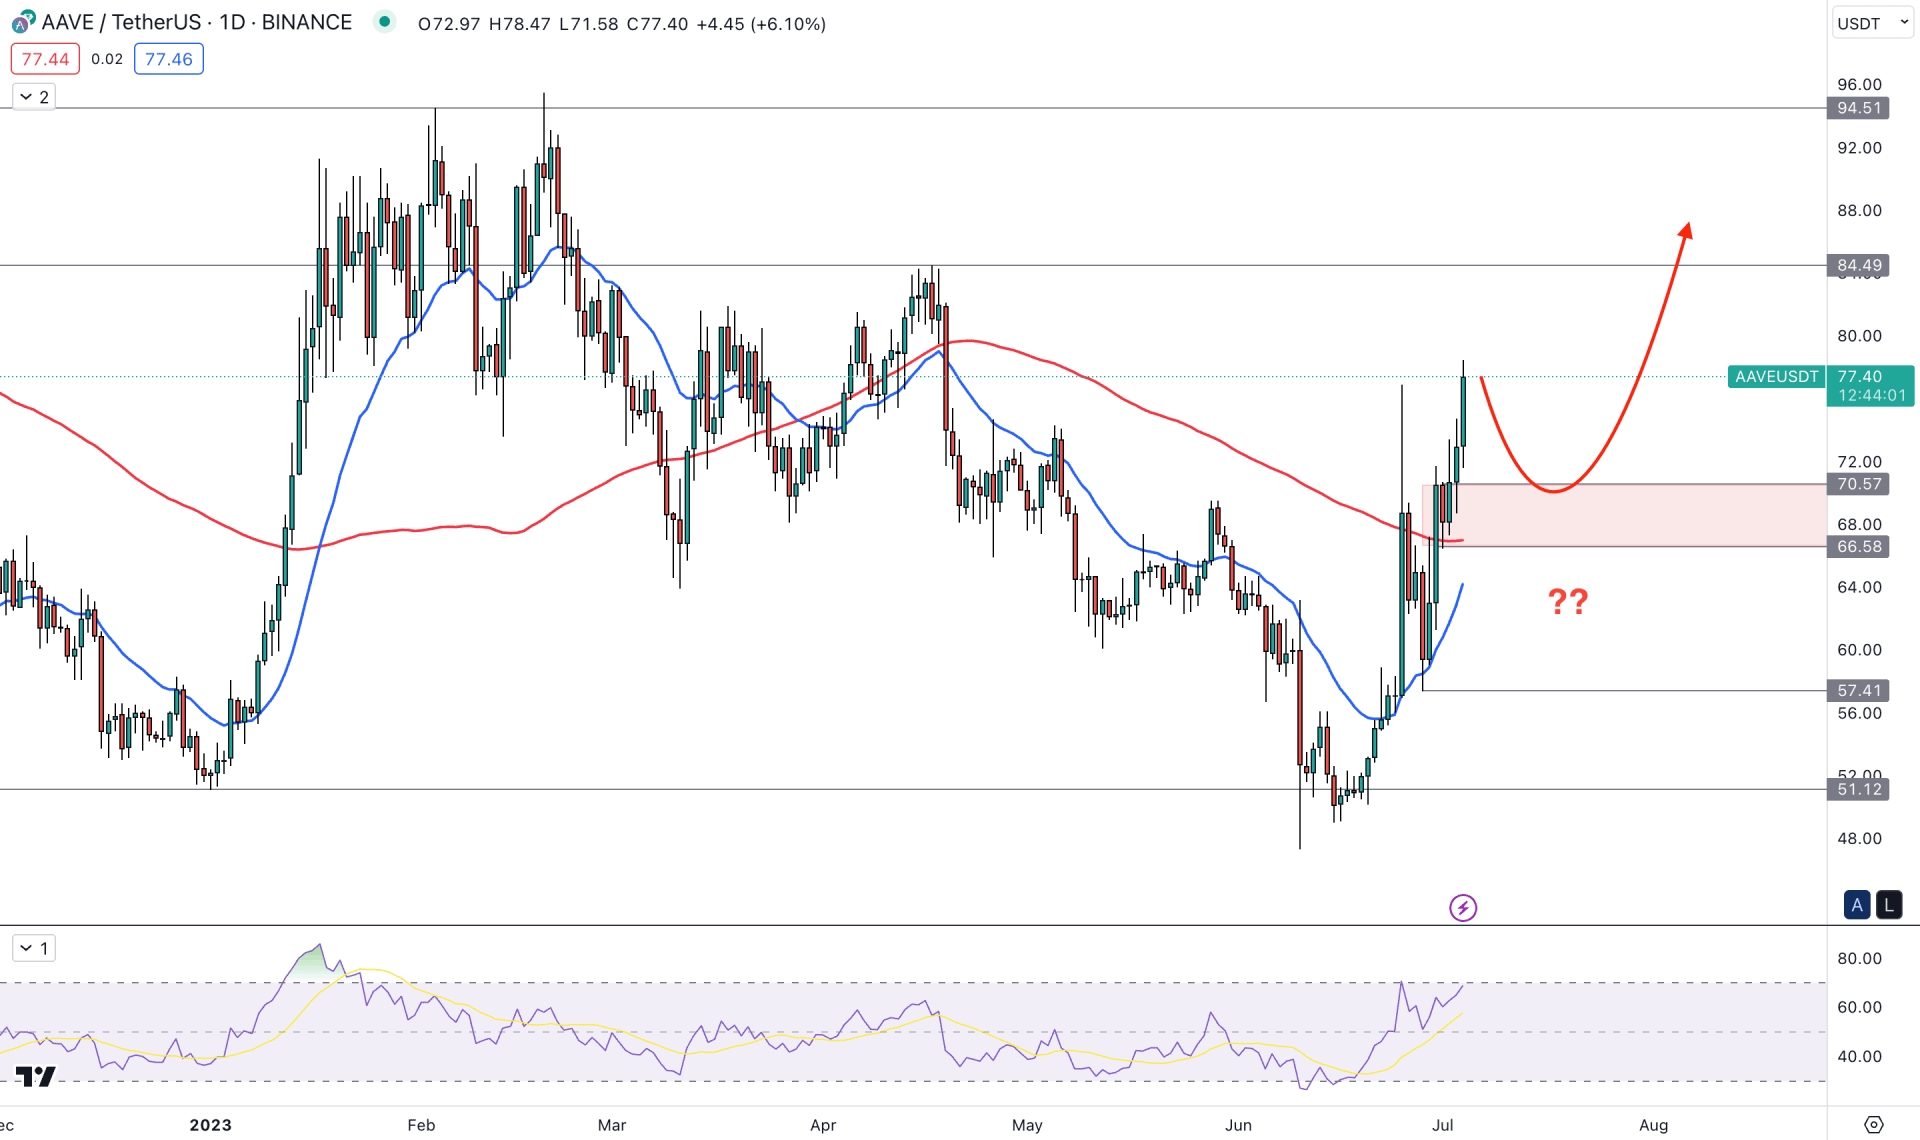
The broader market direction is bullish in the daily chart of AAVE/USDT, as the recent upward pressure came from a bearish exhaustion and an immediate bullish recovery.
In June 2023, a hammer candlestick pattern formed in the monthly chart, suggesting that the price might have found the bottom. The ideal approach to trading hammer candles is to wait for a bullish breakout above the candle opening and seek long opportunities.
The buying pressure is also justified by the weekly price action, where a strong bullish body is present with an inside bar formation.
The most recent price formed a strong buying momentum in the daily price by breaking above the 100-day Simple Moving Average line, suggesting that long-term traders have become bullish on this instrument. Also, the dynamic 20-day EMA is below the price and working as immediate support.
The price made multiple internal swing lows in the most recent swing, from 47.30 low to 78.11 high, which is a sign of strong buying pressure. In the above image, the 70.57 to 66.58 area is the latest demand zone from where the latest upward pressure has come.
In the Relative Strength Index (RSI), the latest reading showed an immediate bullish recovery without testing the 50.00 level. We may consider the market momentum bullish as the RSI reversed back to the overbought zone.
Based on the current daily outlook of AAVE/USDT, the broader market outlook is bullish and any intraday bullish setup could work well in this price action.
The ideal trading approach is to look for a minor downward pressure with a valid bullish reversal, where the ultimate aim is to test the 94.50 key resistance level.
On the other hand, the alternative approach is to seek short opportunities if a daily candle comes below the 64.00 critical level.
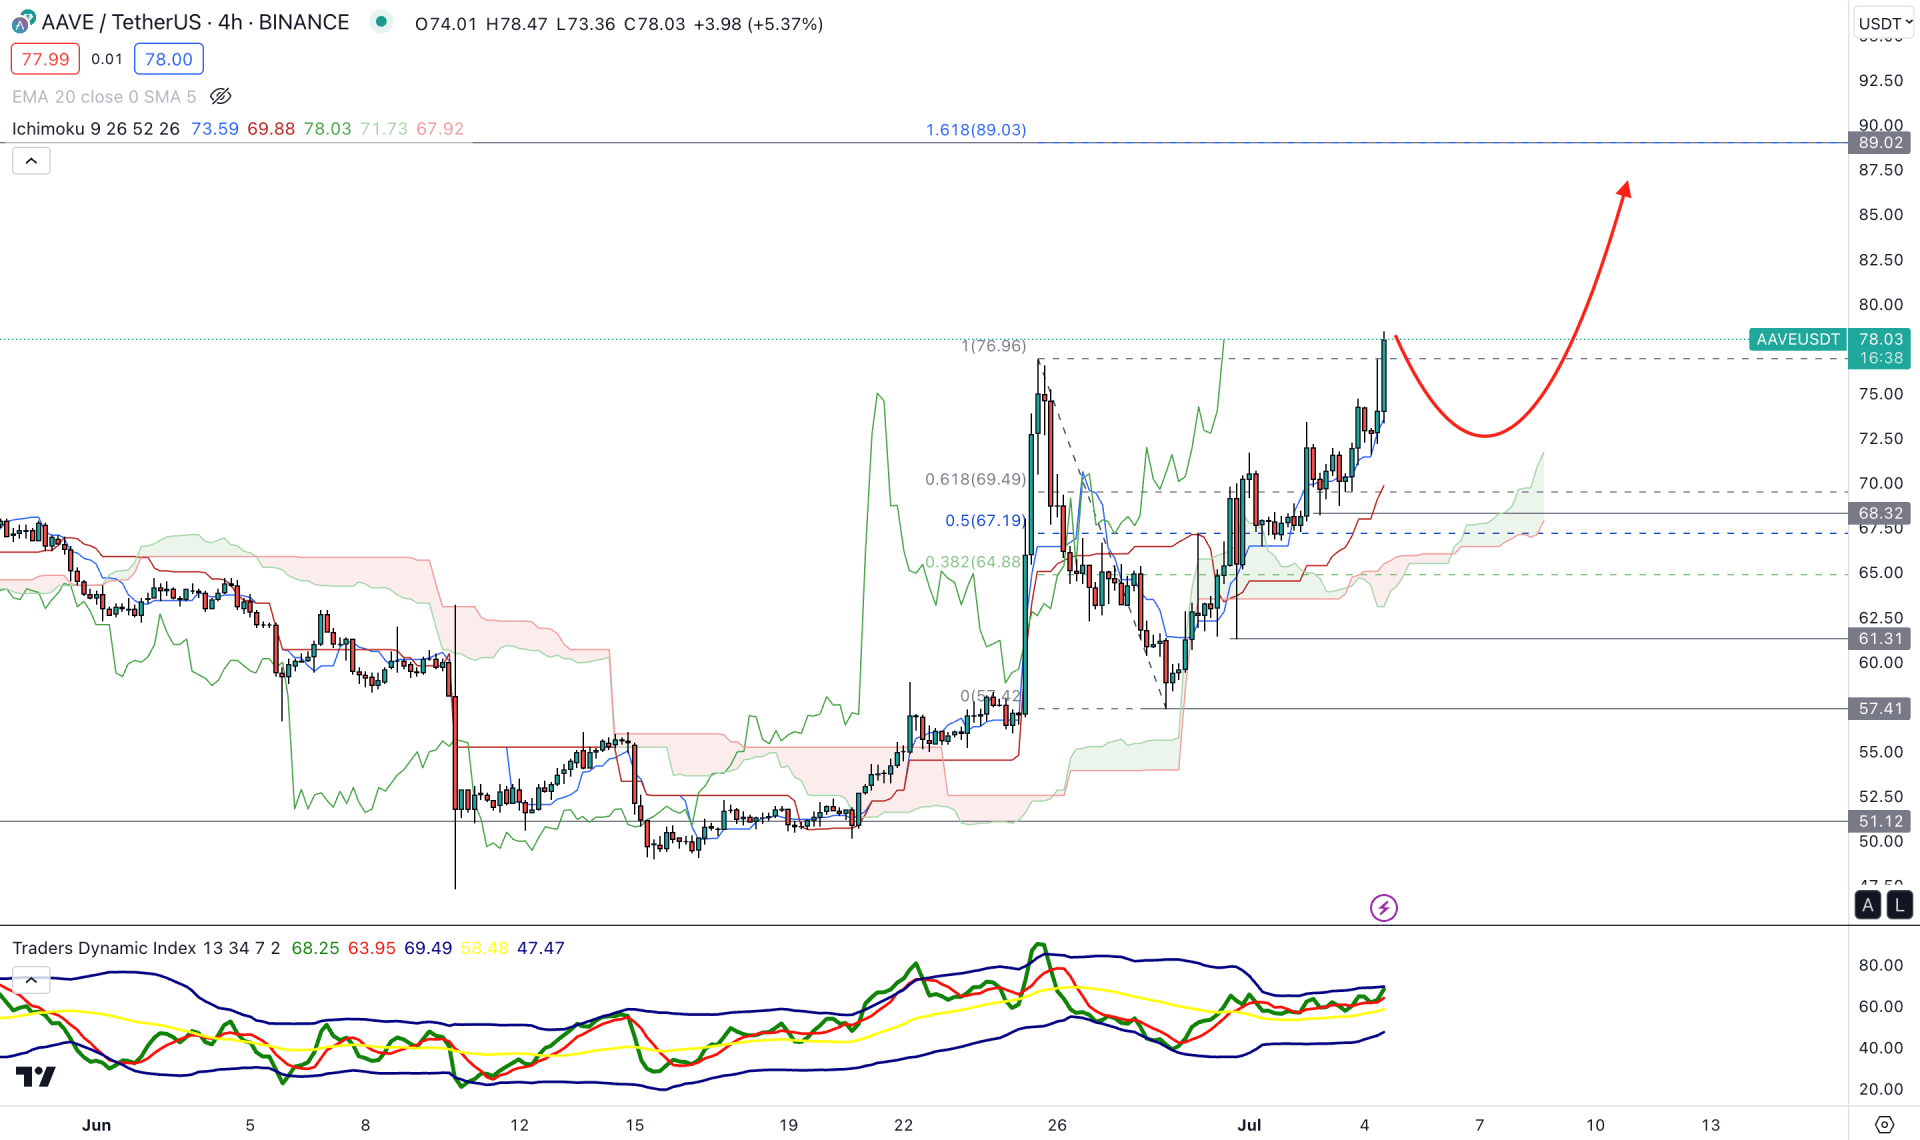
In the H4 timeframe, the Ichimoku Cloud shows a strong bullish momentum, where the current Senkou Span A is above B, while the price is trading above the cloud support.
The general trading approach using the Ichimoku Cloud is to seek long trades only as long as the price remains above the support area. However, a sufficient downside correction is needed for taking long trades, which might come after visiting near-term dynamic levels.
In the above image, the dynamic Tenkan Sen and Kijun Sen levels are below the price with upward momentum. It is a sign that short-term and medium term traders are on buyers' side and any lower price could influence them to add more positions.
Based on the H4 outlook, a valid bullish rejection from the dynamic Kijun Sen could open a long opportunity, where the main aim is to test the 89.00 level, which is the 161.8% Fibonacci Extension level from the latest swing.
On the other hand, the buying possibility might become invalid if the price comes below the 61.31 level with a bearish D1 candle. In that case, a bearish pressure may extend, where the main aim is to test the 50.00 level.
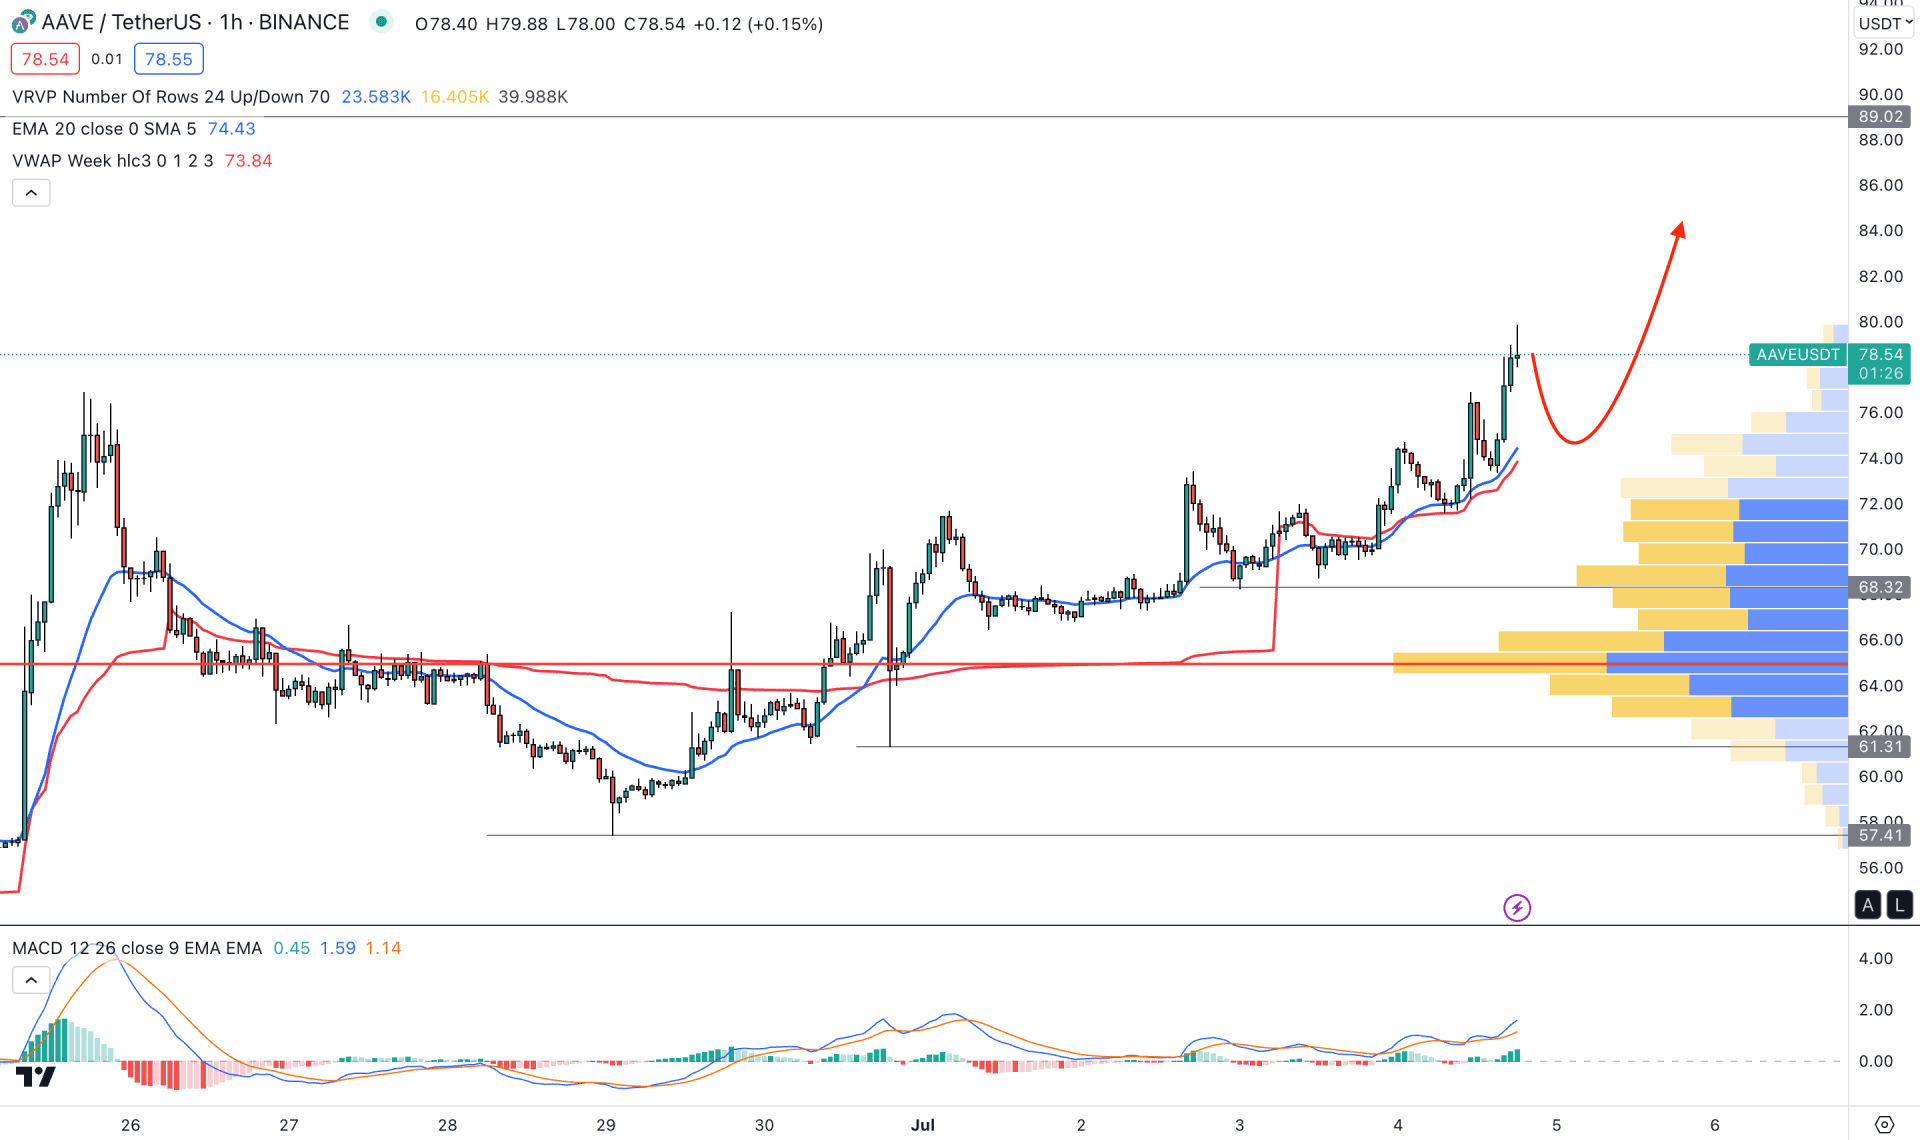
In the hourly chart, the current market outlook is bullish as the dynamic 20 EMA and VWAP strongly support bulls. Also, strong momentum is visible from the high volume level as the price formed multiple higher highs remaining above it.
The current MACD Histogram is bullish in the indicator window and forms new highs. A bullish crossover in MACD EMA’s is also visible, which suggests a bullish trend continuation opportunity,
Based on this outlook, a bearish recovery and a bullish rejection from the VWAP level could offer a strong buying possibility in this pair, targeting the 89.00 level. However, breaking below the 61.00 level might alter the current outlook at any time.
As per the above discussion, we can say that the AAVE/USDT price is moving higher with a strong bullish pressure, where any short-term bearish correction would be a long opportunity. Investors should wait for a sufficient bearish correction in the intraday chart to join the bullish rally.


