
Published: August 3rd, 2021
AUDUSD moved higher by nearly 30 pips as soon as the RBA showed an optimistic outlook about the Australian economy. The hawkish tone came with the continuation of tapering of the bond-buying program after early September. However, the current concern about the covid and stimulus is not extremely positive for AUDUSD bulls. RBA left the cash rate unchanged at 0.10 percent, a historic low as the country is fighting through the recovery of COVID-19 infections in some states.
On the other hand, the US economy is going through a mixed sentiment regarding the post-pandemic recovery. Although the fear of inflation is in play, investors should closely focus on this week’s Non-Farm payroll to get a more precise view of the US economy. Until then, a corrective momentum is expected from USD, where AUD may get a benefit.
Let’s see the upcoming price direction from the AUDUSD technical analysis:
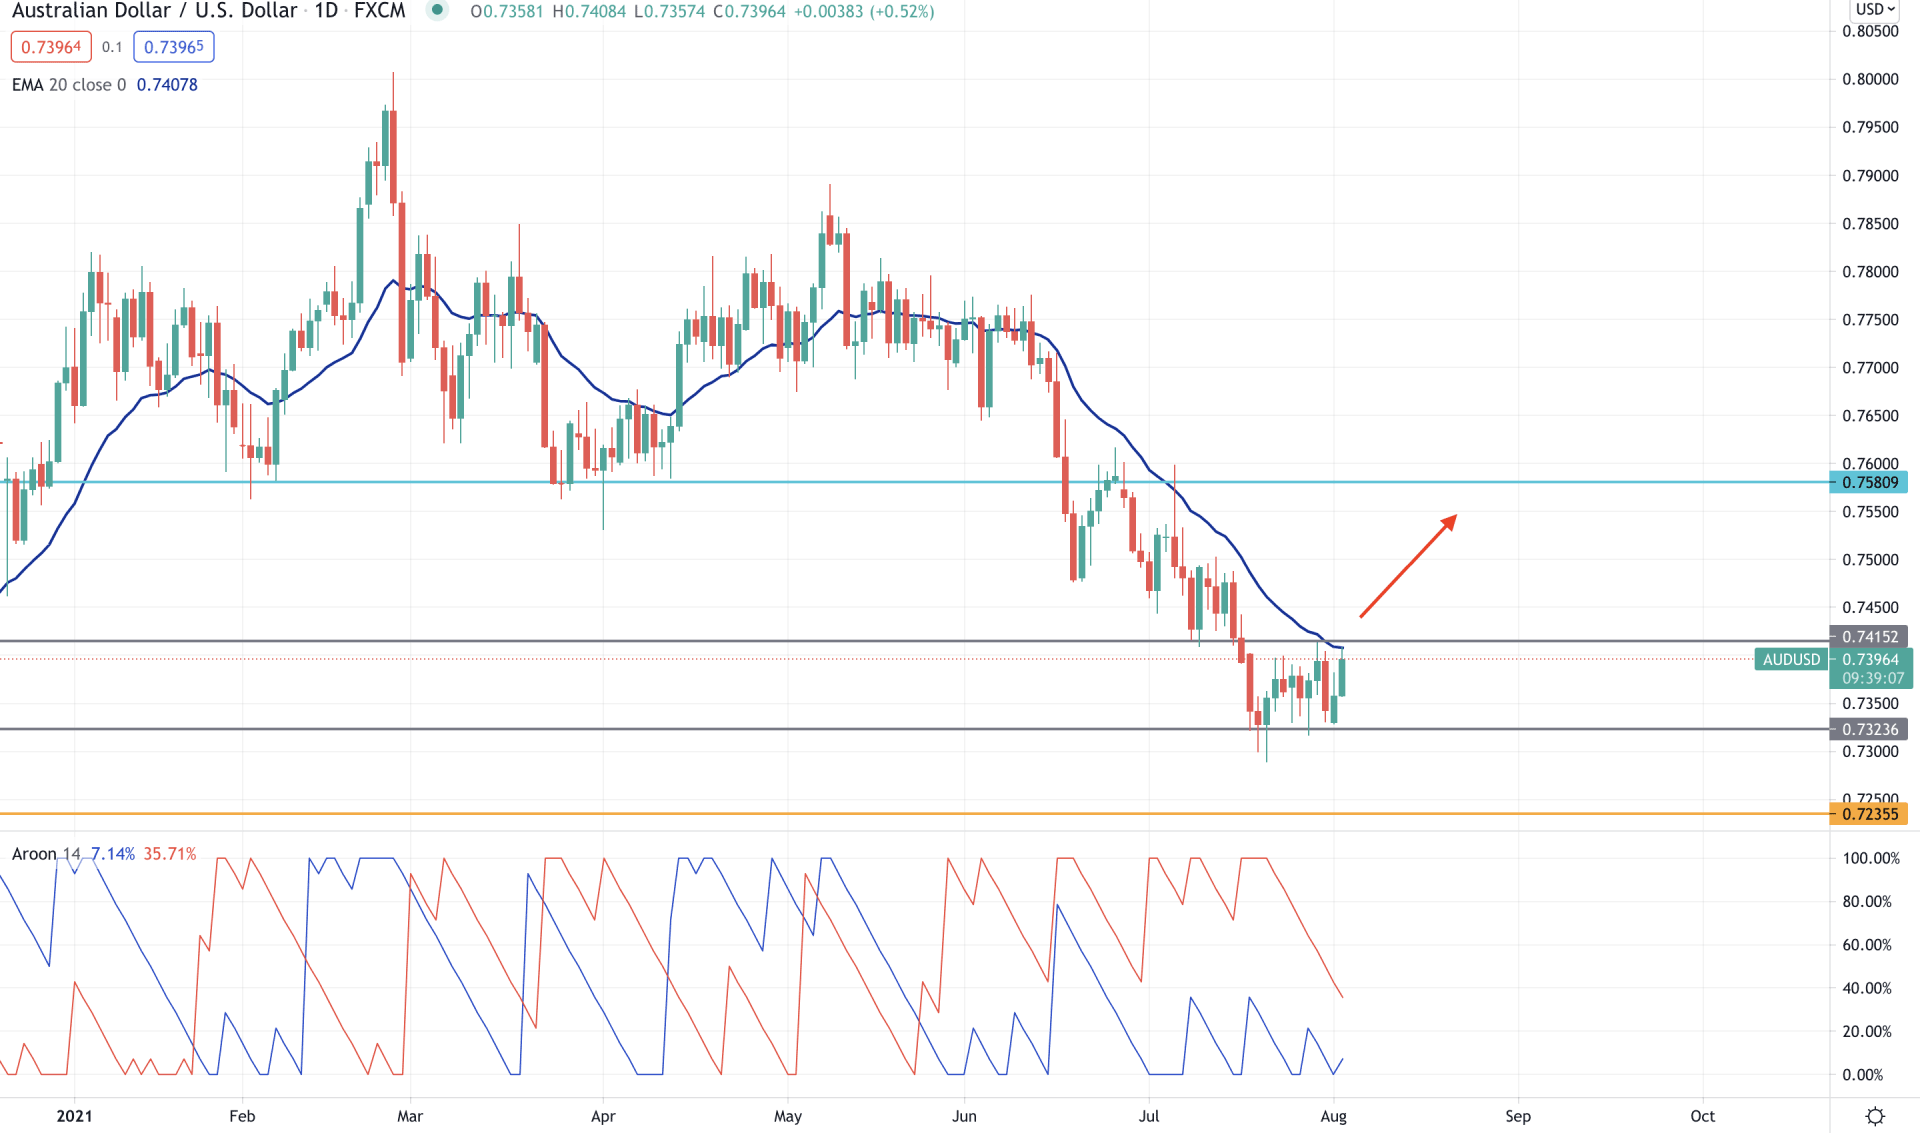
AUDUSD bears became strong as soon as the price broke below the 0.7650 key support level with an impulsive pressure that took the price towards the 0.7300 area. Later on, the price started to consolidate from mid-July until the RBA showed the hawkish tone today. However, the current price is still below the 0.7415 event level, and bulls need a solid bullish daily close above this level to increase the buying possibility.
In the indicator window, we can see that the Aroon Down (red line) is still above the Aroon Up (blue line), indicating that the market sentiment is still bearish. Therefore, besides the bullish daily close above the 0.7415 level, a crossover in Aroon Indicator with the Aroon Up at 100% is important to see.
On the other hand, the dynamic 20 EMA is below the 0.7415 area and pointing down. Therefore, any rejection from the dynamic 20 EMA with a bearish daily close may resume the selling pressure towards 0.7300 area.
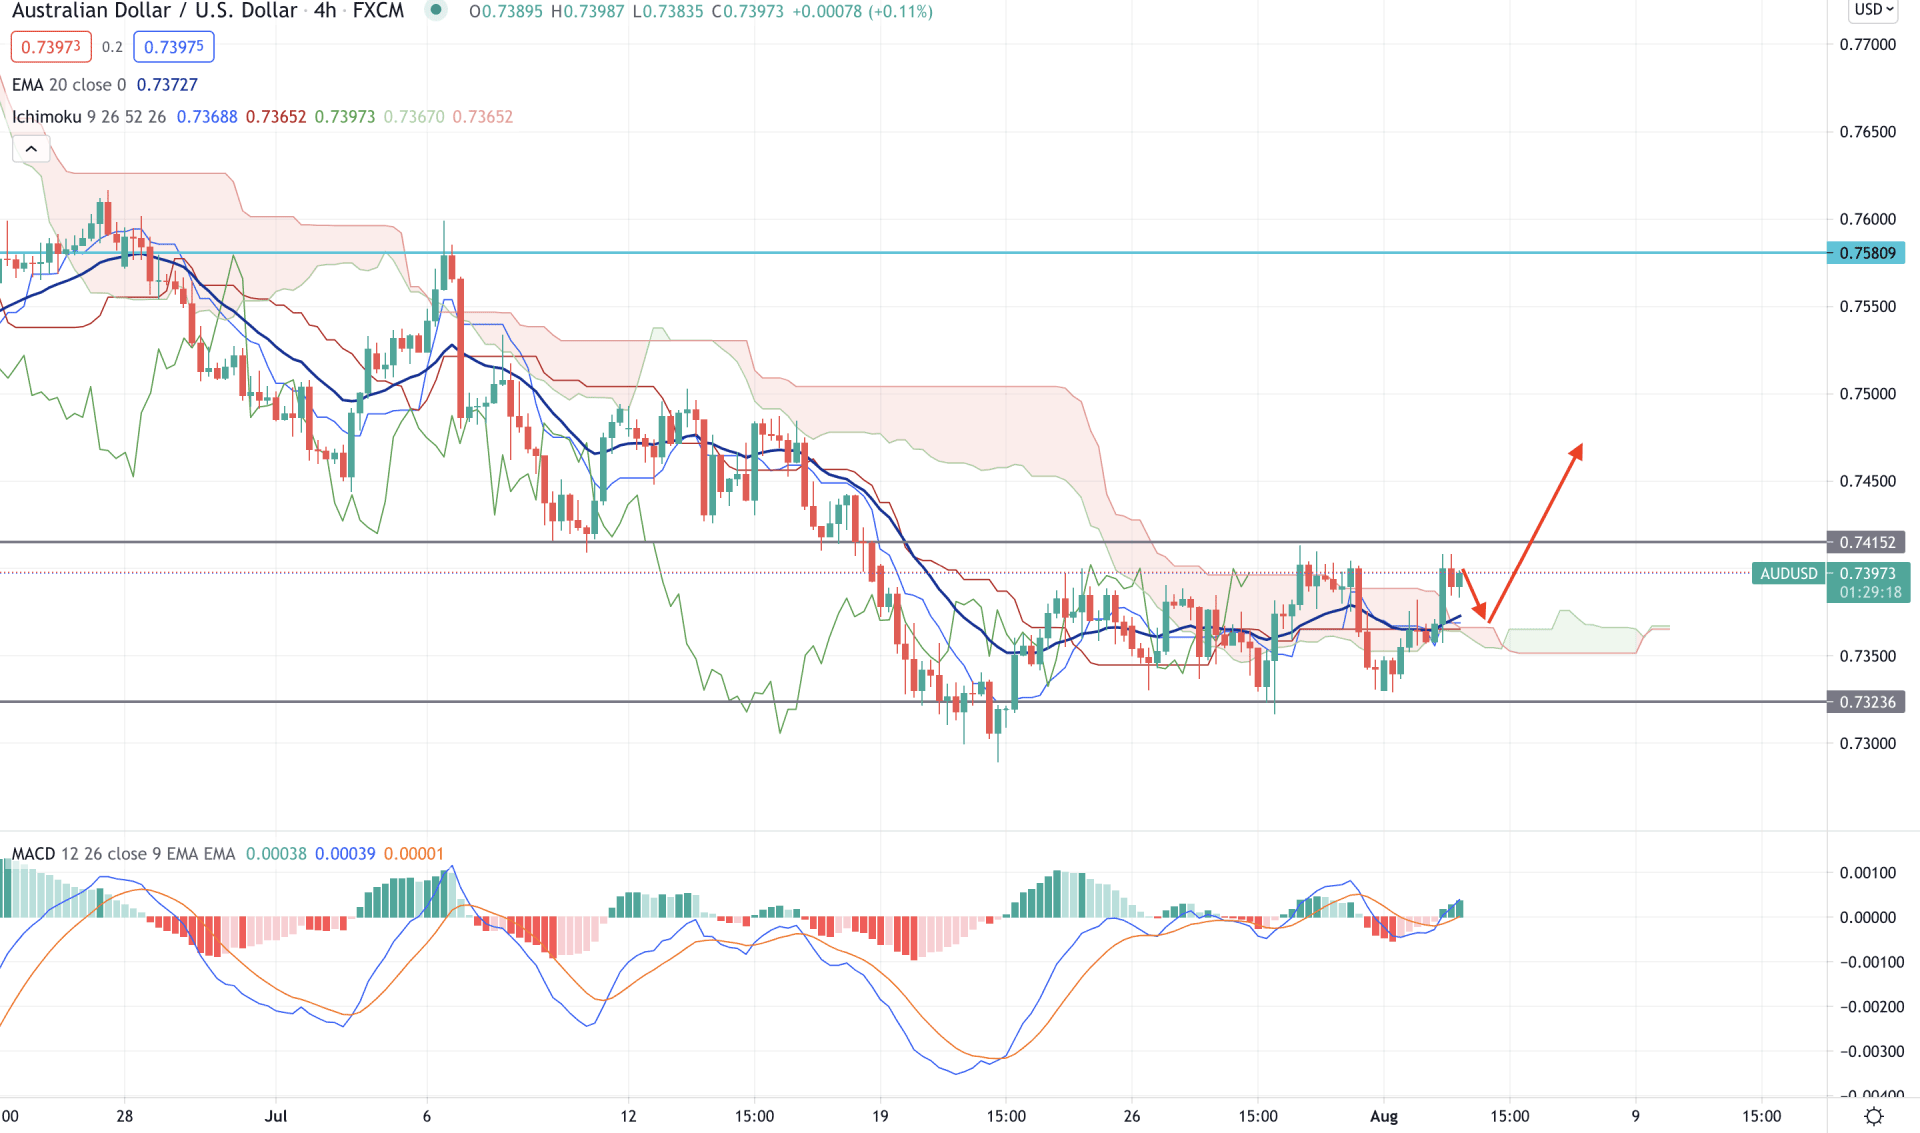
AUDUSD moved higher above the Ichimoku Kumo Cloud with a strong bullish H4 close, supported by the hawkish RBA. Senkou Span A moved above the Senkou Span B, but the price and Chikou Span failed to break the 0.7415 static level.
The above image shows that the price broke above the dynamic Tenkan Sen and Kijun Sen with a tremendous speed before starting the correction. Moreover, in the indicator window, MACD Histogram moved above the zero line and made new highs. Therefore, as long as the price is trading above the Cloud support of 0.7351, it has a higher possibility of moving up. In that case, a break above the 0.7315 with a strong bullish H4 close is essential.
On the other hand, a bearish H4 close below the 0.7323 may resume the broader bearish trend and take the price towards 0.7235 support level.
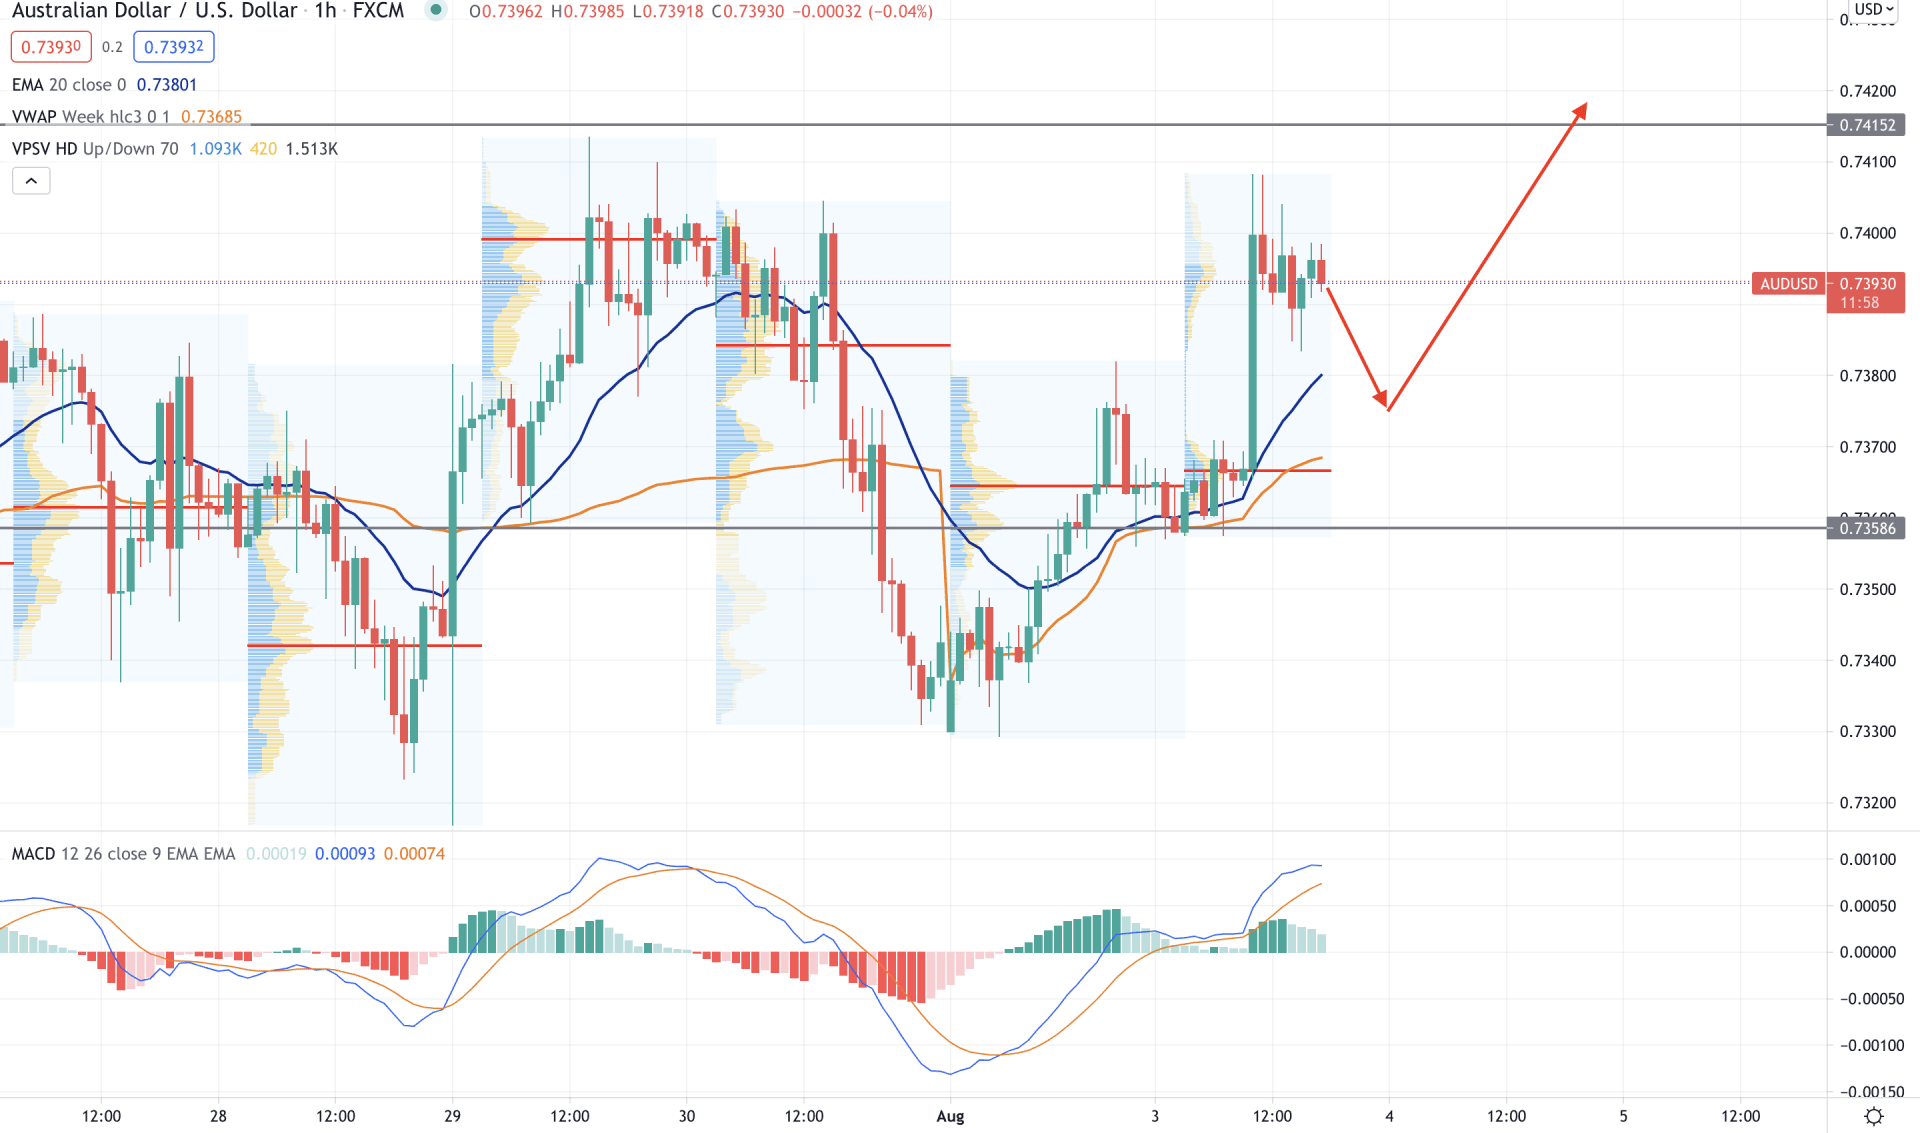
In the intraday chart, the most recent price action becomes bullish as soon as the price moves above the intraday high volume level of 0.7366 with a strong bullish H1 candle. Moreover, the price moved above the dynamic 20 EMA and vwap and held the level until the US Open.
The above image shows the H1 chart of AUDUSD where the price is above the intraday high volume level and dynamic vwap. However, MACD Histogram is bullish but squeezing to the zero levels, indicating a bearish correction.
Therefore, a bearish correction is pending, and any bullish rejection from the dynamic 20 EMA or vwap may initiate a strong bullish leg above the 0.7415 level. On the other hand, a bearish H1 close below the 0.7358 static level may alter the current market structure and take the price lower towards the 0.7300 area.
As of the above observation, a strong bullish daily close above the 0.7415 level may activate the AUDUSD bull. However, the H4 chart is still bullish, where any rebound from the Cloud support may increase the buying possibility.
On the other hand, a strong rejection from the 0.7415 level with a bearish daily close may lower the price towards the 0.7235 level.


