
Published: March 28th, 2023
As banking crisis fears subside, risk sentiment remains positive. As a result, there is pressure on the safe-haven USD, benefiting the risk-sensitive AUD. However, the takeover of Silicon Valley Bank by First Citizens Bank & Trust Company calmed markets, which might improve investors' confidence.
The Federal Reserve's less aggressive inflation-fighting has kept USD bulls on the defensive, which boosted the AUD/USD pair. Last week, the US central bank hinted at a pause in interest rate hikes. On the other hand, Retail Sales in Australia rose 0.2% MoM in February, supporting the AUD.
While the above factors support AUD/USD appreciation, bullish traders may be deterred from becoming aggressive as the Reserve Bank of Australia (RBA) will not raise interest rates at its April policy meeting.
US bond yields and risk sentiment may affect the USD and provide short-term trading opportunities. Therefore, investors should watch near-term price action to find the best place to open a trade in the AUDUSD pair.
Let’s see the upcoming price direction from the AUDUSD technical analysis:
In the higher timeframe price action, a corrective momentum is seen in the AUDUSD price as the monthly candles move sideways within a symmetrical triangle. However, the weekly price is sideways after a strong downside pressure, which is a primary indication that bears may regain momentum.
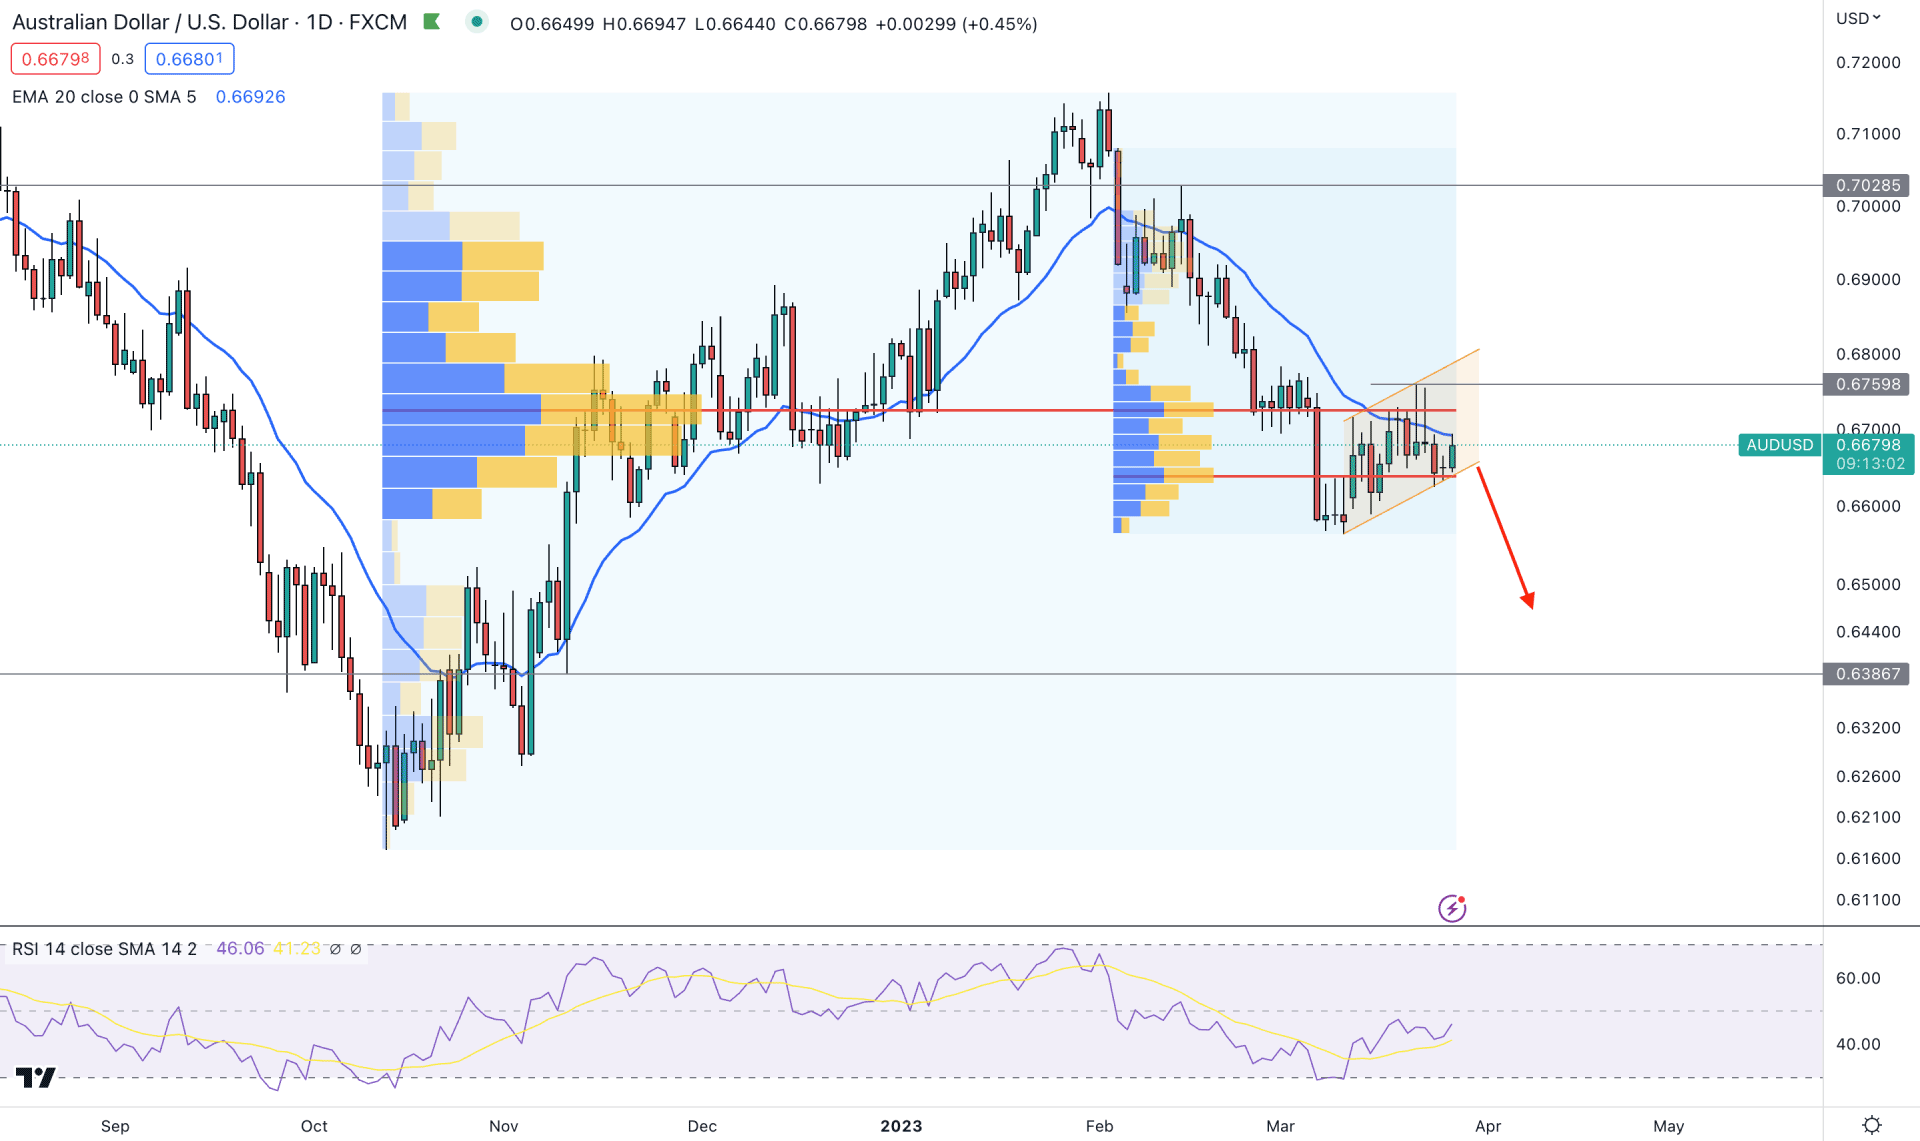
Coming to the daily price action- a strong downside momentum with a buy-side liquidity gram is seen from the 0.7157 level, which will be the top of the current tradable range. On the downside, a similar but inverse price action is visible at the 0.6174 level, which will be a valid bottom. The current price is just above 50% of this trading range, at the 0.6648 level. As the downside pressure is on and the price is trading in a premium zone, any bearish opportunity could trigger the momentum at any time.
Another sign of a corrective price action is visible from high volume levels. The latest high volume level since 13 october 2022 is at 0.6727 level, which is above the current price. Moreover, another level since 2 February 2023 is at 0.6639 level, below the current price. In that case, the bearish possibility would be solid if the price comes below these levels and forms a bearish daily candle.
The emerging ascending channel formation indicates a reaccumulation phase, but a valid break below the channel support is needed before opening a short position.
In the main price chart, the price is facing an immediate resistance from the dynamic 20-day EMA, from where selling pressure may come.
Based on this structure, the overall behavior is corrective, where a bullish break and a daily candle above the 0.6759 level could eliminate the bearish opportunity. On the other hand, a bearish continuation pattern with a daily candle below the 0.6600 psychological level could validate the bearish possibility, targeting the 0.6300 level.
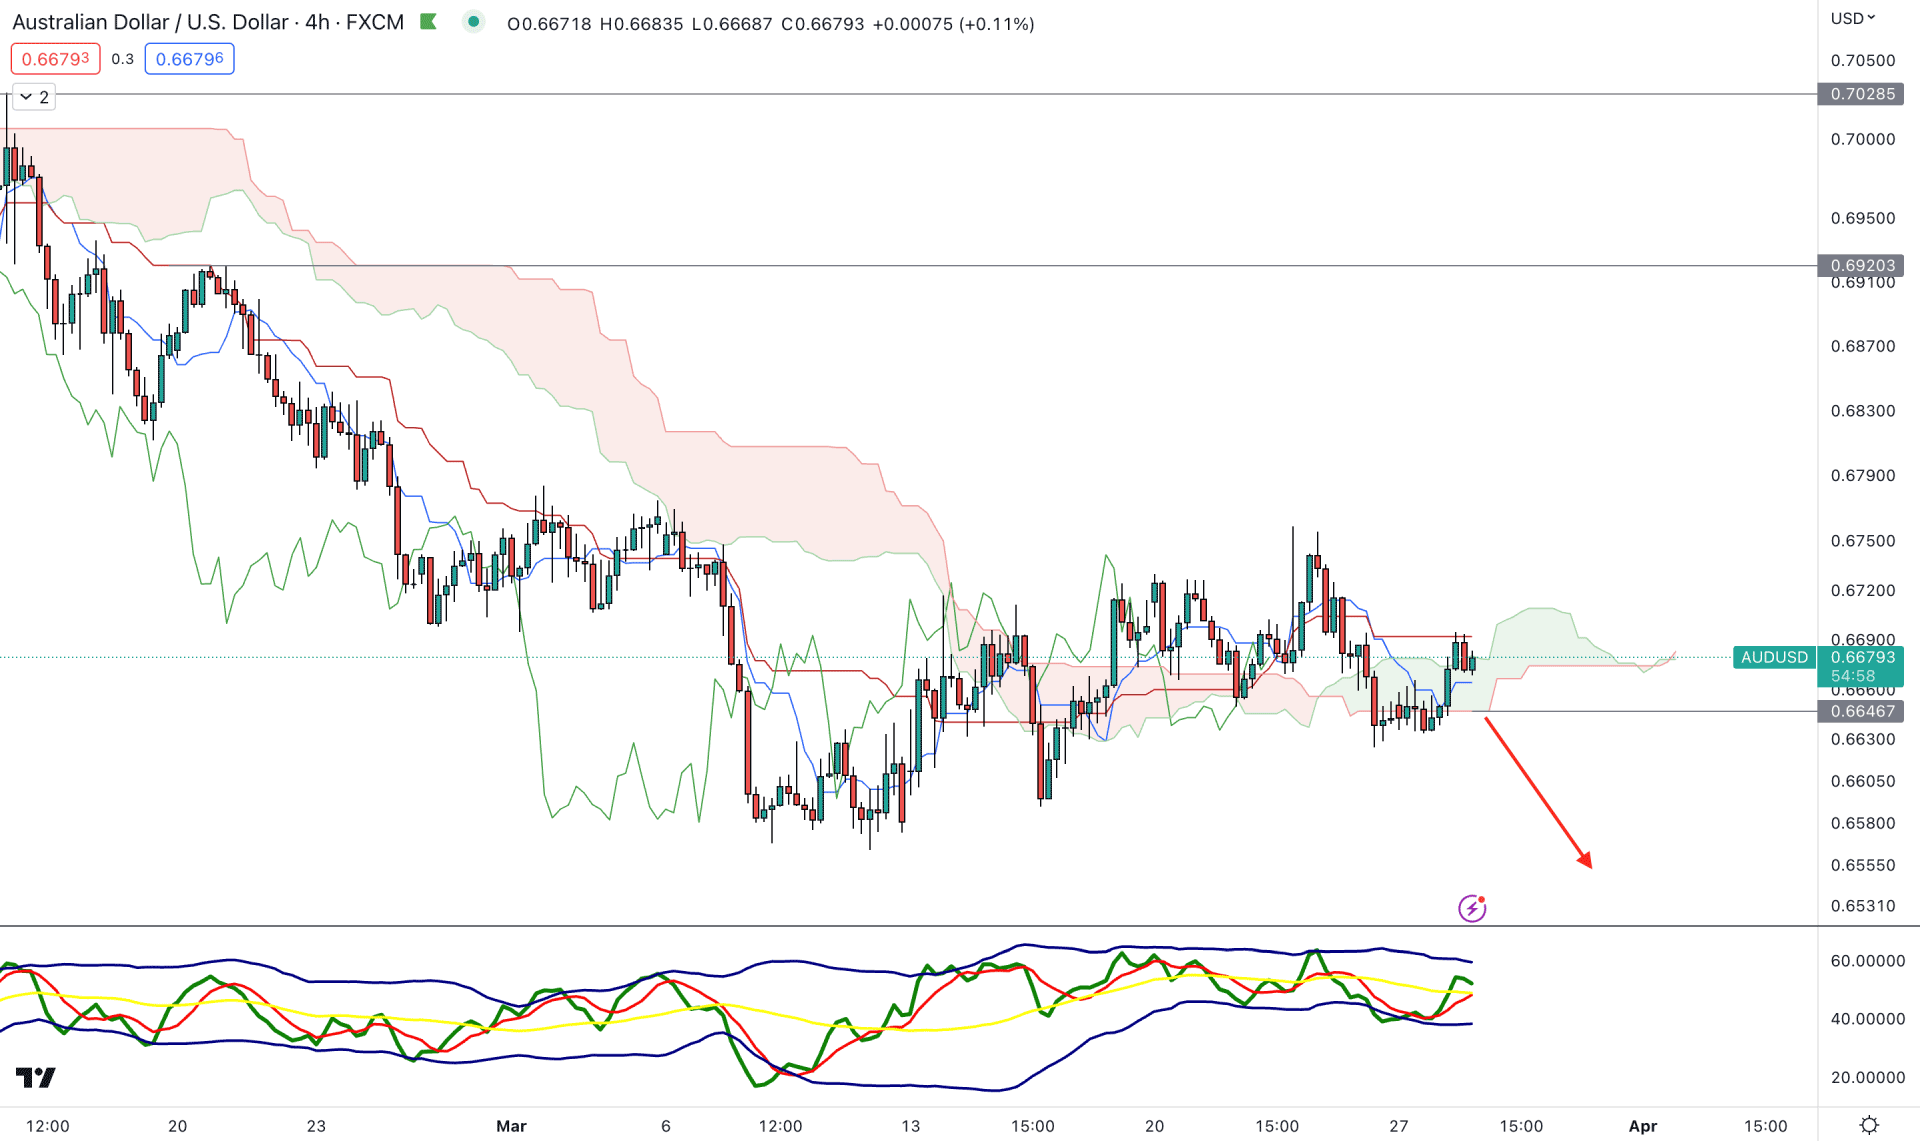
In the H4 chart, the current price trades sideways after a long bearish pressure. In the recent price chart, multiple violations from the dynamic Kumo Cloud area are visible, which is an indication of a strong consolidation.
In the future cloud, the thickness of the cloud is not supportive to bears as the Senkou Span A and B come closer, indicating a price reversal.
The indicator window shows the corrective momentum as the current TDI level is above the 50.00 level with a bullish vibe.
Based on this structure, a bearish H4 candle below the 0.6646 static level could resume the bearish trend toward the 0.6500 level. However, a bullish rebound with an H4 candle above the dynamic Kijun Sen could extend the consolidation.
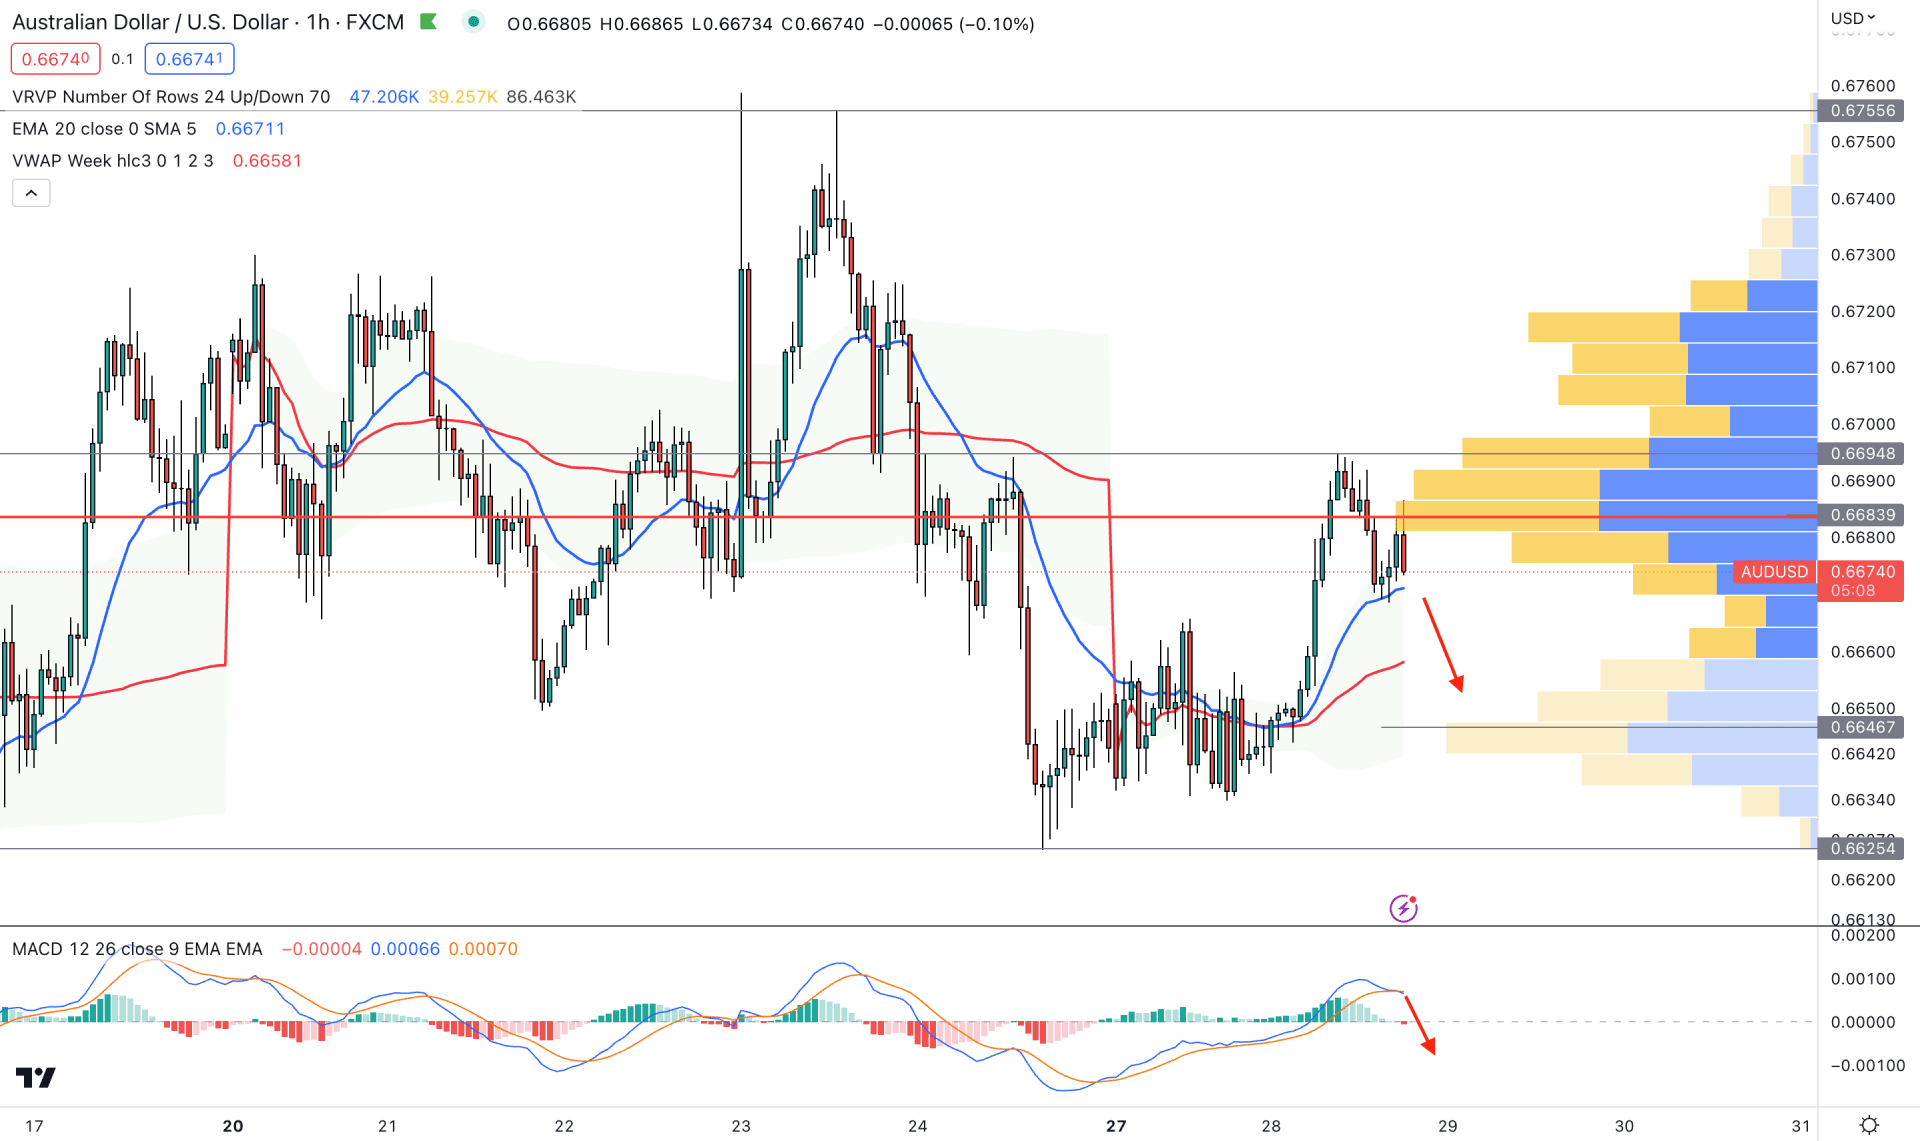
In the hourly chart, the current price shows a bearish pressure from the visible range high volume level. It is a sign that bears are active in the market and can regain momentum soon.
The dynamic 20 EMA and weekly VWAP are still below the price and working as support levels. In that case, a break below the 20 EMA is needed before relying on the selling pressure.
The indicator window shows a bearish crossover in MACD EMA, while the current Histogram is bearish.
Based on the H1 price prediction, bearish momentum is solid as long as the price trades below the 0.6700 psychological level. In that case, the bearish pressure may extend toward the 0.6647 support level.
Based on the current price structure, a bearish momentum needs a valid break from the ascending channel before aiming for the 0.6300 psychological level. As the current price is corrective investors should monitor intraday swing to find the best area to grab an early opportunity.


