
Published: January 18th, 2022
According to the World Bank projection for the global GDP growth, there is a possibility of shrinking it to 4.1% from the previous report of 4.3%. In particular, the US GDP was forecasted to downgrade from 4.2% to 3.7% for 2022. The main reason behind the downside movement in GDP is the current Omicron sentiment and overwhelming health issues.
As per Fed chair Powell’s testimony, the Asset purchase will be finished in March, and the rate hike cycle will begin. Moreover, he added that the Fed might start reducing the balance sheet size before the end of 2022 if the economic condition remains stable than the previous time.
The US inflation report increased to 7% y/y in December. The headline figure indicates that the Fed needs a step-by-step approach to tighten inflation with 4 rate hikes in 2022.
On the other hand, the situation in the Asian giant economy Australia is slightly different where the global demand subsided from the Omicron sentiment while the export remained stable above the 2% target. However, the bearish sentiment in the AUDUSD price came as soon as China’s GDP moved down from 4.9% to 4.0%.
Let’s see the upcoming price direction from the AUDUSD technical analysis:
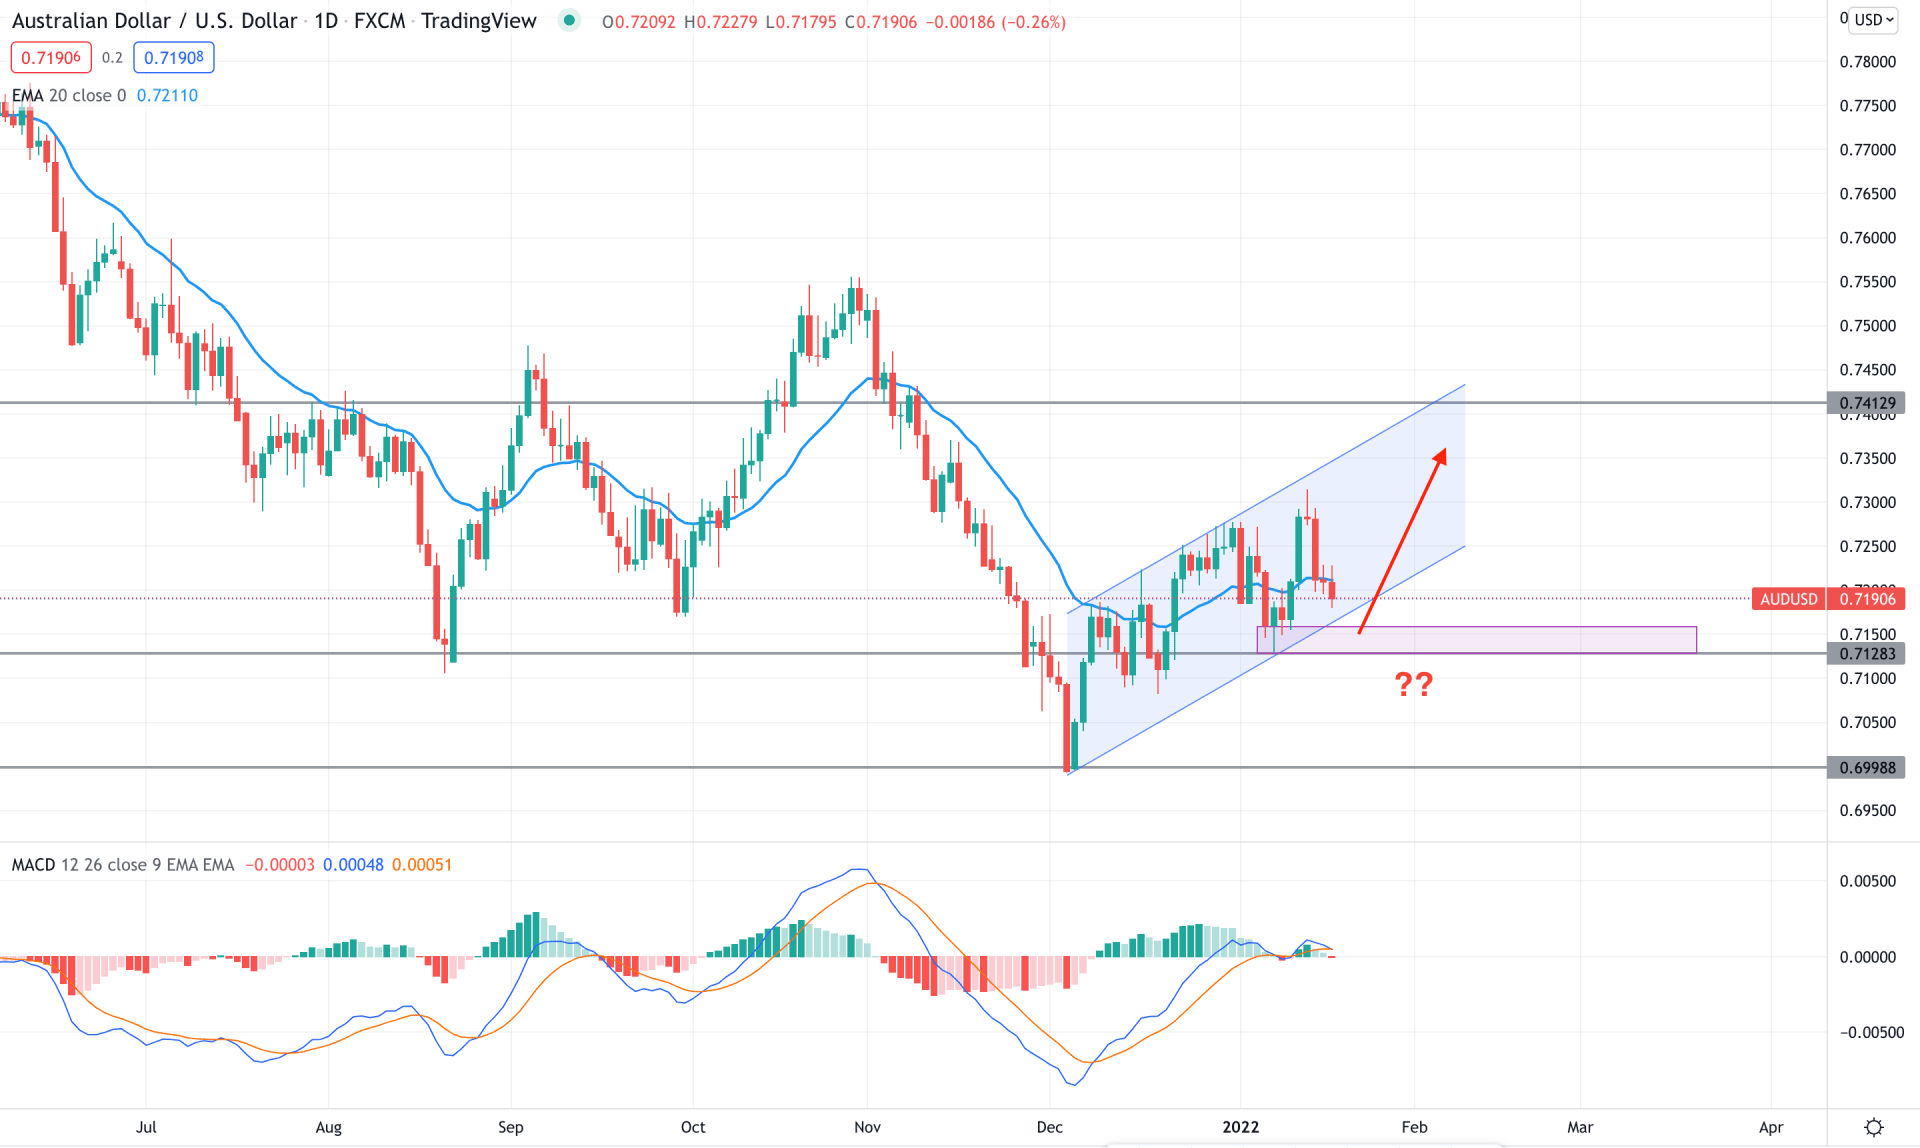
AUDUSD is trading within a bearish trend where the recent price showed multiple lower lows formation. However, the market became volatile after testing the 0.7000 key support level and the price aimed higher with a corrective speed. The price action from the 0.7000 key support level is very corrective and ,oves up with a corrective structure.
The above image shows how the price moves within a bullish channel with multiple violations from the dynamic 20 EMA. Moreover, the MACD Histogram became corrective. However, it is not right for taking trades from the channel breakout as the current price is still within the channel and there is more room for a bullish correction.
Based on the daily context, if the price comes to 0.7150- 0.7100 area, investors should wait for a bullish rejection in the daily chart for going long in this pair. In that case, the ultimate target would be the 0.7400 resistance level. On the other hand, a break below the 0.7100 level with a bearish daily candle is important to consider the upcoming price pressure as bearish. In that case, the price is likely to test the 0.7000 to 0.6050 swing area.
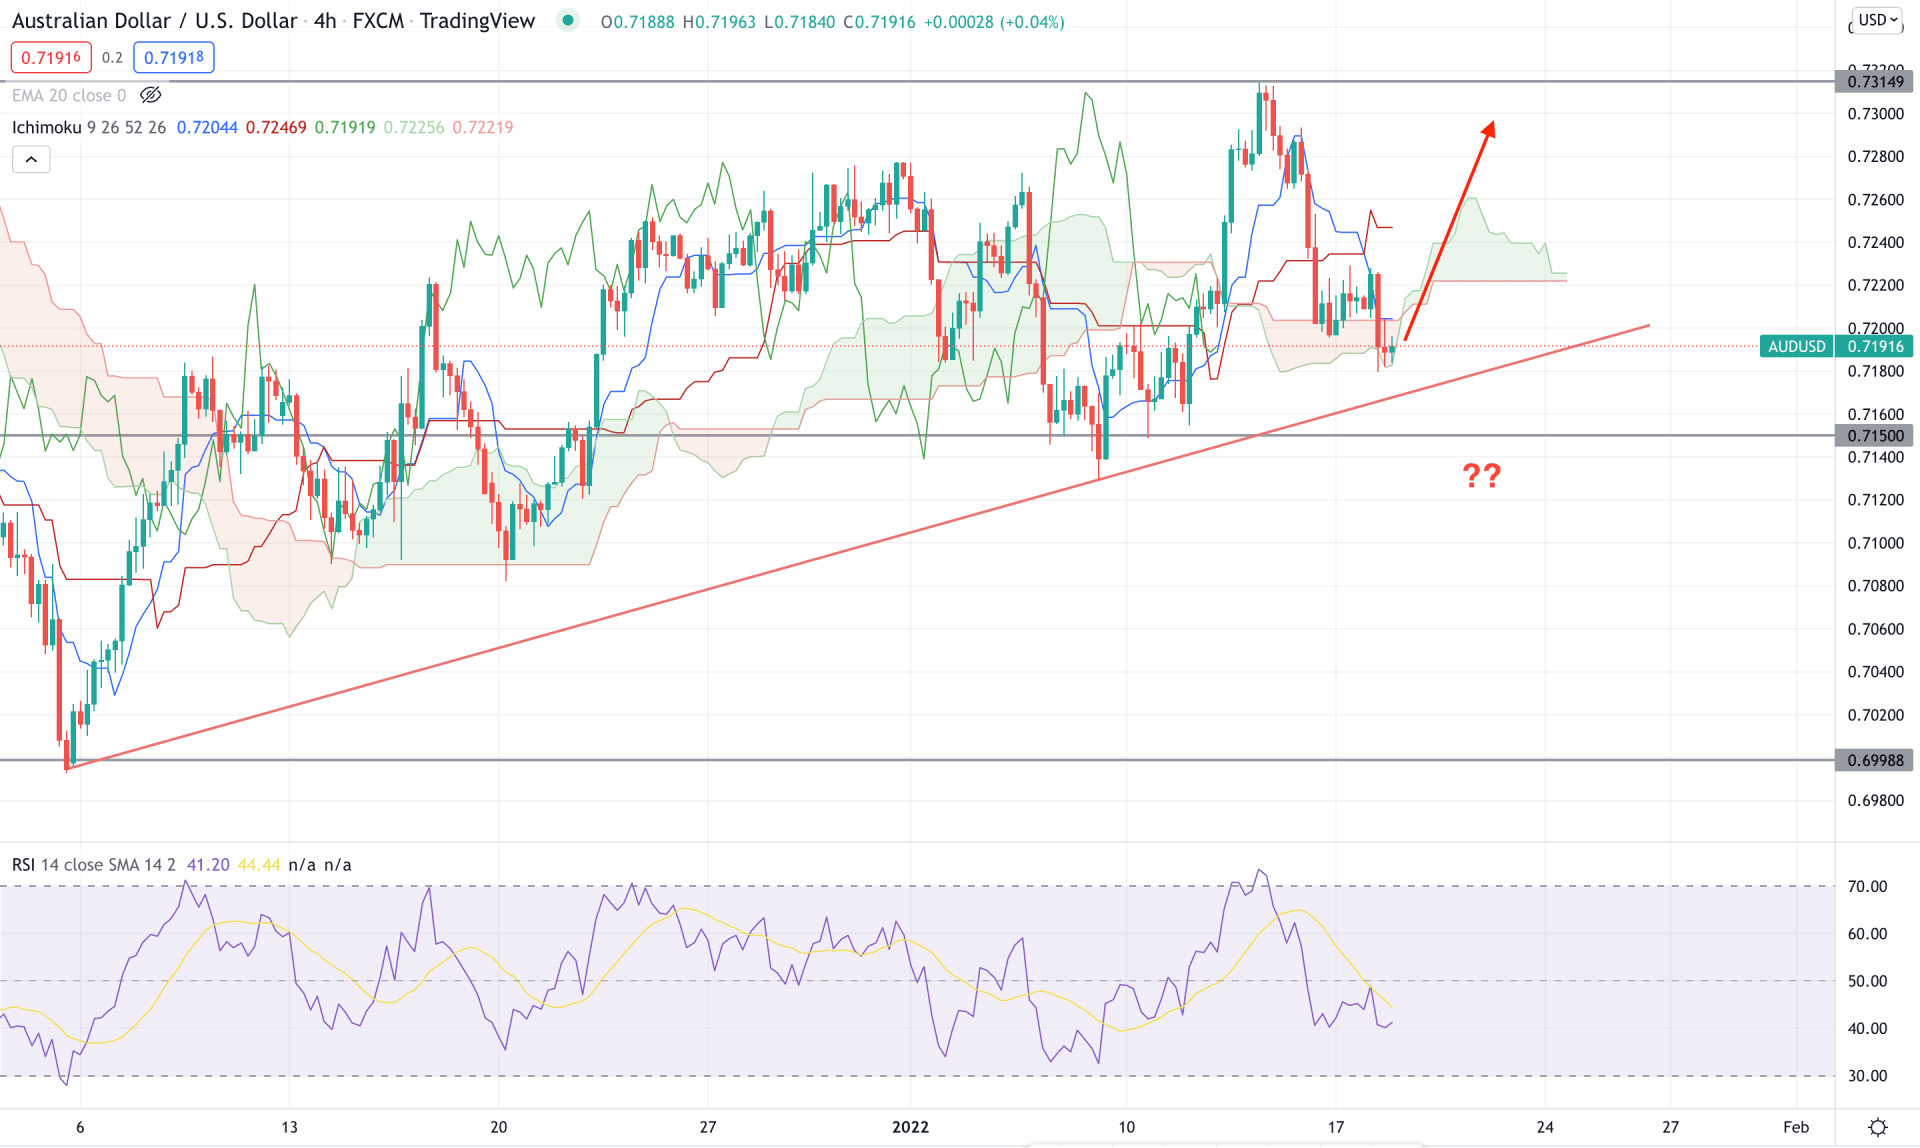
AUDUSD H4 chart shows the different picture of the market where the current price is moving within a bullish trendline where the future cloud is bullish. The Senkou Span A is above the flat Senkou Span B and moving sideways, which is a price sign that the price needs a breakout from near-term levels before showing a nice movement.
The above image shows how the RSI remains below the 50 level and aiming lower. Meanwhile, the current price is below the dynamic Tenkan Sen and Kijun Sen while the lagging span is facing support from the price.
The buying approach needs the price to move above the dynamic Kijun Sen and Kumo Cloud with the RSI above 50 level. In that case, the primary price target would be 0.7314 swing high. On the other hand, if the price moves lower a bearish H4 close below the 0.7150 would signal further selling pressure in the price towards the 0.7000 area.
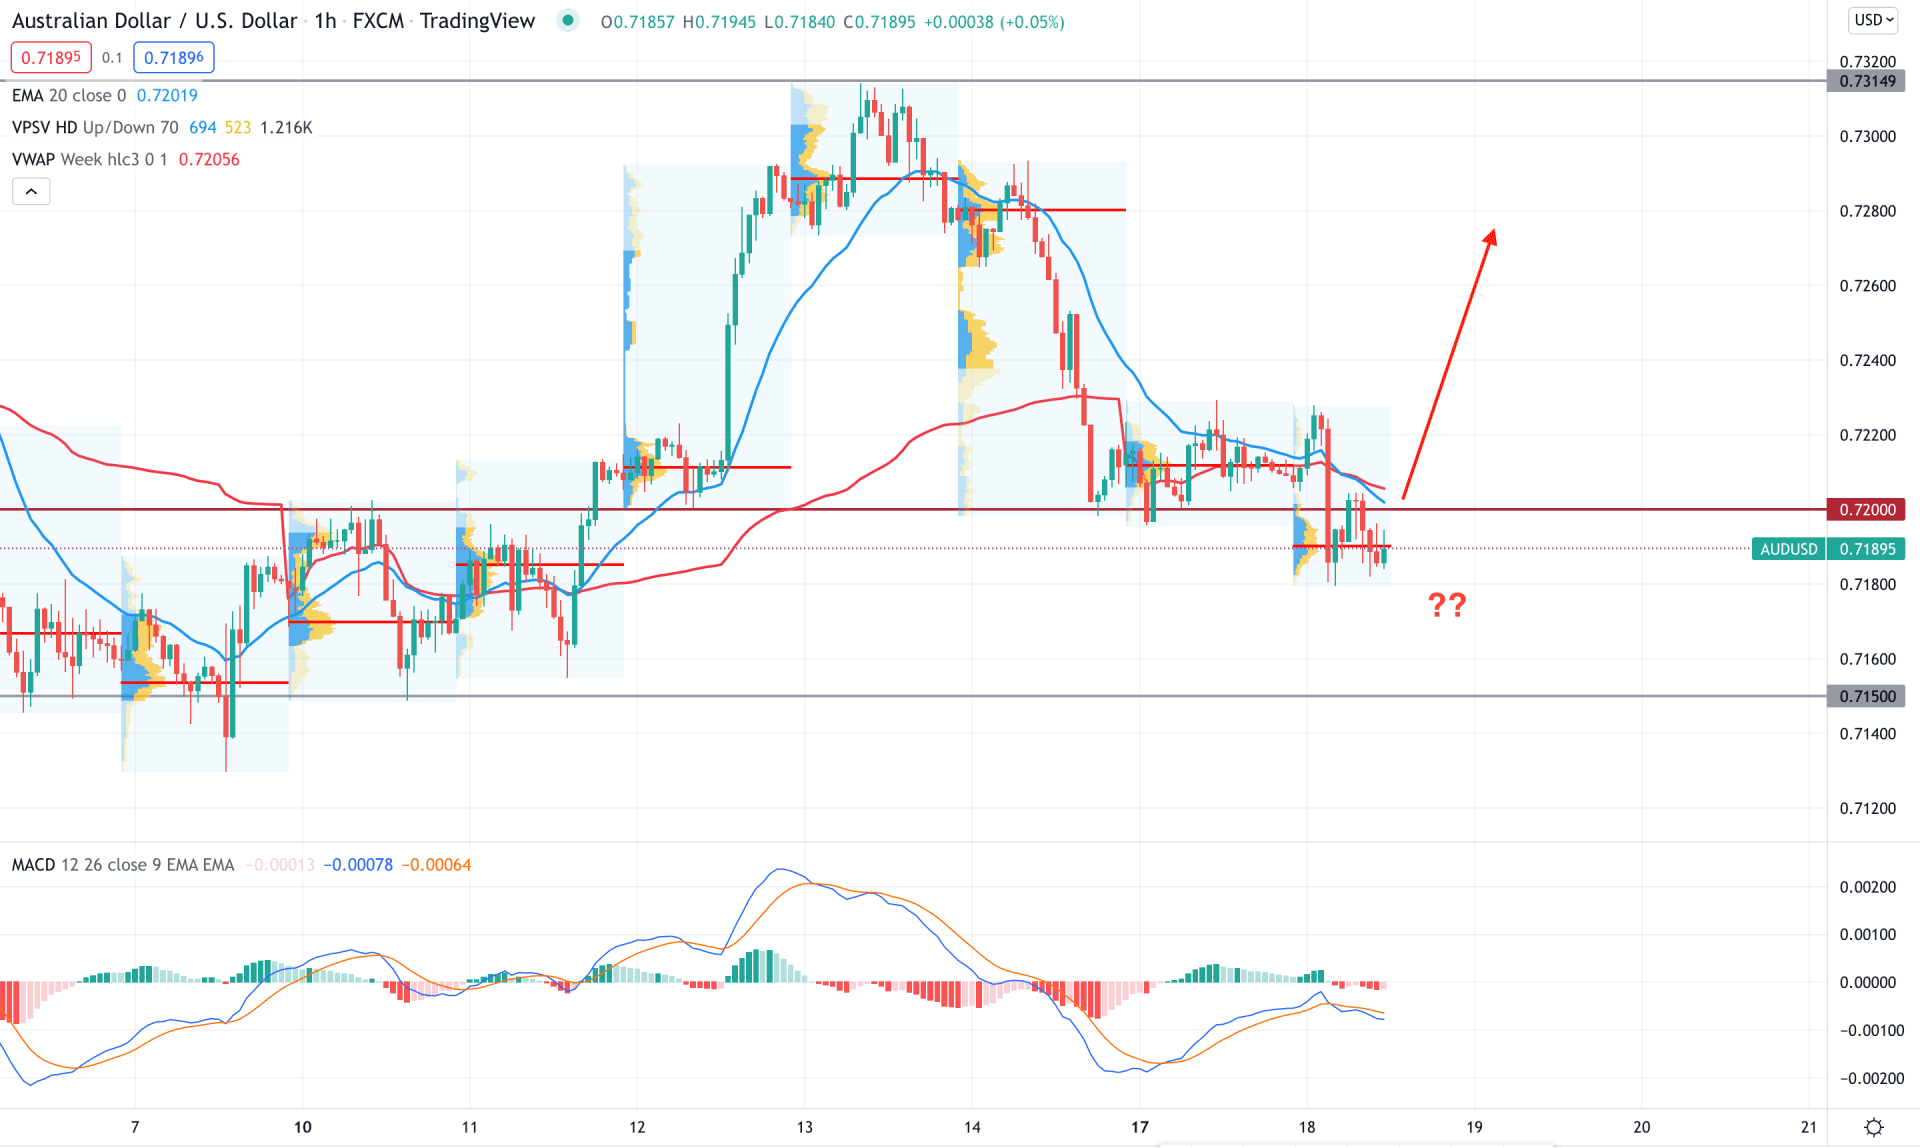
AUDUSD intraday price remains corrective after the Asian session, where the most recent trading volume is still near the current market price. However, the selling pressure from China's economic release made bears strong by taking the price below the 0.7200 event level. In that case, bulls should see how the price reacts on the 0.7200 area before going long in this pair.
The above image shows that the selling pressure from the early Asian session pushed the price below dynamic 20 EMA and weekly VWAP and these are working as minor resistance. In that case, if the price moves up, above the dynamic VWAP a strong bullish pressure towards 0.7314 may come in the coming session. On the other hand, a break below the 0.7170 intraday low, or a rejection from 0.7200 with a bearish H1 close, would be a selling opportunity in this pair towards the target of 0.7150 area.
According to the current observation, AUDUSD has a higher possibility of moving up towards the 0.7400 area as a part of the bullish channel extension. However, a break below the 0.7100 with a bearish daily close might alter the current scenario and lower the price towards the 0.6950 area.


