
Published: November 15th, 2023
The AUDUSD pair has maintained its position above 0.6500 with a risk-on sentiment, which is fuelled by weaker US inflation data.
Inflation in the US appears less favorable, according to the Consumer Price Index (CPI), which rose 3.2% annually in October. As a result, the value of the US Dollar (USD) plummeted significantly, attaining its lowest level since the beginning of September.
Similarly, the yield on 10-year US Treasury notes plummets from 4.60% to 4.48%, its lowest level since September 26. As a result, the Federal Open Market Committee's (FOMC) prospects for additional interest rate hikes are significantly diminished by these disheartening figures. Now, the probabilities of rate hikes in December and January have been lowered to zero, which acts as a positive catalyst for the AUDUSD pair.
Let’s see the upcoming price direction from the AUDUSD technical analysis:
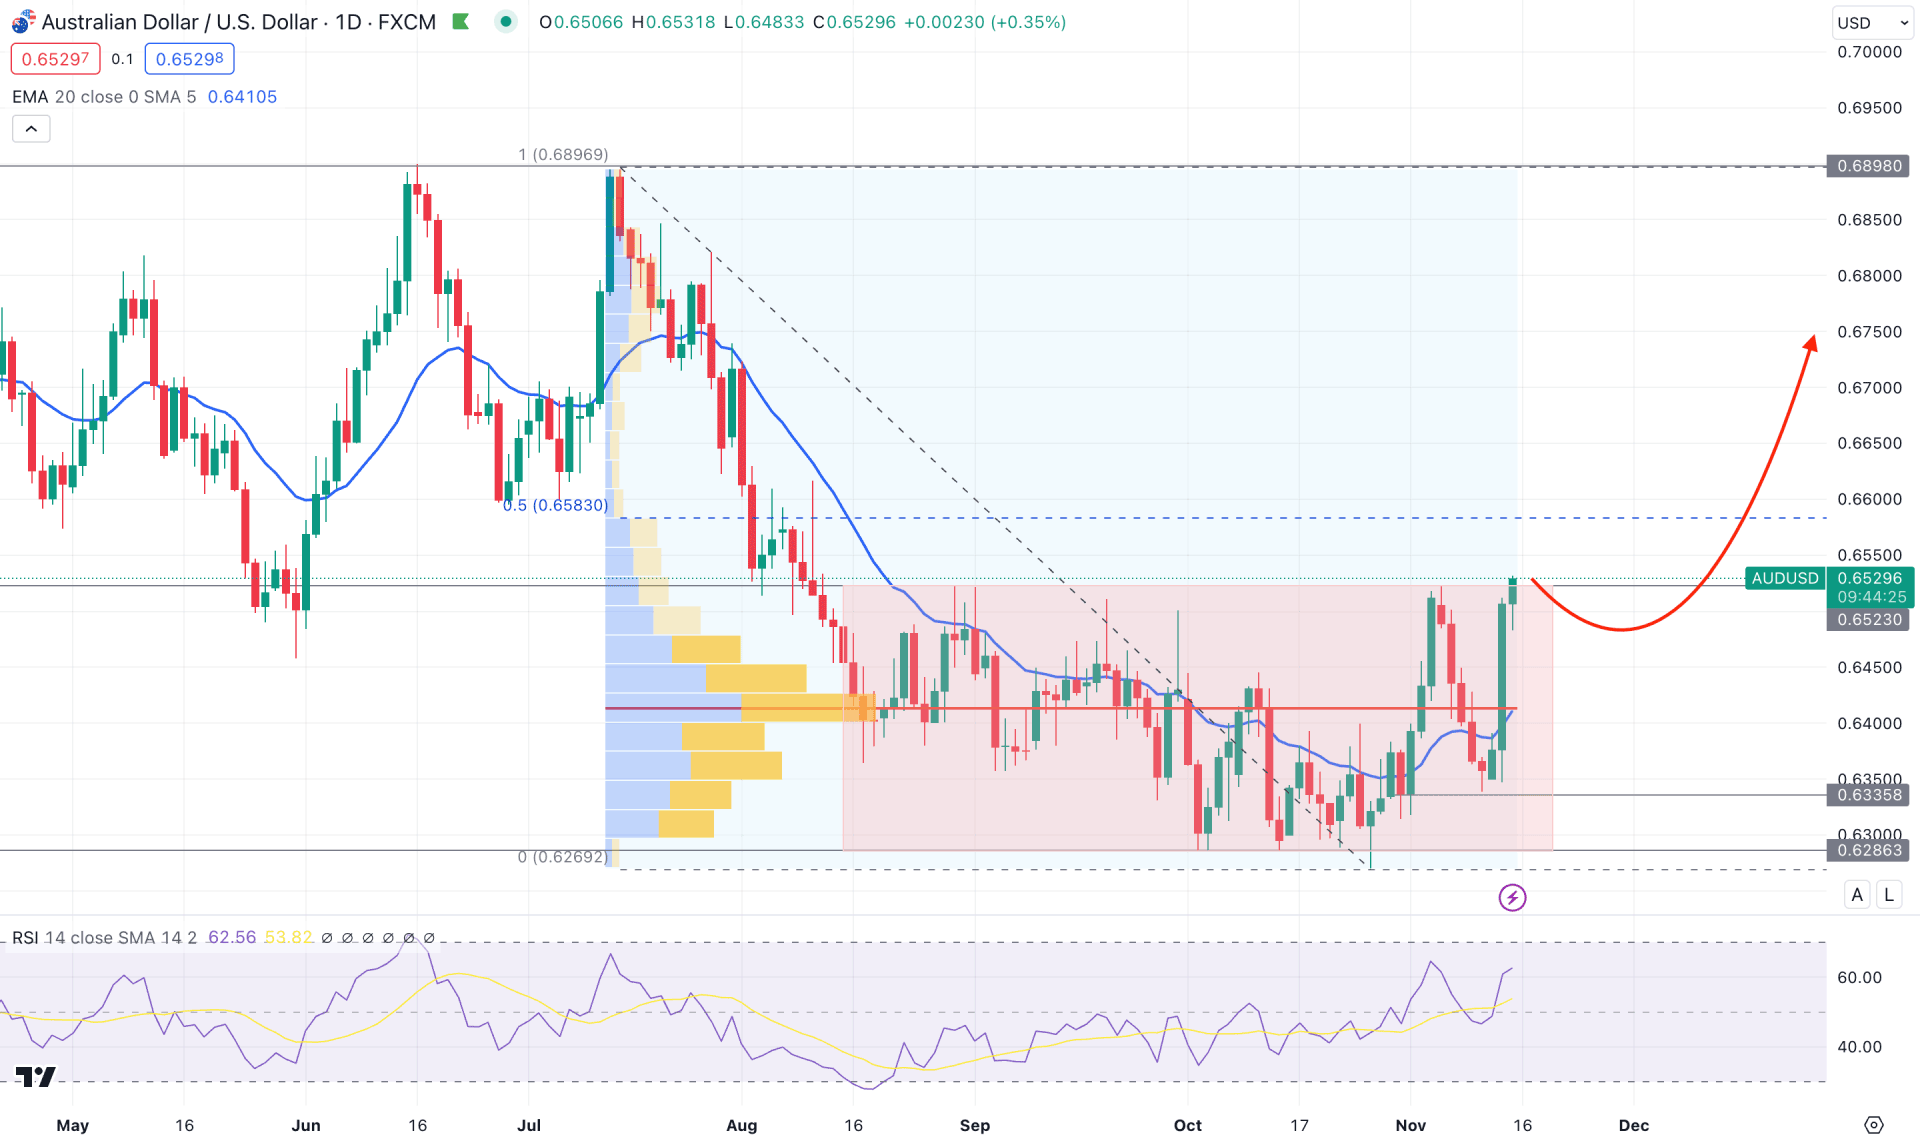
In the daily chart of AUDUSD, a consolidation is visible at the bottom from where a massive bullish pressure has come towards the rectangle resistance. As the most recent price hovers at the 0.8523 static level, we may expect buying pressure in the coming days.
In the higher timeframe, the price moved above the last two month’s high, while the weekly candle shows ongoing buying pressure with an immediate reversal. Although the week is not closed yet, investors should monitor how the price reacts in this area. A stable weekly candle above the 0.6500 level could indicate another impulsive leg in the coming days.
In the daily price, a long consolidation is visible at the 0.6523 to 0.6286 zone, from where any breakout needs a valid confirmation with an appropriate candlestick formation. Moreover, the volume formation in the consolidation area is positive for bulls. As per the visible range, high volume indicator, the most active level since July 2023 high is at 0.6413 level, which is at the 50% level of the existing rectangle area.
In the indicator window, the RSI shows buyers’ presence in the market as the recent level remained higher with an ascending pattern. Moreover, the latest reading of RSI is at 65.00, which suggests more upward possibility in the main price.
Based on the daily market outlook of AUDUSD, a valid bullish break above the 0.6580 level could open a long possibility toward the 0.6720 level. Above this level, unmitigated orders are present at the 0.6898 double-top zone, which could be the next resistance level.
On the bearish side, a bullish pressure above the rectangle resistance and an immediate rebound could indicate a selling pressure, targeting the 0.6286 rectangle low.
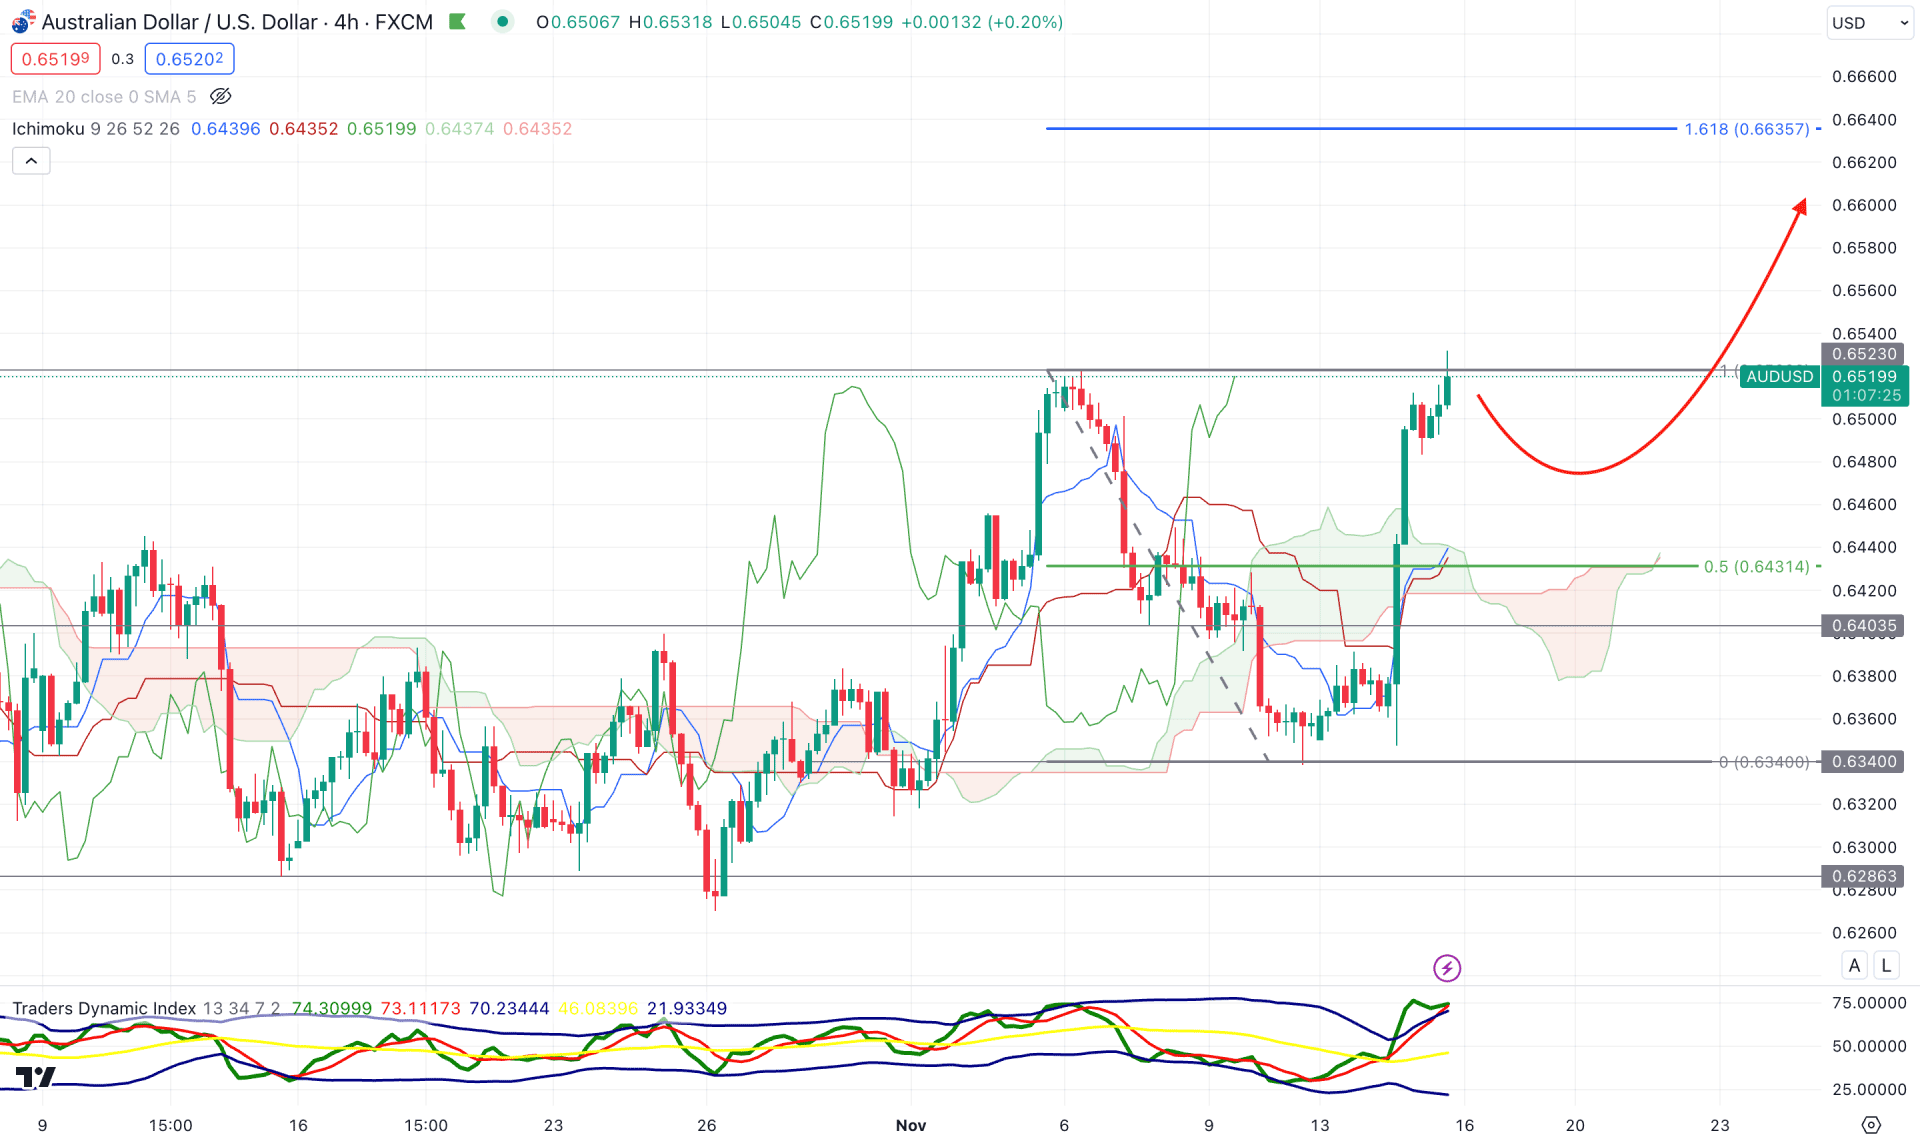
In the H4 chart, the future Ichimoku Cloud suggests a bullish reversal as the Senkou Span A and B come closer together with upward pressure. Meanwhile, the existing market momentum shows another bullish possibility as bears failed to hold the price below the Cloud support.
In the indicator window, the Traders Dynamic Index shows ongoing bullish pressure as the current level is above the 50.00 line. Therefore, another upside pressure might come as long as the price remains above the dynamic Kijun Sen support.
Based on the h4 structure, a downside pressure might come towards the cloud zone, where any bullish rejection from the 0.6450 to 0.6330 area could be a long opportunity. In that case, the buying pressure might extend toward the 0.6635 Fibonacci Extension level.
On the other hand, a bearish pressure is potent as a liquidity sweep from the 0.06550 psychological level could validate a short signal. In that case, a valid recovery below the 0.6472 low is needed before aiming for the 0.6340 bottom.
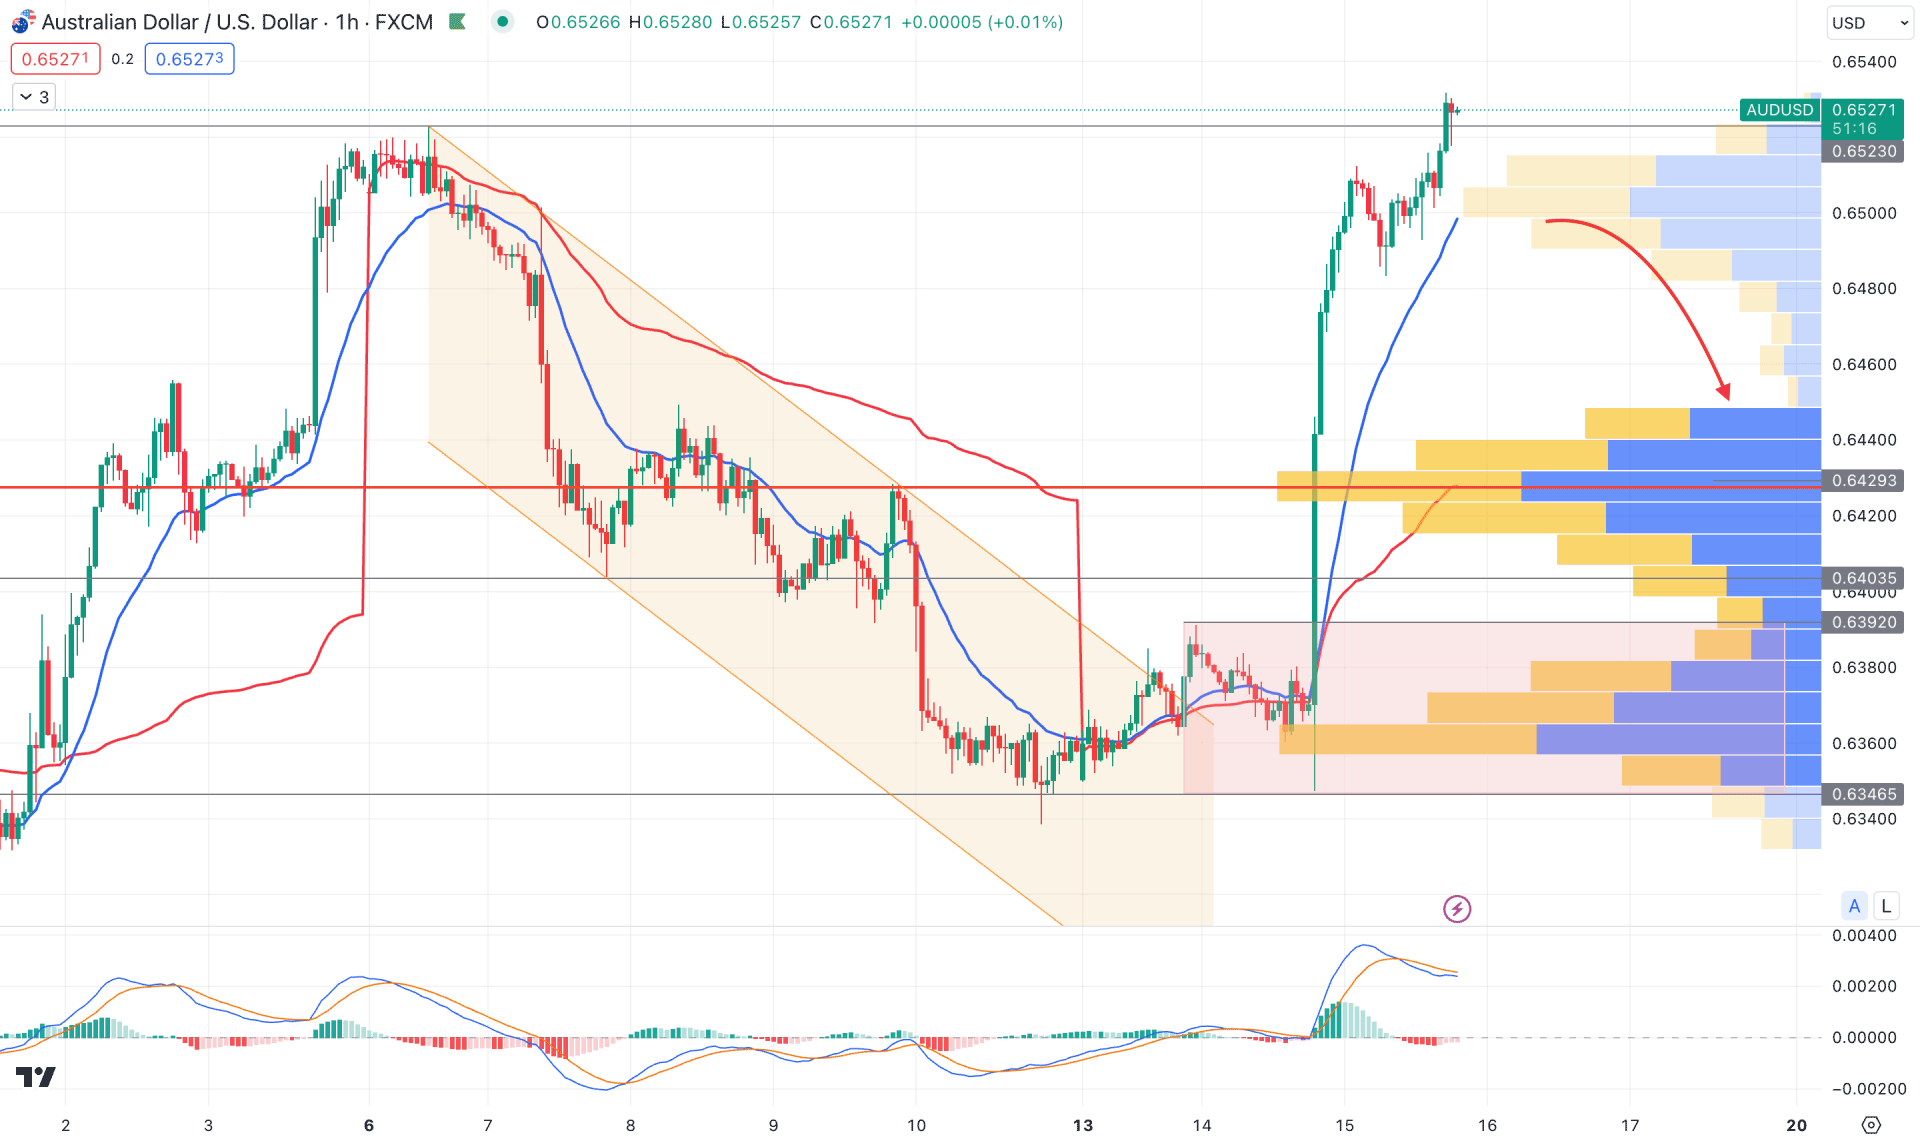
In the AUDUSD hourly chart, the overall market pressure is bullish, but the overextended price above the 0.6523 static level might result in a bearish reversal at any time.
The upward pressure was driven by the weaker US CPI, followed by a descending channel breakout. During that time, the price left the 0.6392 to 0.6346 area as a valid demand zone, which could be tested in the coming days.
Moreover, the MACD Histogram formed a bullish PNP structure, while MACD signal lines are above the neutral level.
Based on this structure, the price might come down to recover imbalances, where a bearish hourly close below 0.6482 could be a short opportunity.
On the other hand, the bullish possibility is potent after re-accumulating above the daily rectangle support before targeting the 0.6700 psychological level.
Based on the overall market momentum of AUDUSD, investors should closely monitor how the price reacts to the rectangle resistance. If the price holds above this static level in the daily timeframe, it could indicate a strong bullish trend reversal.


