
Published: October 30th, 2025
Throughout the day, the AUDUSD pair recoups its initial gains and declines slightly. As the US Dollar (USD) bounces back from early losses following the summit between American President Donald Trump and Chinese leader Xi Jinping in South Korea, the Australian dollar pair continues to decline.
Beijing agreed upon permitting the shipment of precious metals to Washington "openly and freely," according to US President Trump, who called his conversation with Chinese President Xi "amazing" after it concluded. Tariffs on Chinese goods to the United States have been lowered from 57% to 47%, he added.
The US dollar has become more appealing as economic relations between the US and China have improved. Jerome Powell, the chair of the Federal Reserve (Fed), has stated that a rate drop at the December decision meeting is another significant element that is helping the US dollar.
In general, the Australian dollar benefits from waning US-China trade tensions because the country's economy is mostly dependent on exports to Beijing.
Amid mounting inflationary pressures at home, traders are skeptical that the Reserve Bank of Australia (RBA) would lower interest rates once more this year. Price pressures climbed at a quicker rate of 1.3% in Q3 of the fiscal year, according to the Consumer Price Index (CPI) report released on Wednesday. This was faster than the previous reading of 0.7% and the predictions of 1.1%.
Let's see the complete outlook from the AUDUSD technical analysis:
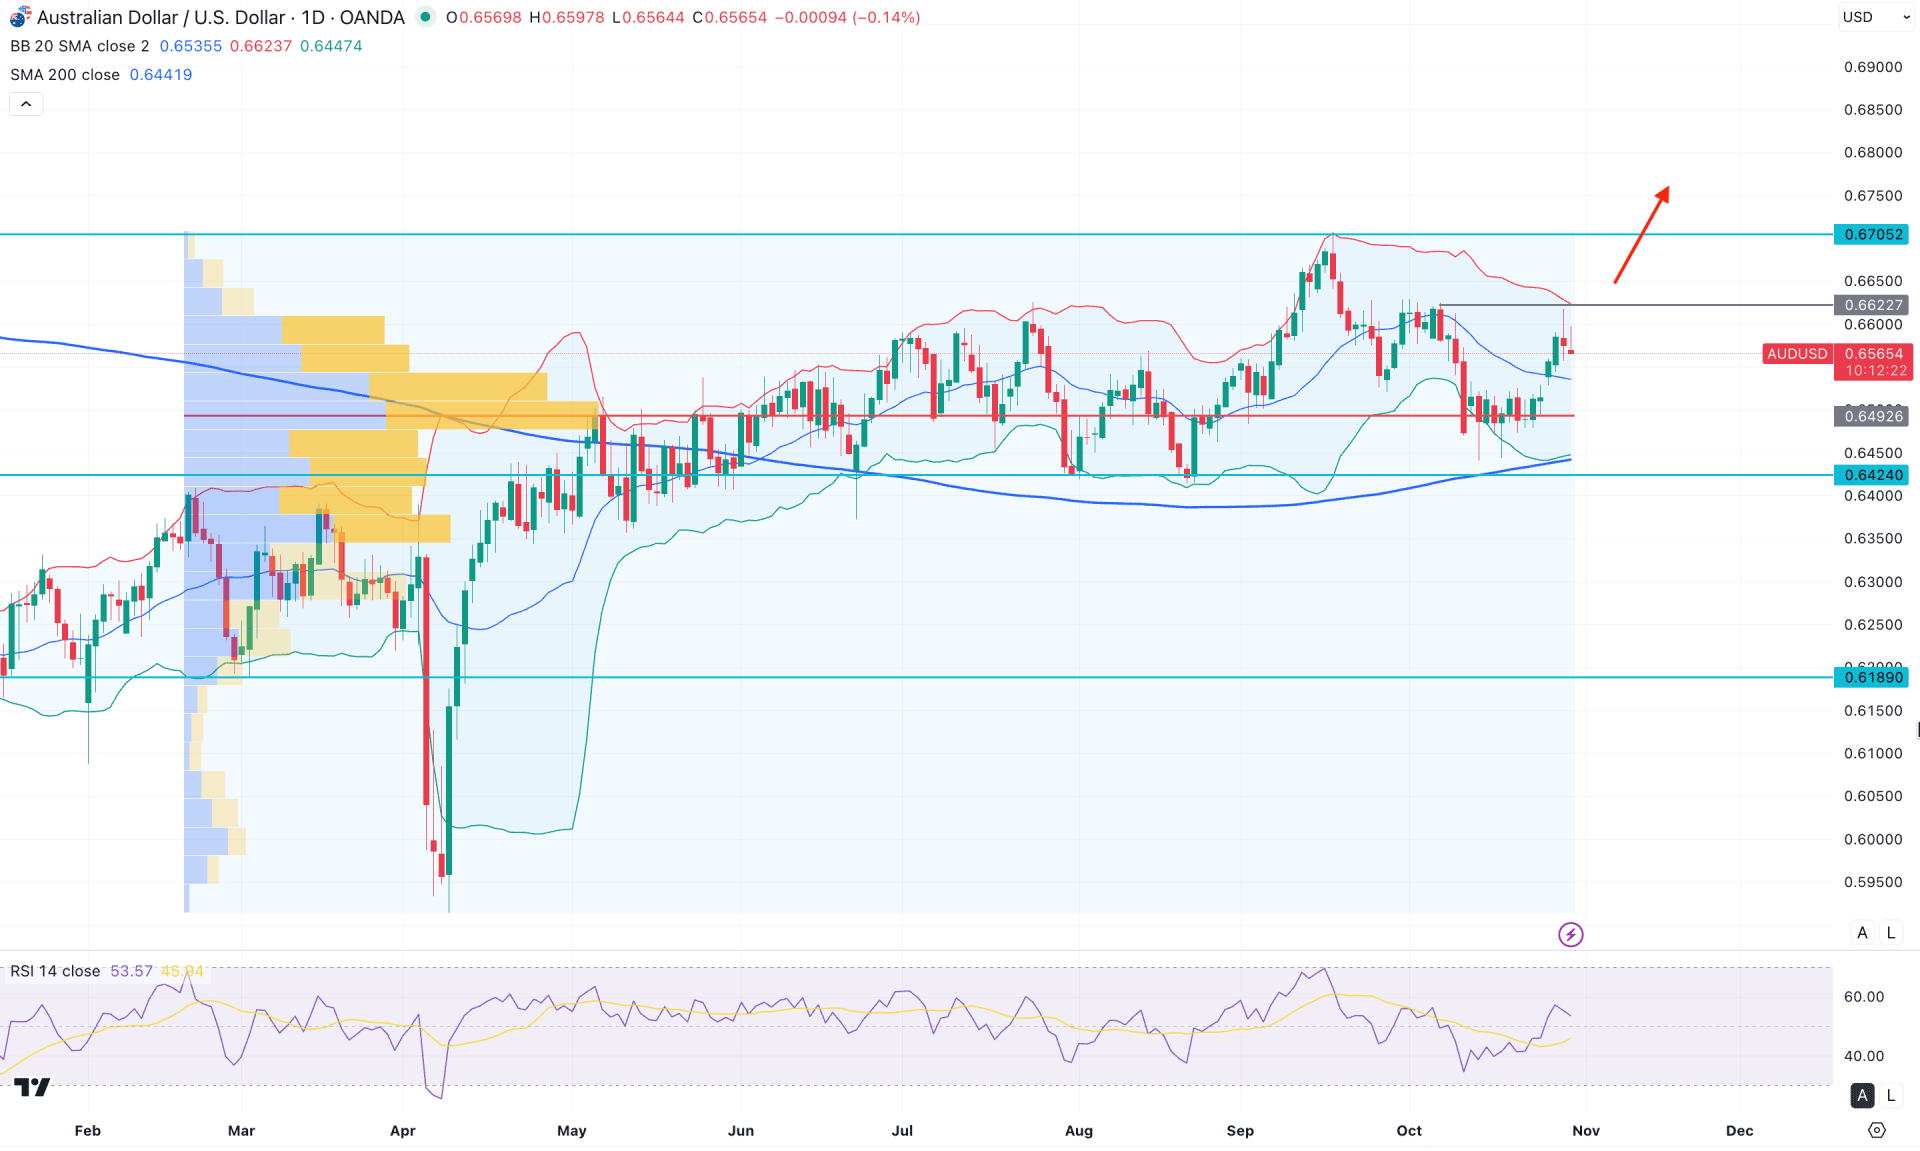
In the daily chart of AUDUSD, the overall market momentum remains bullish, supported by a decent bullish reversal following an exhaustion phase at the bottom. However, the recent price movement shows a corrective phase for a considerable time, which signals the possibility of a potential breakout ahead.
Looking at the higher timeframe, the price action still appears bearish, as multiple liquidity sweeps are visible around the 2024 highs and lows. Although the recent price is trading higher after a bearish exhaustion in February 2025, some corrective pressure may still persist.
From the volume structure, the bullish momentum looks solid, as the recent price is attempting a potential range breakout above the 0.6492 high-volume line. As long as the price stays above this crucial level, we may expect a bullish continuation soon.
On the main price chart, a bullish rebound is visible above the mid-Bollinger Band line, where the price is currently facing minor resistance from the 0.6622 static level. Since the upper Bollinger Band remains untouched, any downside recovery could offer a potential buying opportunity. Moreover, the 200-day SMA is positioned below the lower Bollinger Band with a bullish slope, reinforcing the buying sentiment.
In the secondary indicator window, the Relative Strength Index (RSI) shows constructive momentum, with the current line moving around the 50.00–52.00 zone. However, some consolidation is seen after a bullish rebound from the 40.00 area, suggesting that a potential retest of the 70.00 zone may occur soon.
Based on the market outlook, a bullish breakout with a daily candle close above the 0.6622 resistance level could open the door for a rally towards the 0.6750 psychological level.
On the other hand, a minor downside correction toward the 0.6492 level could be expected. A break below 0.6492 might find dynamic support near the 200-day SMA before any deeper move toward the 0.6000 psychological level.
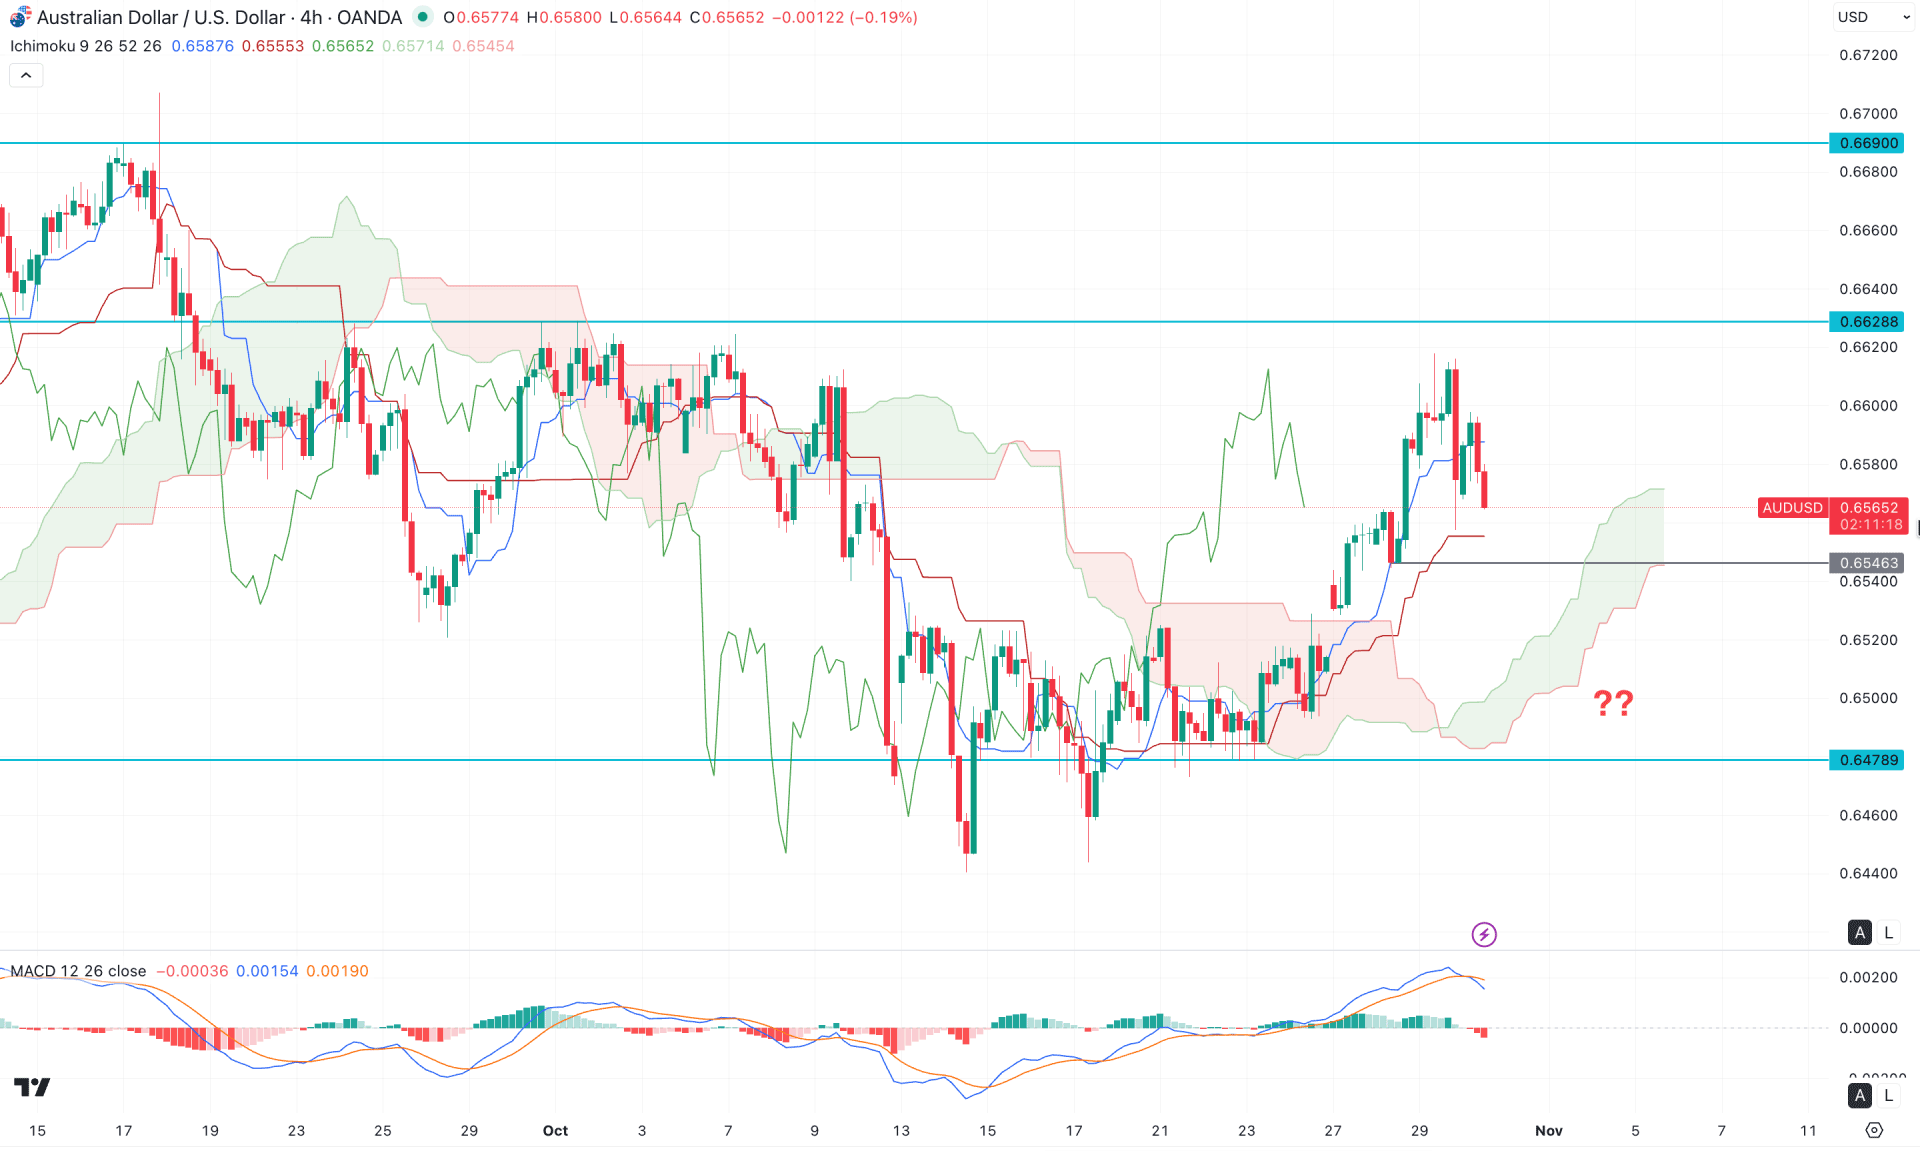
In the H4 timeframe, the recent price is trading above the dynamic Ichimoku Cloud zone, suggesting a bullish continuation momentum. Moreover, the future cloud looks positive, where both lines are heading upwards.
In the secondary indicator window, the MACD Histogram has flipped the position to the sellers zone, where the signal line has formed a bearish crossover.
Based on this outlook, a minor downside correction is pending, where the immediate support is located at the 0.6546 level. Primarily, a failure to form a bearish pressure below this line with an immediate bullish recovery could be a long opportunity, targeting the 0.6660 level.
On the other hand, an extended selling pressure below the 0.6500 level with a bearish H4 close might extend the loss and find support from the 0.6440 support level.
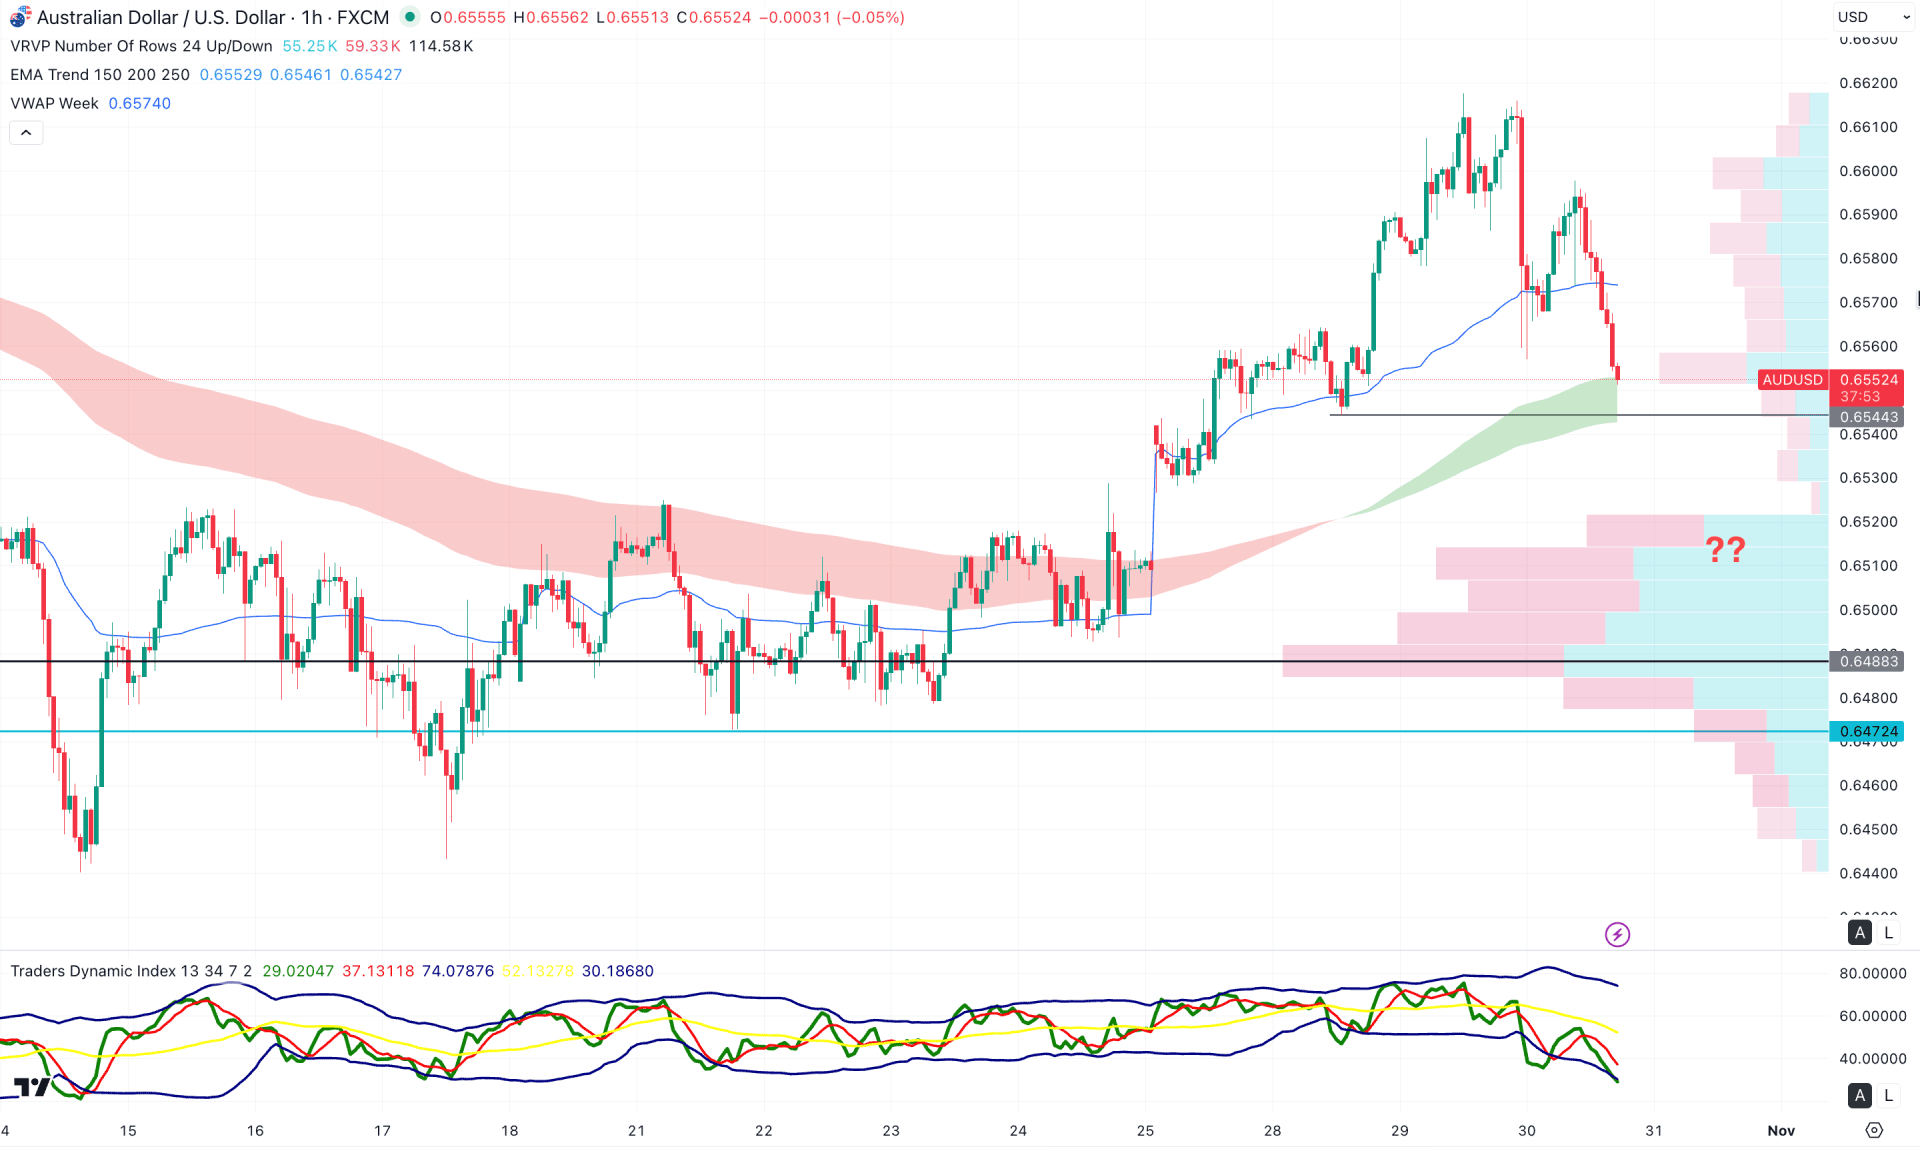
In the hourly timeframe, AUDUSD is trading bearish with an intraday selling pressure, where the recent price has formed an extended downside pressure below the Asian low. However, the intraday high volume line is at the 0.6488 level, which is way below the current price.
In the secondary indicator window, the Traders Dynamic Index (TDI) is hovering below the 50.00 neutral line, where the most recent line is at the lowest peak area.
Based on this outlook, an extended intraday selling pressure is possible where a break below the 0.6550 level might find support from the 0.6500 area.
On the other hand, any immediate bullish reversal with a valid price action above the weekly VWAP line could open a long opportunity.
Based on the overall market structure, the AUDUSD price is trading within a bullish trend where a minor downside recovery is pending in the intraday chart. Investors should closely monitor the hourly timeframe as a valid bottom formation could be an early long opportunity.


