
Published: February 20th, 2025
The Australian Bureau of Statistics reports that the economy created 44,000 new jobs, which is far more than the 20,000 predicted. As anticipated, the unemployment rate increased from 4% the previous month to 4.1%.
Expectations that the Reserve Bank of Australia (RBA) would continue to take a cautious approach to additional policy easing are further bolstered by the encouraging employment data. The RBA lowered the Official Cash Rate (OCR) by 25 basis points to 4.10% on Tuesday, its first interest rate decrease since November 2020. The RBA did, however, take a cautious approach to future rate decreases and stated that the battle against inflation is far from over.
On the other hand, the significant depreciation of the US dollar has also strengthened the Australian dollar. The US Initial Jobless Claims for the week ending February 14 were marginally higher than anticipated, which added to the pressure on the already weakening greenback earlier in the day. The projection of 215,000 new unemployment claims was surpassed by the 219,000 announced by the Department of Labor.
Let's see the further outlook from the AUDUSD technical analysis:
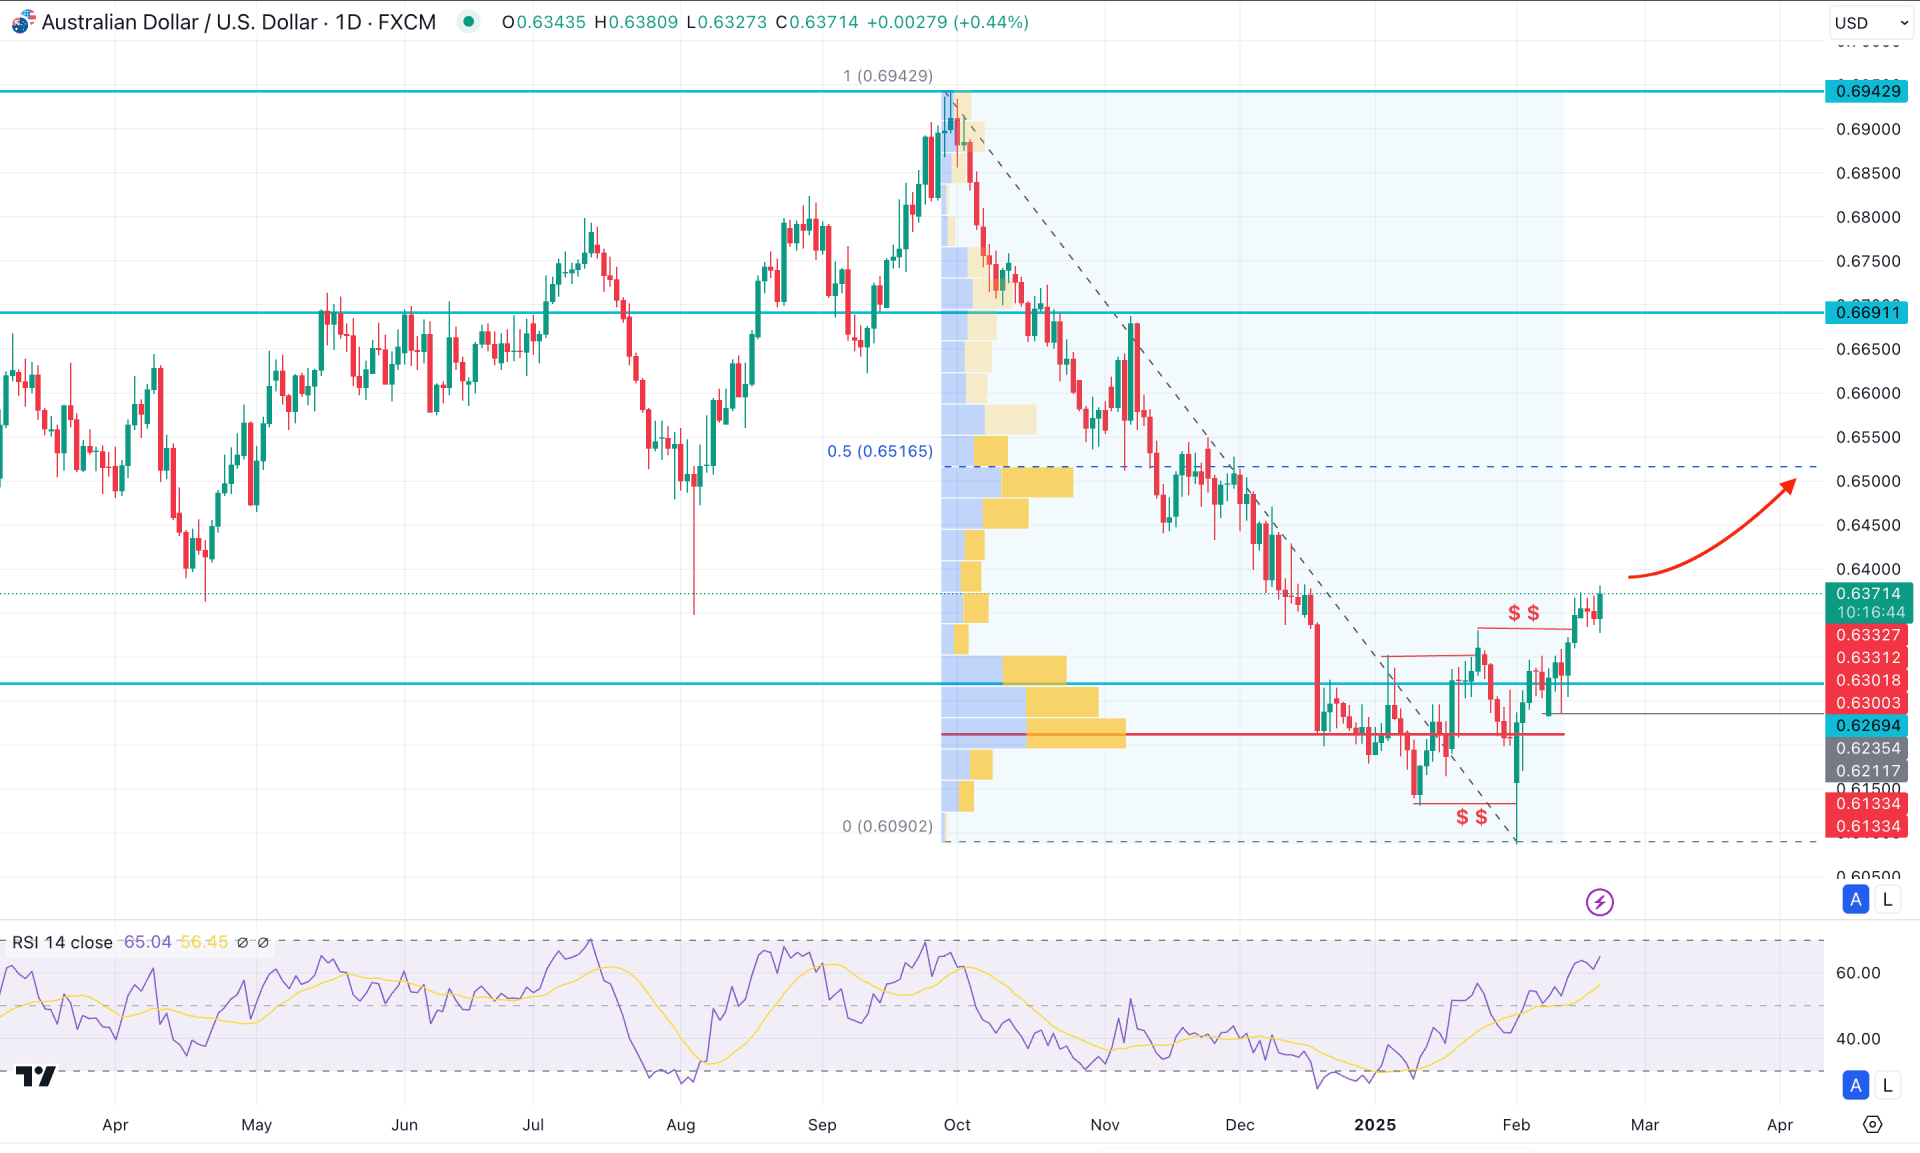
In the daily chart of AUDUSD, the recent price showed extended selling pressure, reaching the multi-year low area. However, the 12.32% loss from the 0.694 level has found a bottom, as the price provided enough signals of a bullish reversal.
In the higher timeframe, ongoing buying pressure is visible as the current monthly candle hovers above the existing Doji candlestick. Moreover, the weekly price represents a bullish rebound, as the recent price has been higher for three consecutive weeks.
The bearish reversal from the 0.6942 level has formed a bottom in the volume structure, as the recent high volume line is below the current price. As long as the daily price hovers above the high volume line, we may consider buyers' dominance in the market.
In the daily price, the bearish pressure below the 0.6133 low signaled a strong sell-side liquidity sweep before forming a new high above the 0.6330 level. It is a sign of enough liquidity grab perform forming a new higher high, which is a valid sign of a trend reversal. In that case, the price has as higher possibility of extending the upward pressure, above the 50% Fibonacci Retracement level from the Sep to Feb swing.
In the secondary indicator window, the Relative Strength Index (RSI) rebounded from the oversold condition and formed a stable momentum above the 50.00 neutral area.
Based on the current market outlook, AUDUSD may extend the bullish pressure. The primary aim of this pair is to test the 0.6516 level, which is a crucial Fibonacci Retracement level.
However, the buying pressure is valid as long as the price trades above the 0.6211 high volume line. A minor downside recovery is possible from the current price, but any extended selling pressure below the 0.6200 level could increase the short-term opportunity.
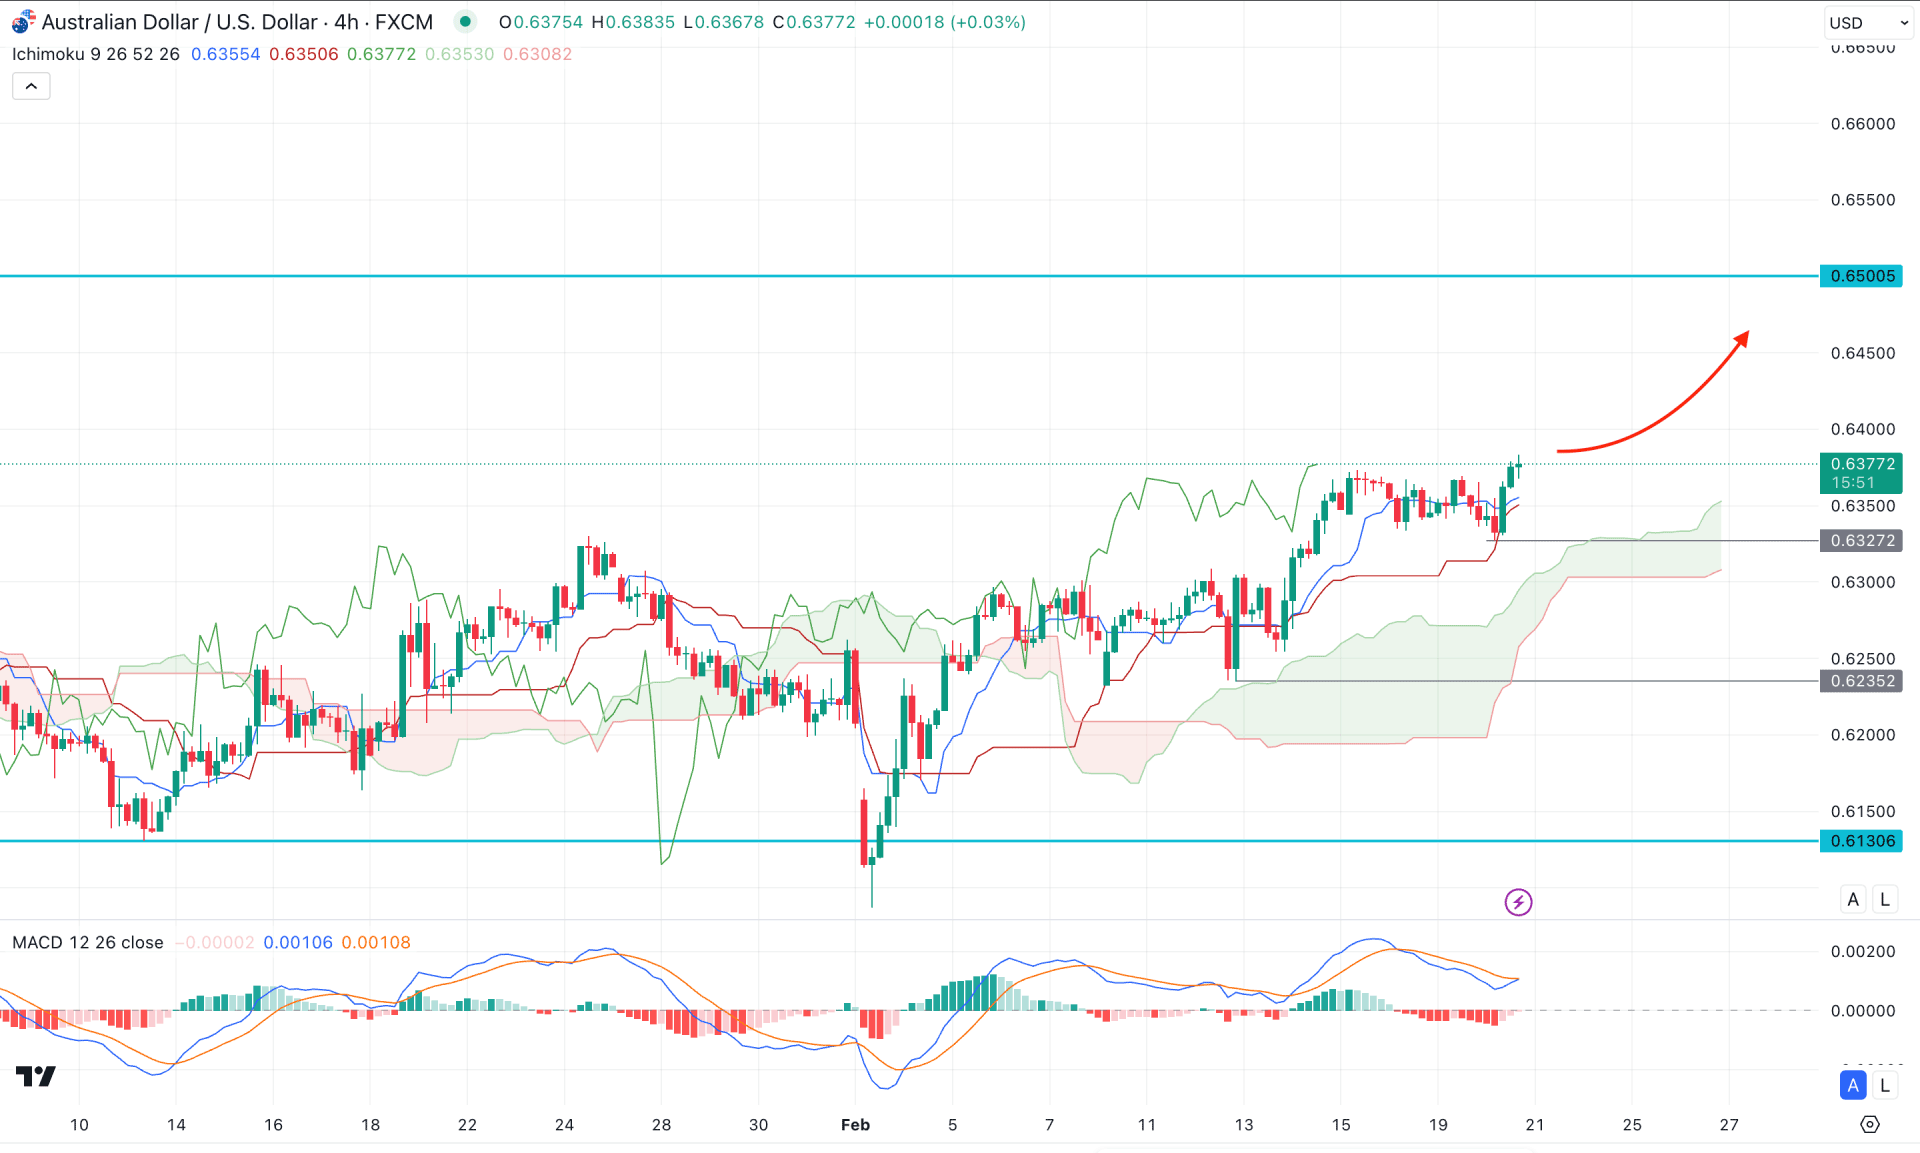
In the H4 timeframe, the bullish momentum is clear as the recent price showed a bullish V-shaped recovery with a rebound above the Cloud support.
In the Futures Cloud, the Senkou Span A and B aimed higher with a bullish slope, suggesting a valid bullish trend continuation. Moreover, the dynamic Kijun Sen support is below the current price, supporting the bullish momentum.
In the indicator window, the negative MACD Histogram is losing momentum and has reached the neutral point. Moreover, the signal line remains at the bullish zone, where an additional bullish crossover is visible.
Based on the H4 market outlook, the price has a higher possibility of continuing the upward pressure in the coming hours. In this context, the immediate support level is marked at the 0.6327 level. A selling pressure below this line could result in cloud support being a secondary bullish approach. In both cases, the primary aim would be to test the 0.6500 key psychological line before moving beyond the 0.6650 high. On the other hand, a failure to hold the price above the 0.6235 low would eliminate the bullish opportunity and lower the price below the 0.6130 low.
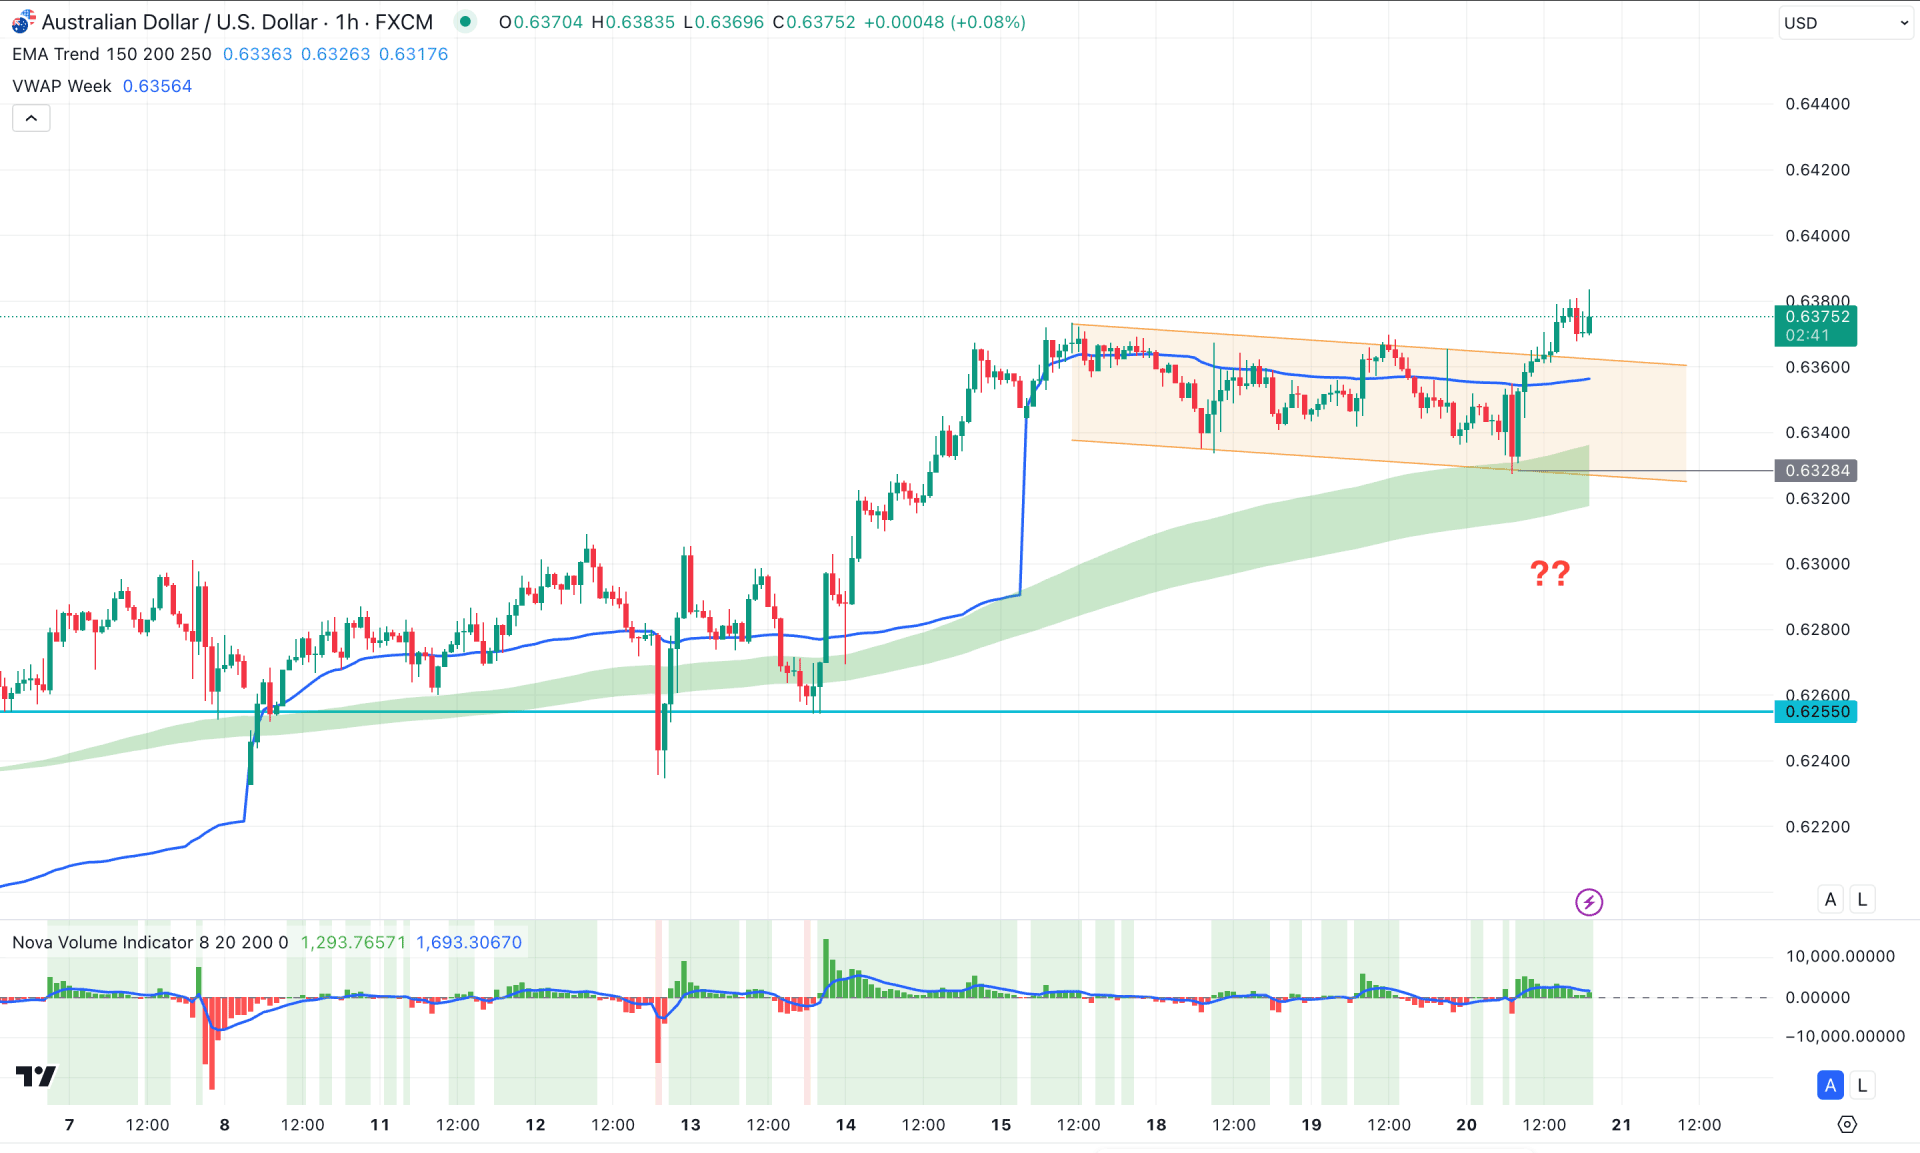
In the hourly time frame, the price is trading within a bullish trend, where a descending channel breakout acts as a confluence of bullish pressure. Moreover, the Moving Average Wave, along with the weekly VWAP line, is acting as major support. As long as the price hovers above these crucial dynamic lines, we may expect the intraday price to push higher.
On the other hand, the volume histogram remains sidelined and fails to hold positive momentum. As per the volume structure, the price is more likely to aim lower and form a bottom before extending the ongoing market trend.
Based on the hourly outlook, investors should monitor how the price forms a downside correction. Any bullish rebound from the channel support could be a highly probable long opportunity. However, an extended selling pressure before the Moving Average low might lower the price in the coming hours.
Based on this outlook, AUDUSD is more likely to extend the bullish pressure in the coming days. Investors should closely monitor how the price retraces to the near-term bullish order block to offer a bullish re-entry.


