
Published: September 27th, 2023
Despite Australia's robust inflation data, the Australian Dollar (AUD) is nearing its monthly low versus the US Dollar. Due to prevailing risk aversion, the AUD/USD pair failed to capitalize on positive Australian Consumer Price Index (CPI) figures. In addition, a decline in commodity prices restricts the AUD's potential for growth.
The Reserve Bank of Australia (RBA) released the minutes, which indicated that further tightening may be required if inflation proves to be more persistent than anticipated. If they are elevated, inflation levels could affect the RBA's judgment regarding the ongoing rate-hike cycle.
The US Dollar Index (DXY) is trading close to its highest level since December, aided by robust US Treasury yields. The yield on 10-year US Treasury bonds has reached levels not seen since October 2007.
Recent moderate economic data from the United States (US) released on Tuesday may add to the dollar's strength. The US Housing Price Index increased, while Consumer Confidence and Building Permits fell.
Moreover, most members of the US Federal Reserve (Fed) continue to anticipate additional interest rate increases later in the year, reflecting robust US economic growth. The Federal Reserve recently resolved to maintain the interest rate within the range of 5.25 percent to 5.50 percent, thereby preserving the status quo.
Let’s see the upcoming price direction from the AUDUSD technical analysis:
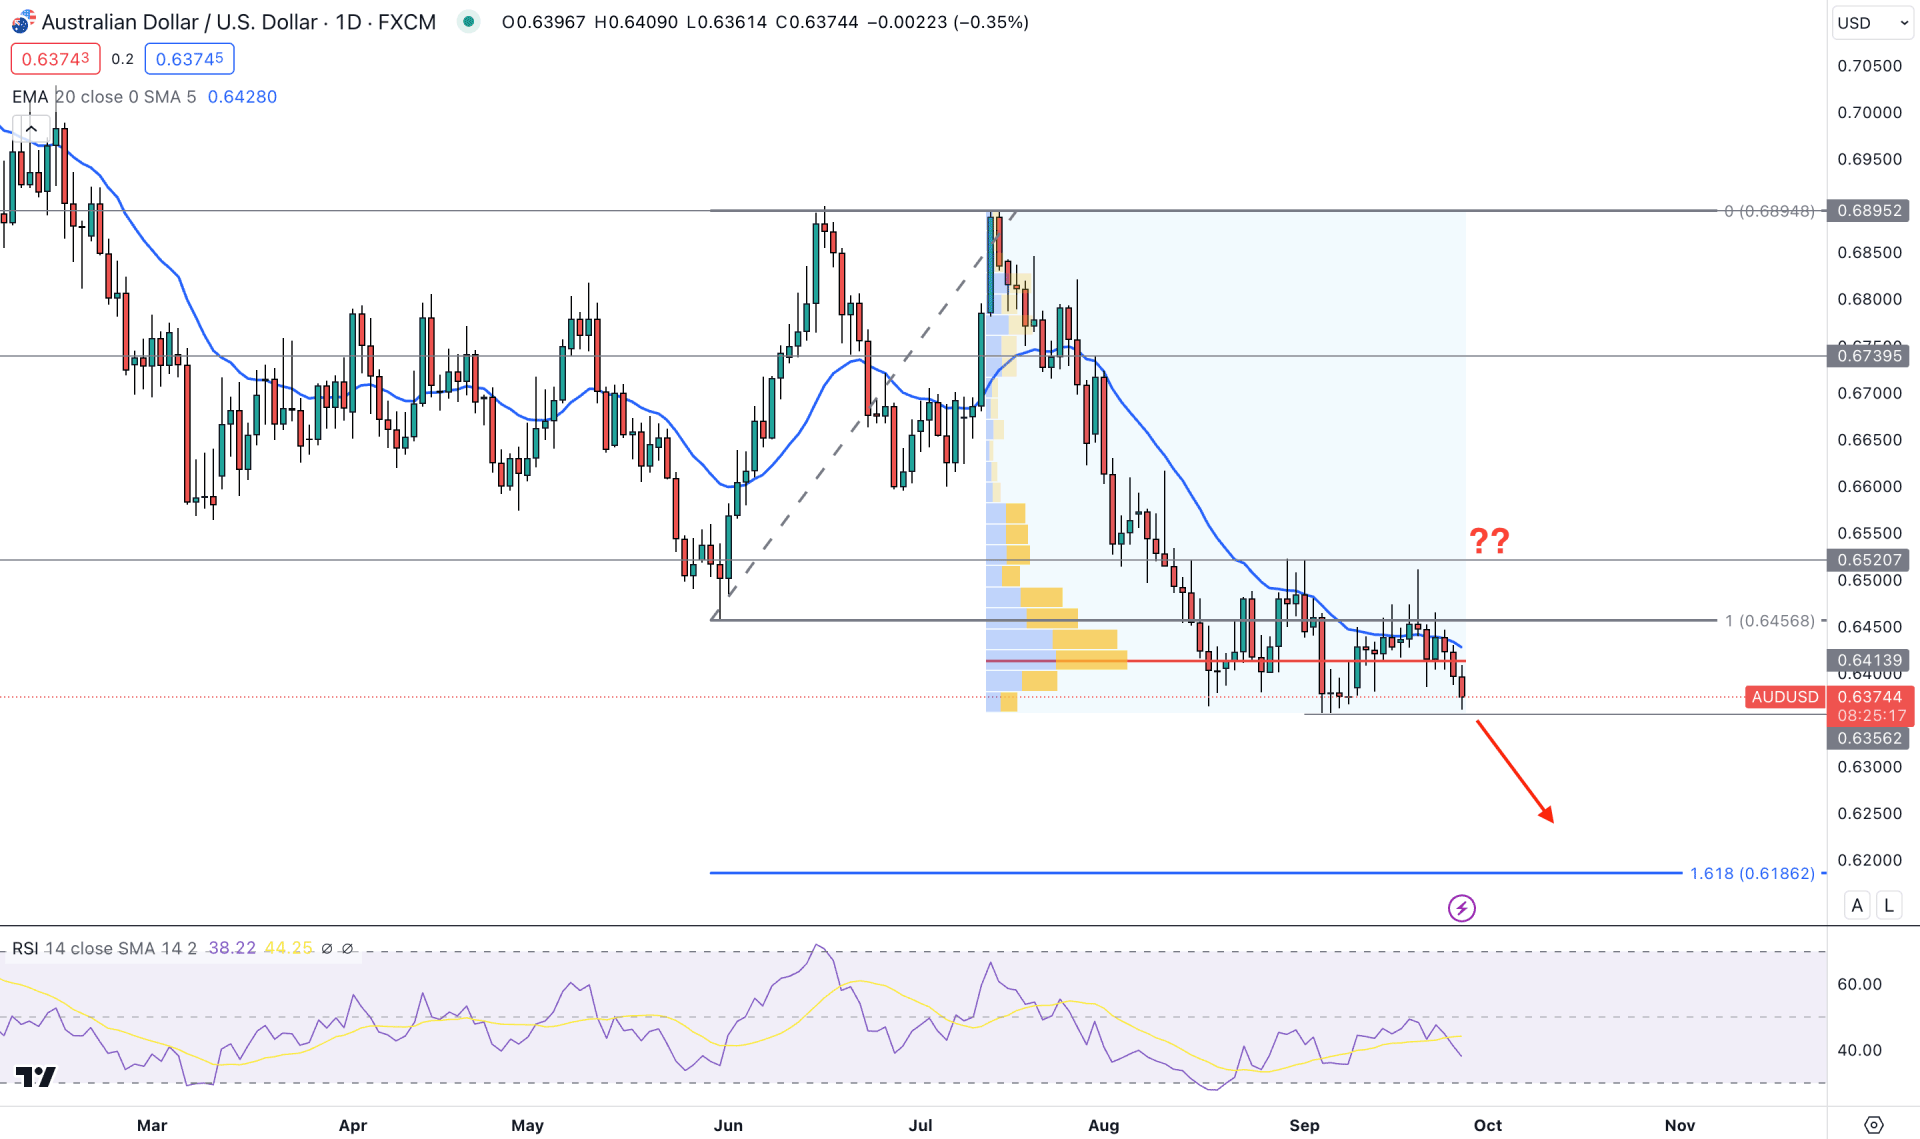
In the daily chart, AUDUSD trades within a strong downside pressure, where the current momentum is experiencing a redistribution phase. However, a wide trading range is visible, which could offer a decent trend trading opportunity after a valid breakout.
In the monthly candlestick analysis, the price trades at the July 2023 low, backed by two consecutive bearish candles. In that case, a bearish trend continuation is possible if the price holds the bearish pressure below the previous monthly low. Moreover, the weekly price shows a consolidation, from where a bearish continuation could offer an impulsive bearish opportunity.
On the other hand, the existing consolidation is below the 0.6456 swing low, which indicates a possible bearish manipulation. However, the manipulation and bullish accumulation need to be confirmed with a valid break above the 0.6520 level.
In the volume structure, a decent order building phase is visible as the current price is closer to the 0.6413 high volume level. Based on the volume structure, we may expect a decent trend trading opportunity if the price moves beyond the range.
In the daily price, the dynamic 20-day EMA is working as a major resistance from where a bearish daily candle came. Moreover, the Relative Strength Index (RSI) shows a bearish possibility as it remains below the 50.00 neutral line.
In the current daily structure of AUDUSD, a bullish opportunity might come after a valid breakout and a daily close above the 0.6520 level. However, the 161.8% Fibonacci Extension level from 0.6456 high to 0.6895 level is at 0.6186 level, which could be the extreme level for another bullish opportunity.
As of now, a bearish pressure could come if the daily candle can close below the 0.6356 low, targeting the 0.6200 level.
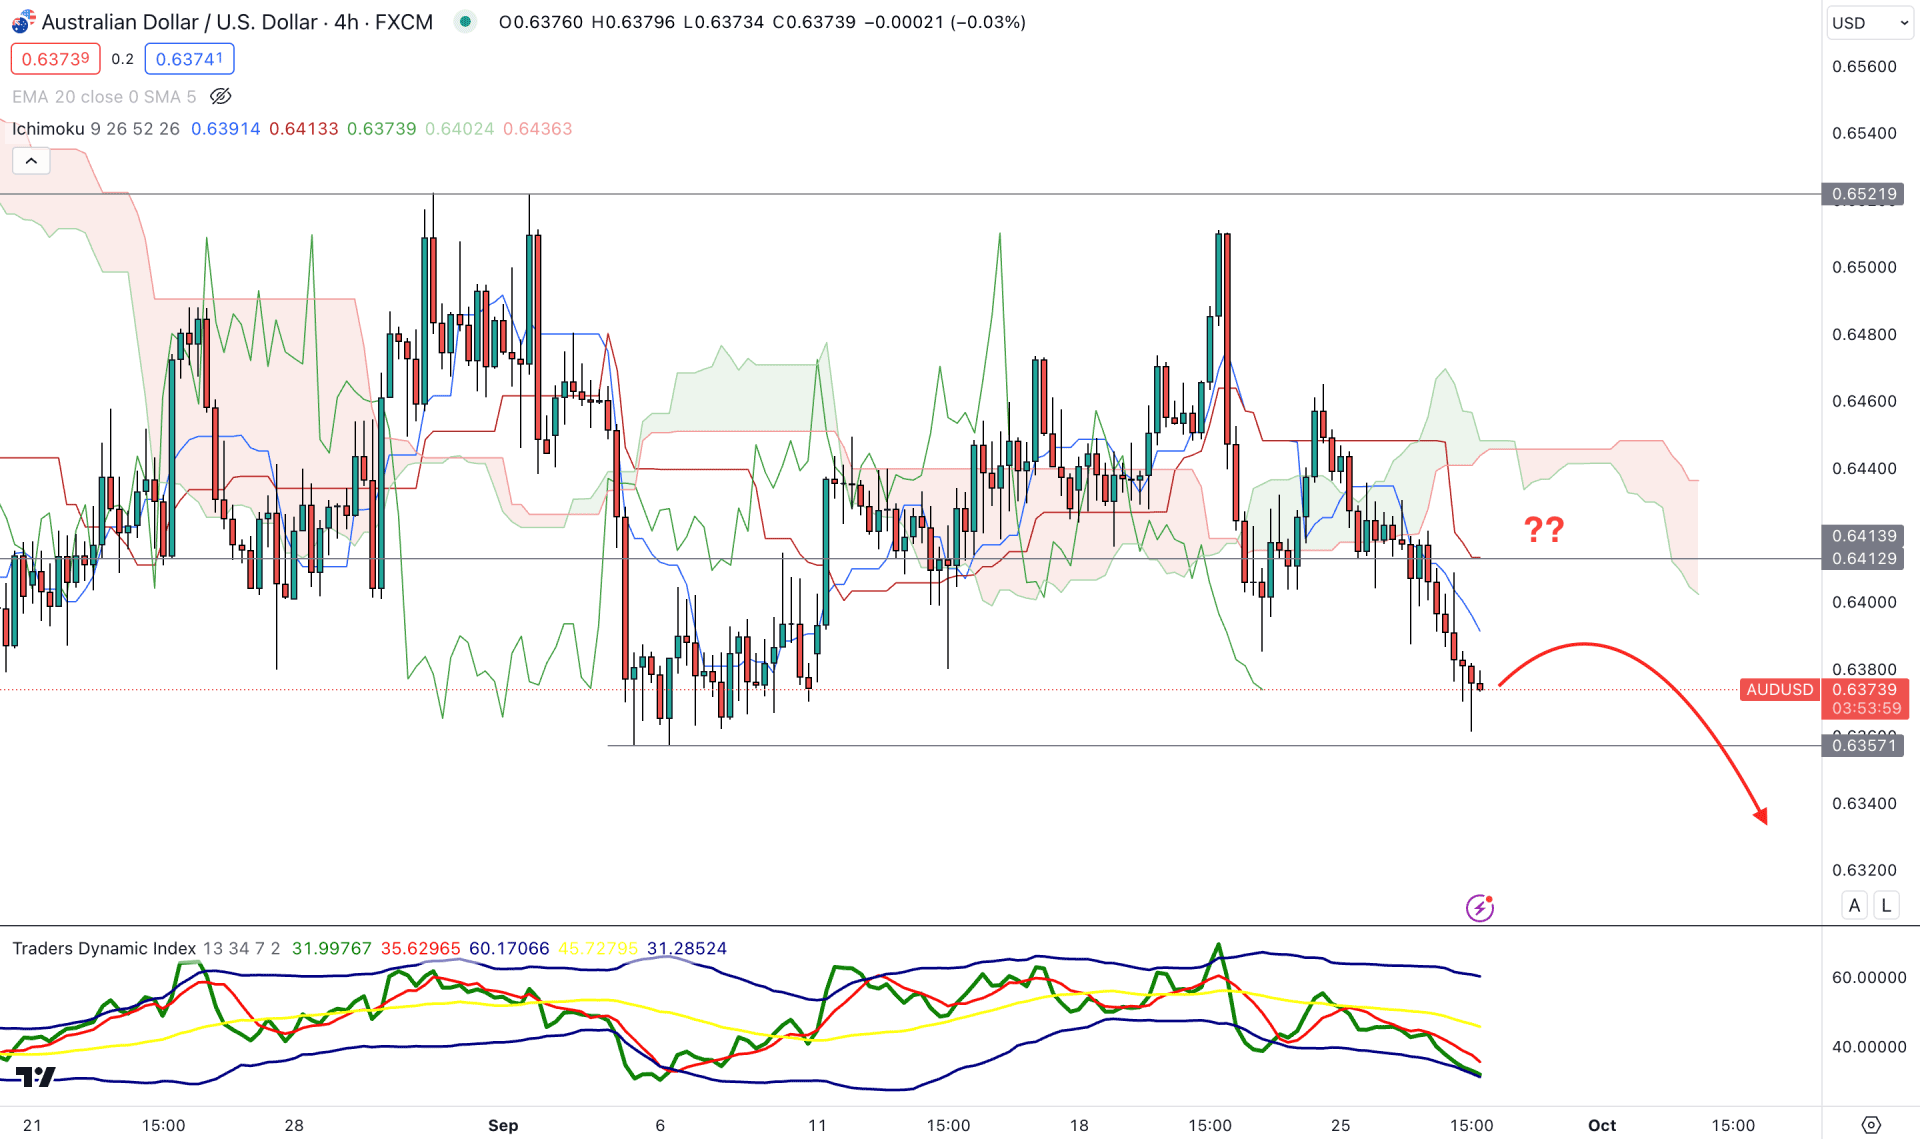
In the H4 timeframe, the overall market pressure is bearish as the current price trades below the Ichimoku Cloud zone. Moreover, the Senkou Span A and B are moving down, which could signal a strong sellers’ presence in the market.
A possible bottom might be formed in the indicator window as the current TDI level is overbought. Moreover, the 0.6357 near-term support level could be the confluence support to the bottom formation.
Based on the H4 structure, a bearish trend continuation needs a minor recovery and a rejection candlestick from the dynamic Kijun Sen resistance, which could lower the price towards the 0.6320 level.
On the other hand, a buying pressure with an H4 candle above the 0.6440 level could invalidate the downside possibility and increase the price towards the 0.6521 liquidity zone.
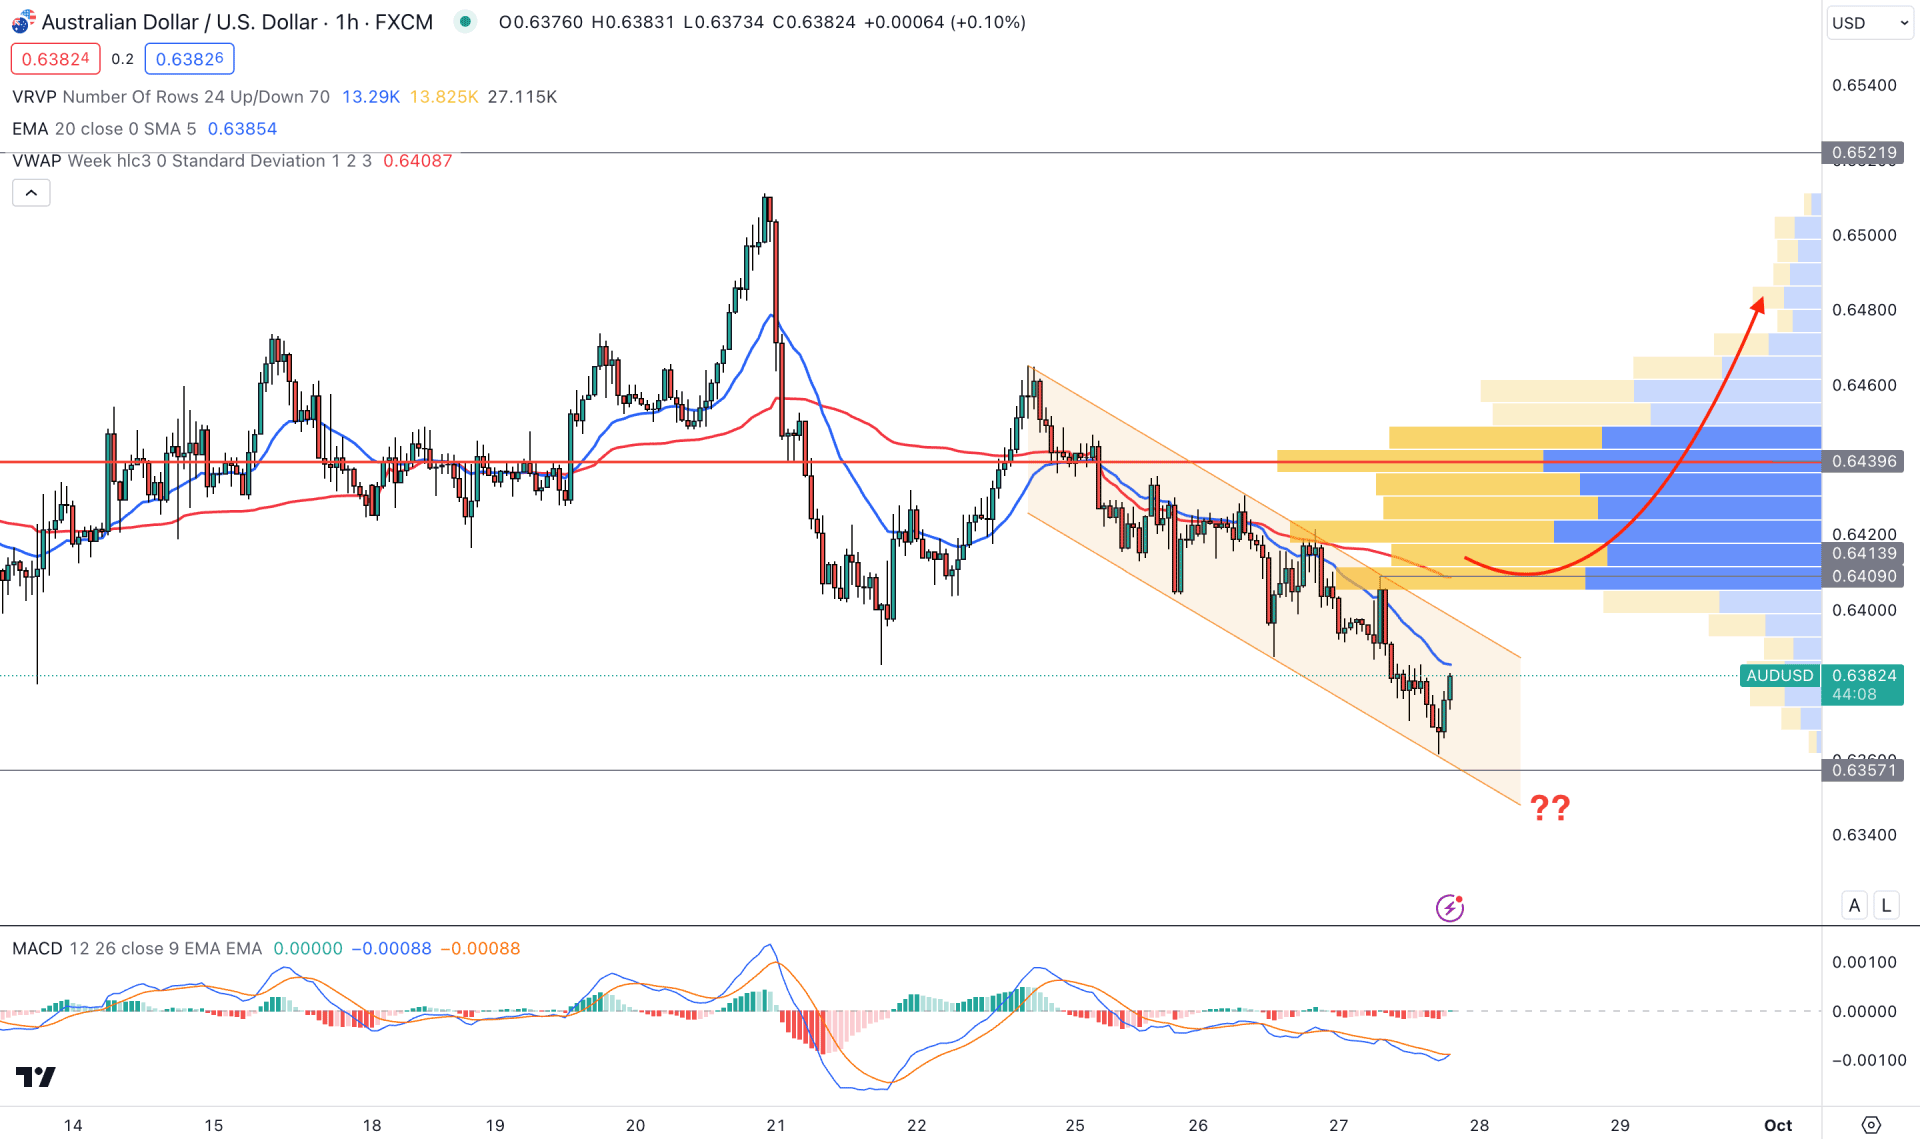
In the H1 timeframe, the current price is trading within a descending channel, where a bullish channel breakout could be the first sign of a bullish trend. However, the visible range high volume level is above the current price, which could be a strong barrier to sellers.
In the indicator window, a possible bottom has formed as the MACD Signal lines showed a bullish crossover at the oversold zone.
Based on this structure, a strong upside pressure with an H1 close above the dynamic VWAP level could indicate the first sign of a bullish reversal, targeting the 0.6500 level. On the other hand, the near-term support of the 0.6357 level could be a strong support level, as a break below this line could lower the price towards the 0.6300 level.
Based on the current market structure, the overall market direction is corrective from where a strong breakout is needed before forming a stable trend. As the existing market trend is bearish, a bearish breakout could be potent, which may come after a solid top formation in the intraday chart.


