
Published: March 13th, 2024
Strong US inflation data that clouded the Federal Reserve's chances of a rate cut kept the Australian dollar stuck at the 0.66 area. Support for the Australian dollar yet endures because markets believe the Fed will move sooner than other major central banks.
Australia's economy grew less than anticipated in the fourth quarter, which fueled rumors that the Reserve Bank of Australia will start cutting interest rates this year. The markets currently project a 90% chance that the RBA will begin reducing rates in August, with a 45 basis point annual average decrease anticipated.
The Commonwealth Bank of Australia reiterated its prediction of a total cut of 75 basis points in interest rates for the year in response to the dismal GDP results.
On the other hand, the US Consumer Price Index (CPI) increased sharply in February, beating estimates and pointing to ongoing inflationary pressures. Although the CPI increased by 0.4% as predicted, the 3.2% year-over-year growth was marginally higher than the 3.1% increase predicted.
Because of this, experts are speculating whether the Fed will have enough information to support more than a few rate reductions this year. According to the CME Group's FedWatch Tool, market expectations for rate cuts beginning at the Fed's June meeting dropped to about a 67% probability.
Let's see the further outlook of this pair from the AUDUSD technical analysis:
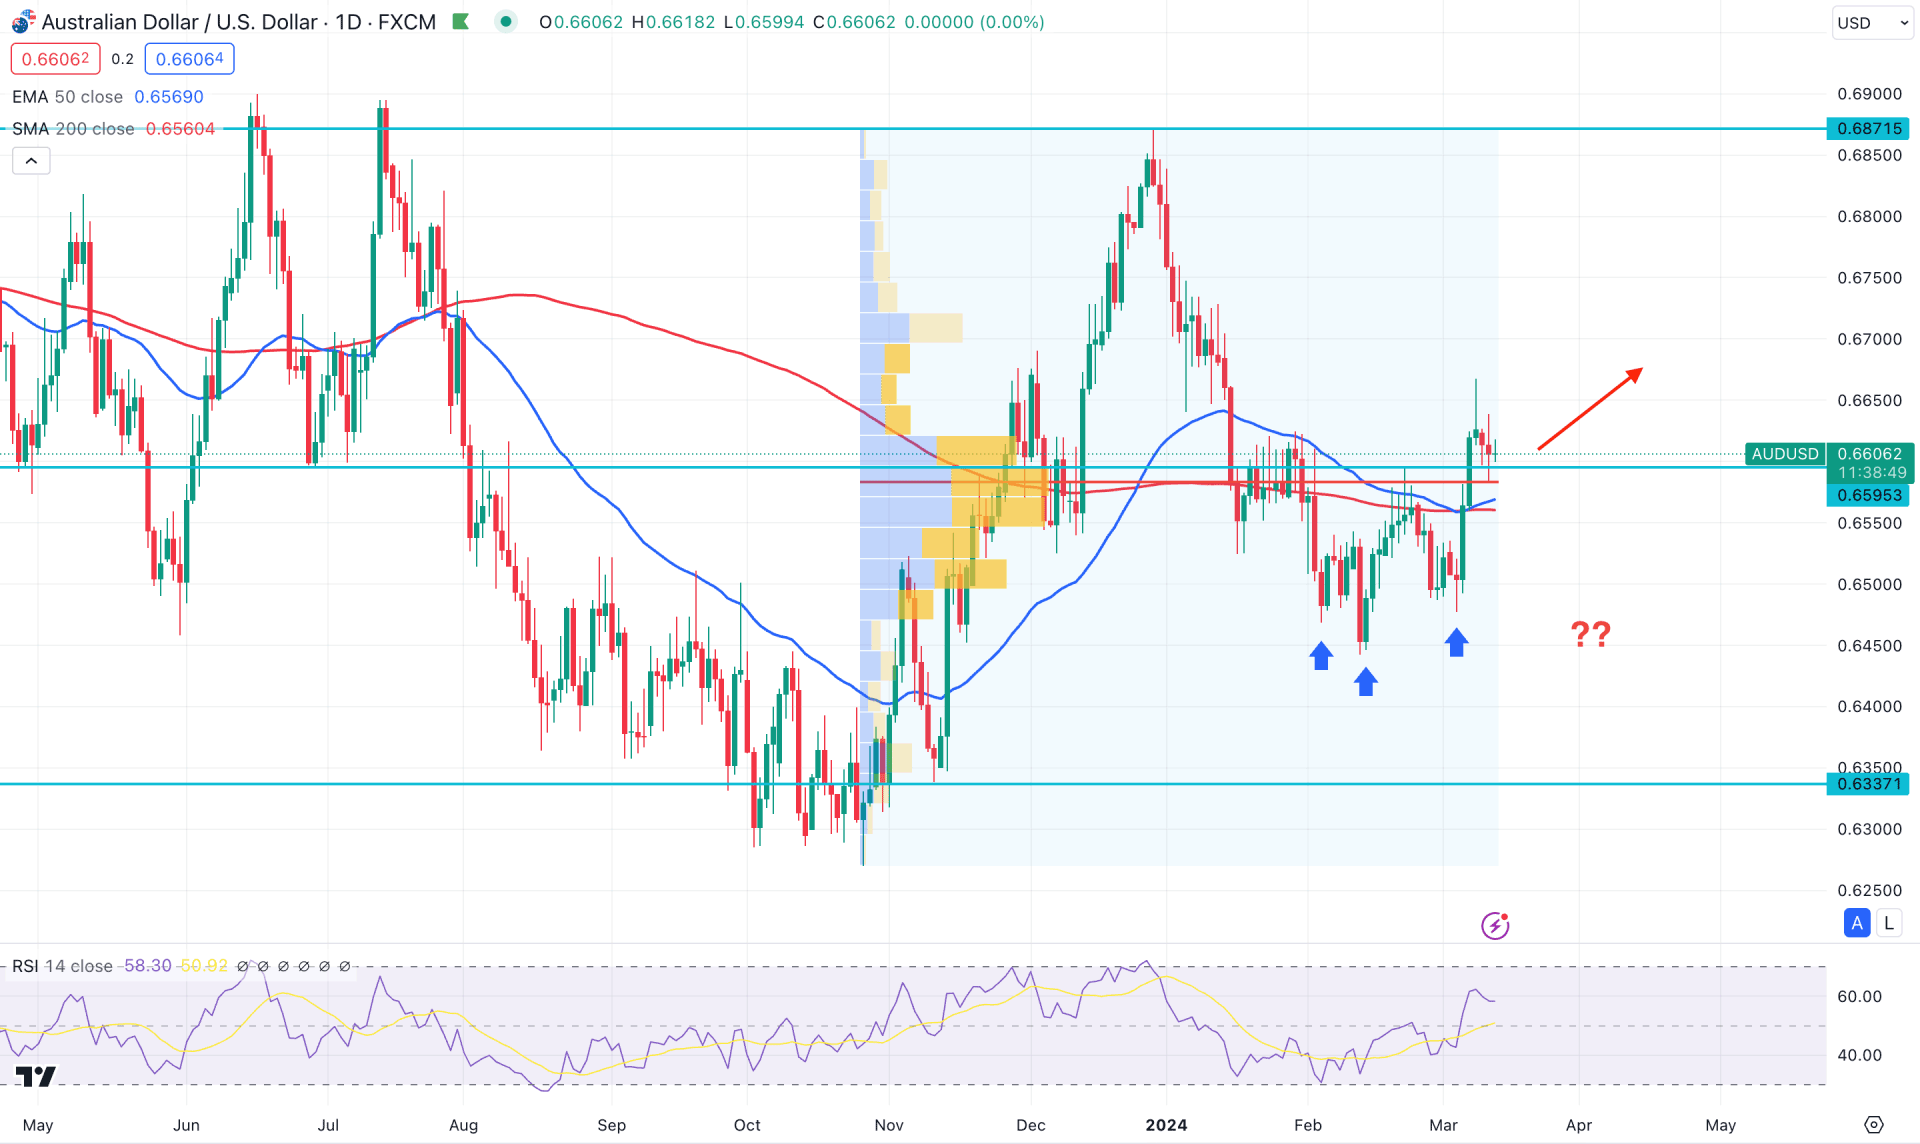
In the daily chart of AUDUSD, the overall market structure is corrective. However, the latest price action suggests a possible upward pressure as it trades above the dynamic support level.
In the higher timeframe, an upward pressure is potent as the current monthly candle trades higher than last month's high. However, as the monthly candle is still running, closer attention is needed towards the weekly price.
The running weekly candle suggests a bullish continuation opportunity as it trades higher from the bullish engulfing candle pattern.
Moreover, the volume structure looks supportive to bulls as the most active level since October 2023 is at 0.6583 level, which is below the current price. As long as the current price trades above this high volume level, we may expect bulls to regain the momentum.
In the daily chart, a potential bullish reversal is visible from the Inverse Head and Shoulder pattern breakout, where the neckline is at the 0.6593 level. As the current price trades above this neckline support, a bullish trend continuation is potent but needs more confirmation from other tools.
On the other hand, the ongoing price action suggests a bullish continuation signal from the Golden Cross continuation pattern. Moreover, the 14-day Relative Strength Index remains above the 50.00 line, which suggests a bullish continuation signal.
Based on the daily outlook of AUDUSD, the current price trades above the crucial static support of 0.6559 level. Therefore, a bullish rejection from the dynamic 50 EMA line could be a valid long opportunity in this pair, targeting the 0.6871 level.
On the bearish side, investors should monitor how the price reacts on the 0.6500 psychological line as a bearish daily close below this level could lower the price towards the 0.6300 level.
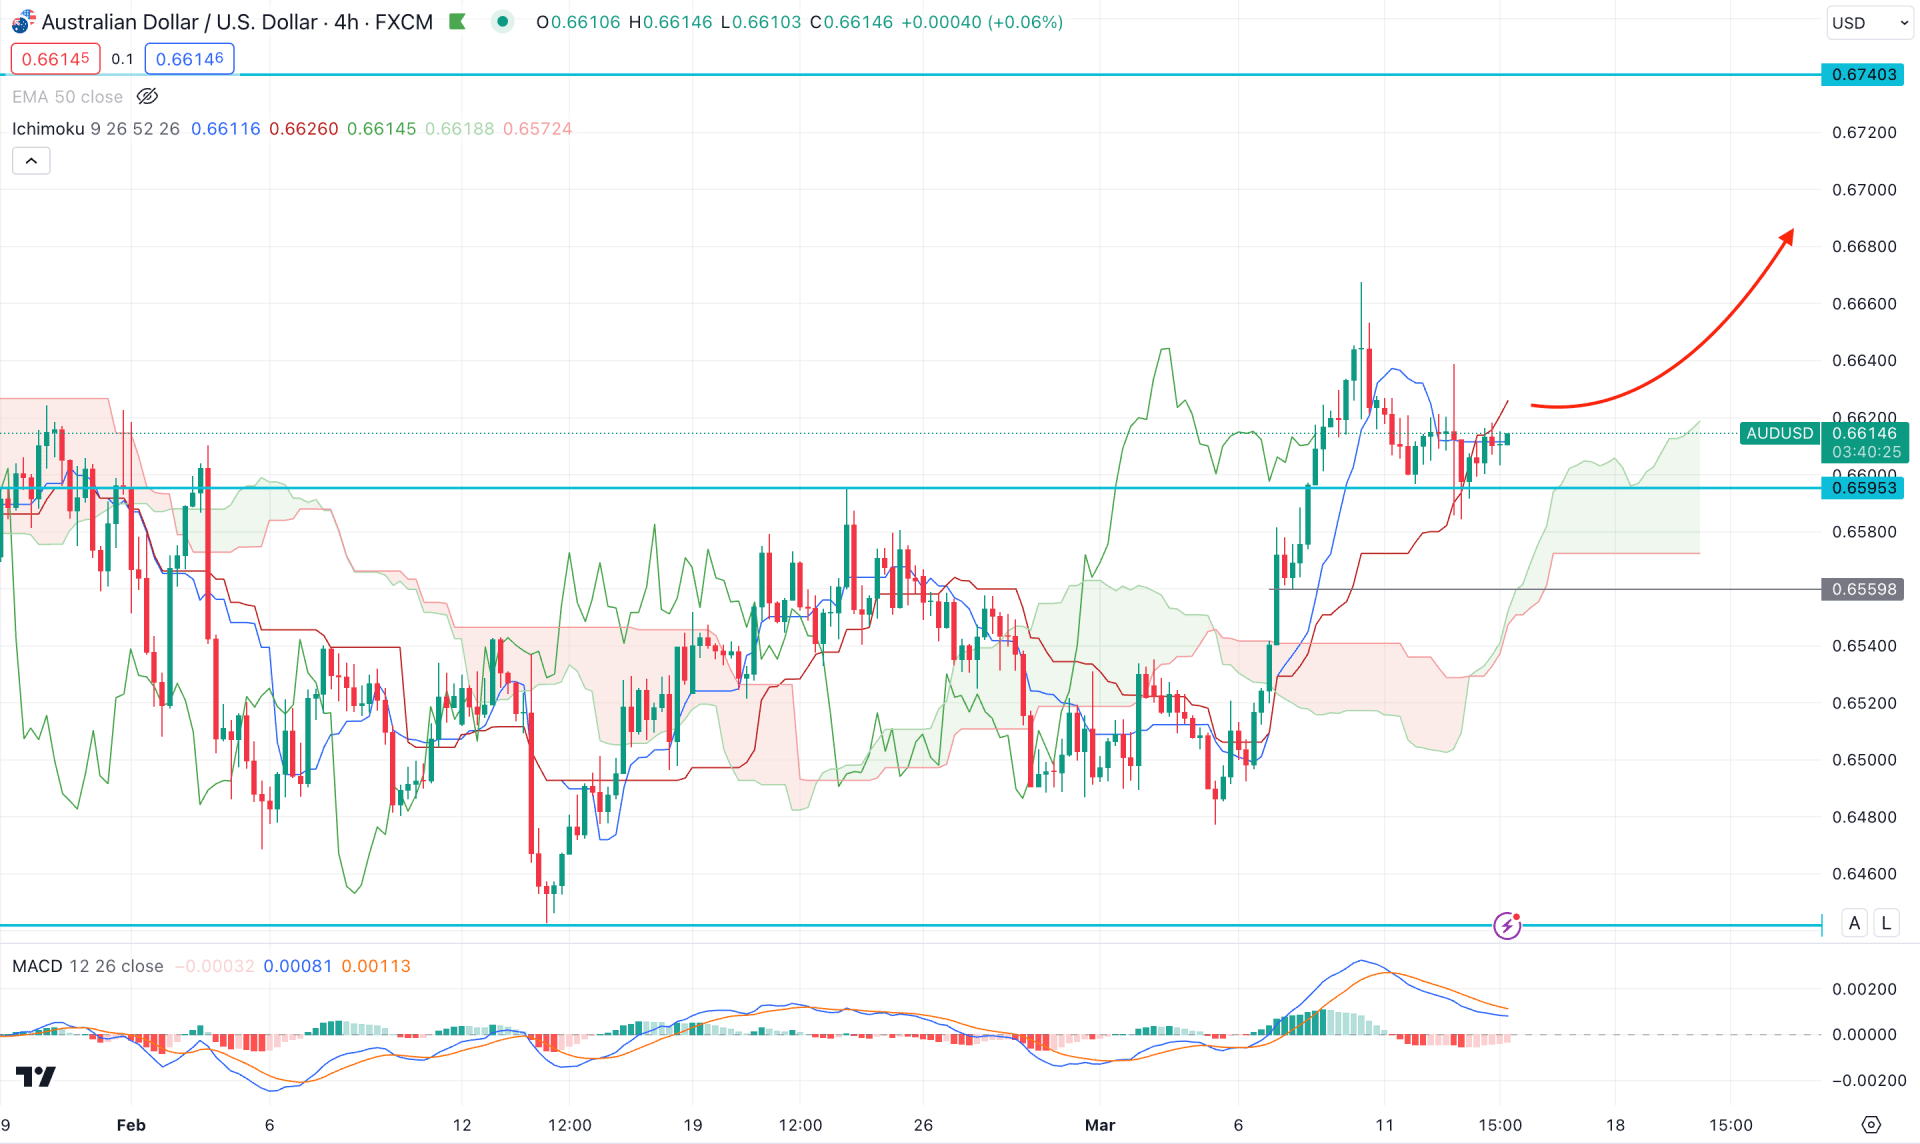
In the H4 timeframe, the overall market pressure is bullish as the recent price formed a bullish breakout above the cloud zone with a daily close. Moreover, the most recent price stalls above the cloud support, which increased the possibility of a bullish continuation.
In the indicator window, the current MACD Histogram suggests a bearish pressure, where the most recent reading reached the neutral zone. Moreover, the signal line remains bullish, suggesting a possible trend continuation.
Based on this outlook, a bullish rejection from the current dynamic Kijun Sen line could be an aggressive bullish continuation signal targeting the 0.6740 resistance level.
The alternative approach is the look for a bearish opportunity after having a daily close below the 0.6550 level, which might alter the current market outlook.
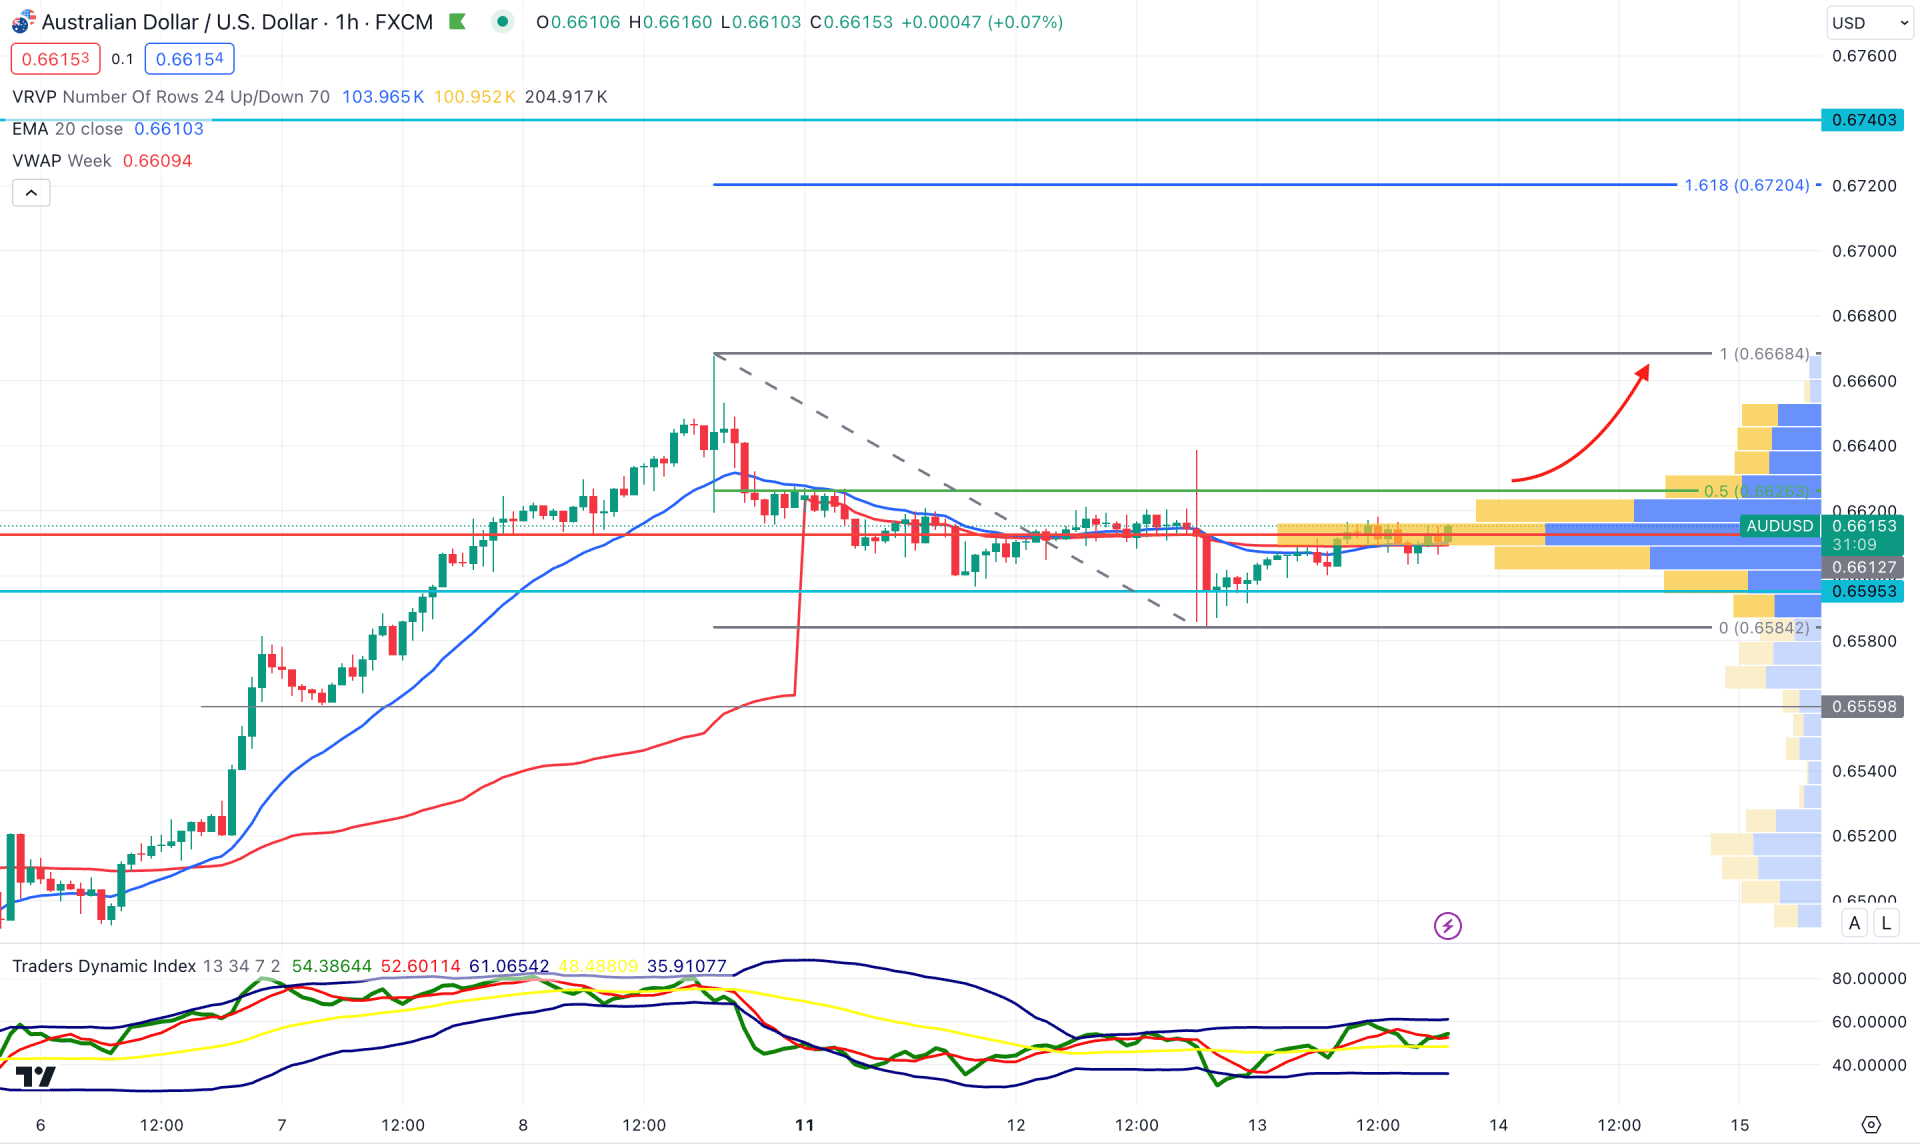
In the hourly chart of AUDUSD, the overall market pressure is bullish as the current price trades sideways after an impulsive wave. Moreover, the visible range high volume level is at the current price area, from where a breakout is possible.
In the secondary window, the Trades Dynamic Index suggests a buying pressure as the current level hovers above the 50.00 satisfactory line.
Based on this outlook, a bullish breakout with an hourly close above the 0.6626 level could be a valid long opportunity in this pair. However, a deeper correction is possible towards the 0.6584 level, but more selling pressure with an H4 candle below the 0.6584 level might alter the current market outlook at any time.
Based on the current market structure, AUSUDSD has a higher possibility of extending the current buying pressure in the coming days. Investors should closely monitor how the price reacts on the Inverse Head and Shoulders neckline to find a high probable long opportunity.


