
Published: December 8th, 2022
Australian Trade Balance came at 12,217M in October vs. the expected 1,155M and formerly 12,444 M. Further details suggest that exports and imports declined by 1.0% vs. expectations of increasing 2.0% and 1.0%.
In addition, the Reserve Bank of Australia's (RBA) quarterly Bulletin failed to deliver any clear direction to AUDUSD traders. It highlights education's importance while praising the economic transition due to Covid-linked restrictions easing.
Despite that data, mixed geopolitical front clues appear to restrict the immediate move for the AUD/USD pair. The reason could be linked to Olaf Scholz, the German Chancellor’s comment, and the threat from Vladimir Putin, the Russian President suggesting unloose risk for using nuclear weapons from Moscow.
Otherwise, the gradual easing of the Zero-Covid policy from China declares a passive reopening and fights to impress bulls.
Through this play, future stocks soften losses and US Treasury yields lick their wounds by the press time. For the coming trading days, the movement mostly depends on the policy-driven blackout of the Fed officials ahead of FOMC next week. However, the initial jobless claims for the U.S. is expected to increase by 230K vs. the prior 225K during the week finished on December 2, which may please traders.
Let’s see the upcoming price direction of Australian Dollar to US Dollar from the AUDUSD technical analysis:
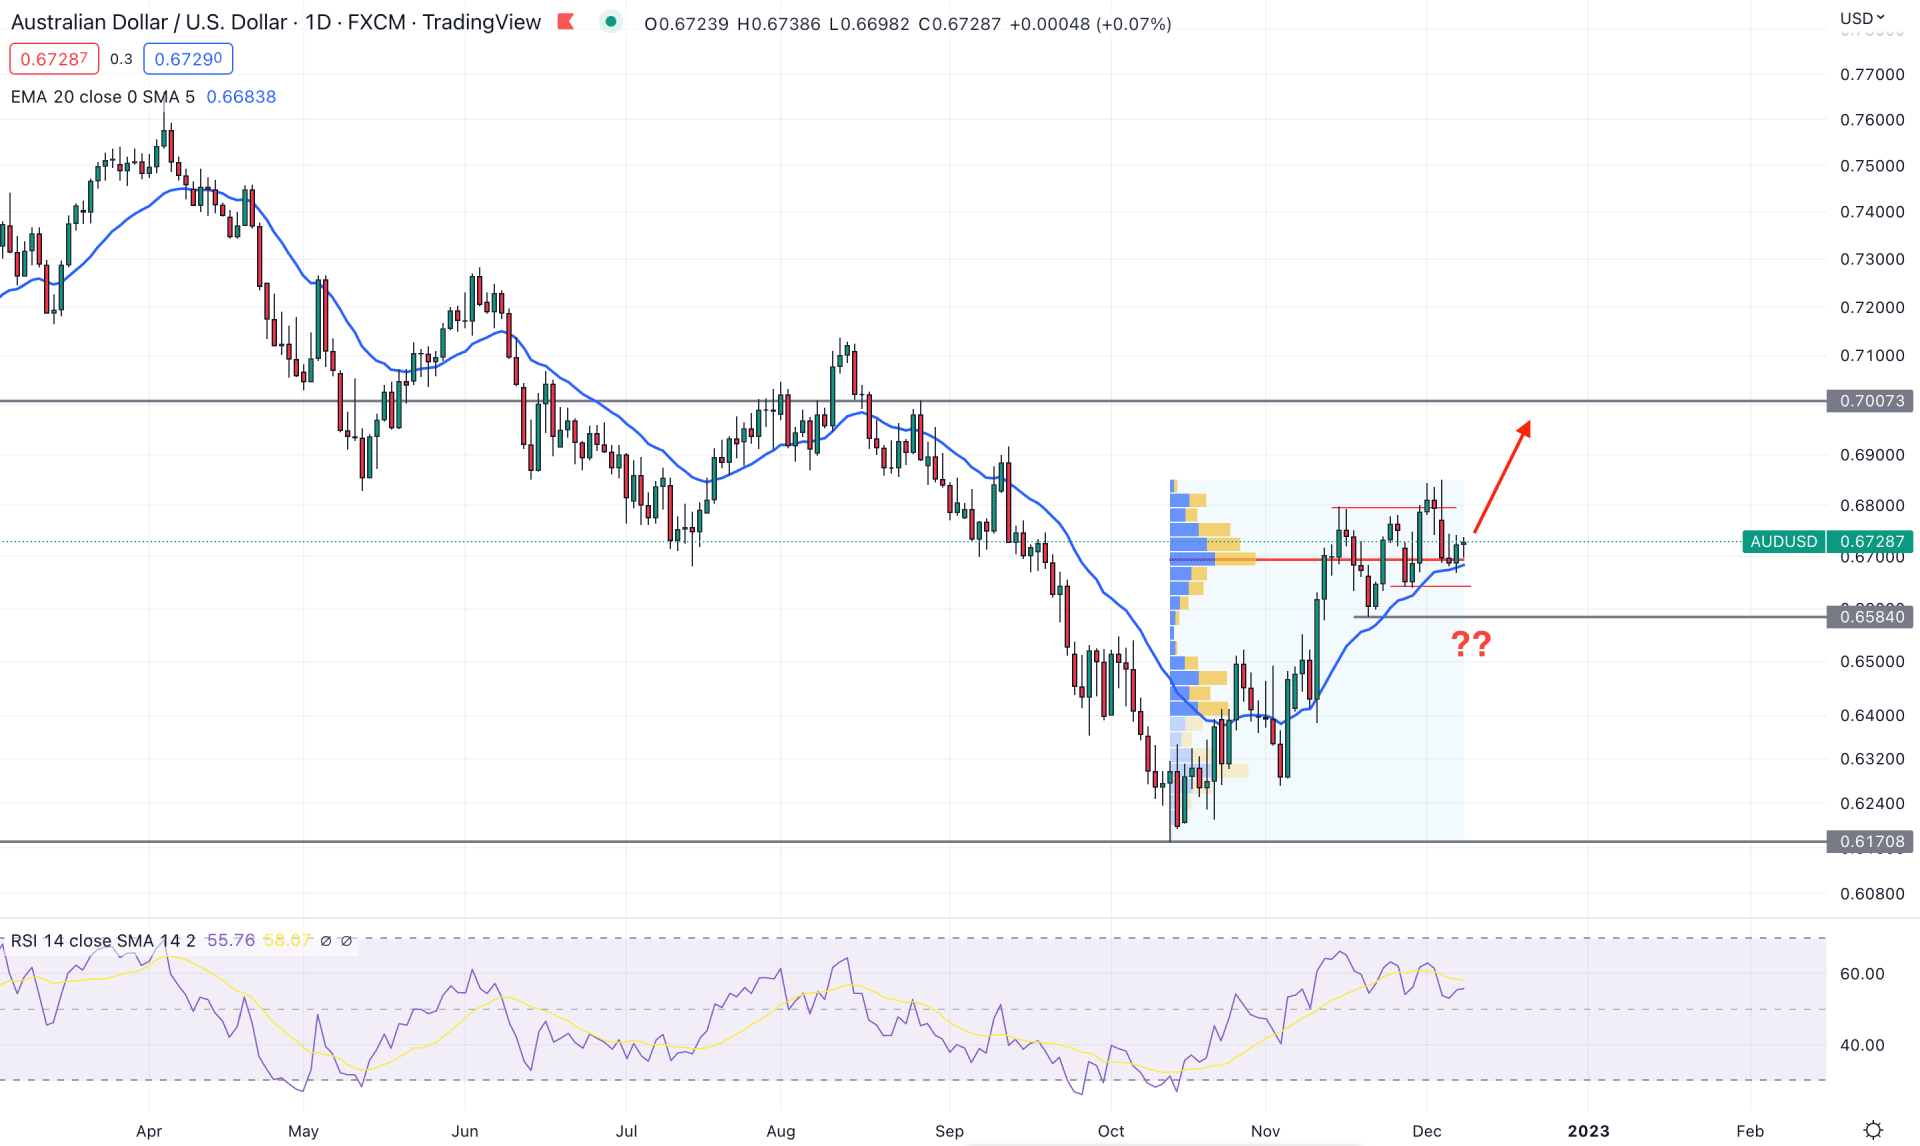
In the daily chart, the AUDUSD price is training within a bullish trend eliminating the Covid-19-driven selling pressure that made a valid bottom at the 0.6170 level.
In the latest price action, the buying pressure from the 0.6584 level came with a bullish Quasimodo formation, which made it a valid bottom. On the upside, the 0.6912 level is the valid swing point to consider as a top-of-the-range as it appeared with a buy-side liquidity grab.
The upside pressure is also potent as the buying pressure from the 0.6584 level came by creating multiple demand formations, backed by a bullish break of structure at the 0.6793 level. Therefore, as long as the current price is trading above the 0.6584 level, the primary outlook of this instrument will be bullish.
Based on the high volume indicator, the maximum trading volume from November high to low is spotted at 0.6693 level, which is working as confluence support to the dynamic 20-day Exponential Moving Average.
Moreover, the Relative Strength Index (RSI) is holding the bullish momentum above the 50% neutral level, with a possibility of testing the 70% level.
Based on the current market outlook, a bullish pressure in AUDUSD is potent as a bullish daily candle appeared, rejecting the 0.6693 level. Therefore, any bullish intraday trend trading opportunity could trigger the buying momentum by taking the price towards the 0.7000 area.
On the other hand, breaking below the 0.6580 level would eliminate the bullish possibility and open a short opportunity, targeting the 0.6170 level.
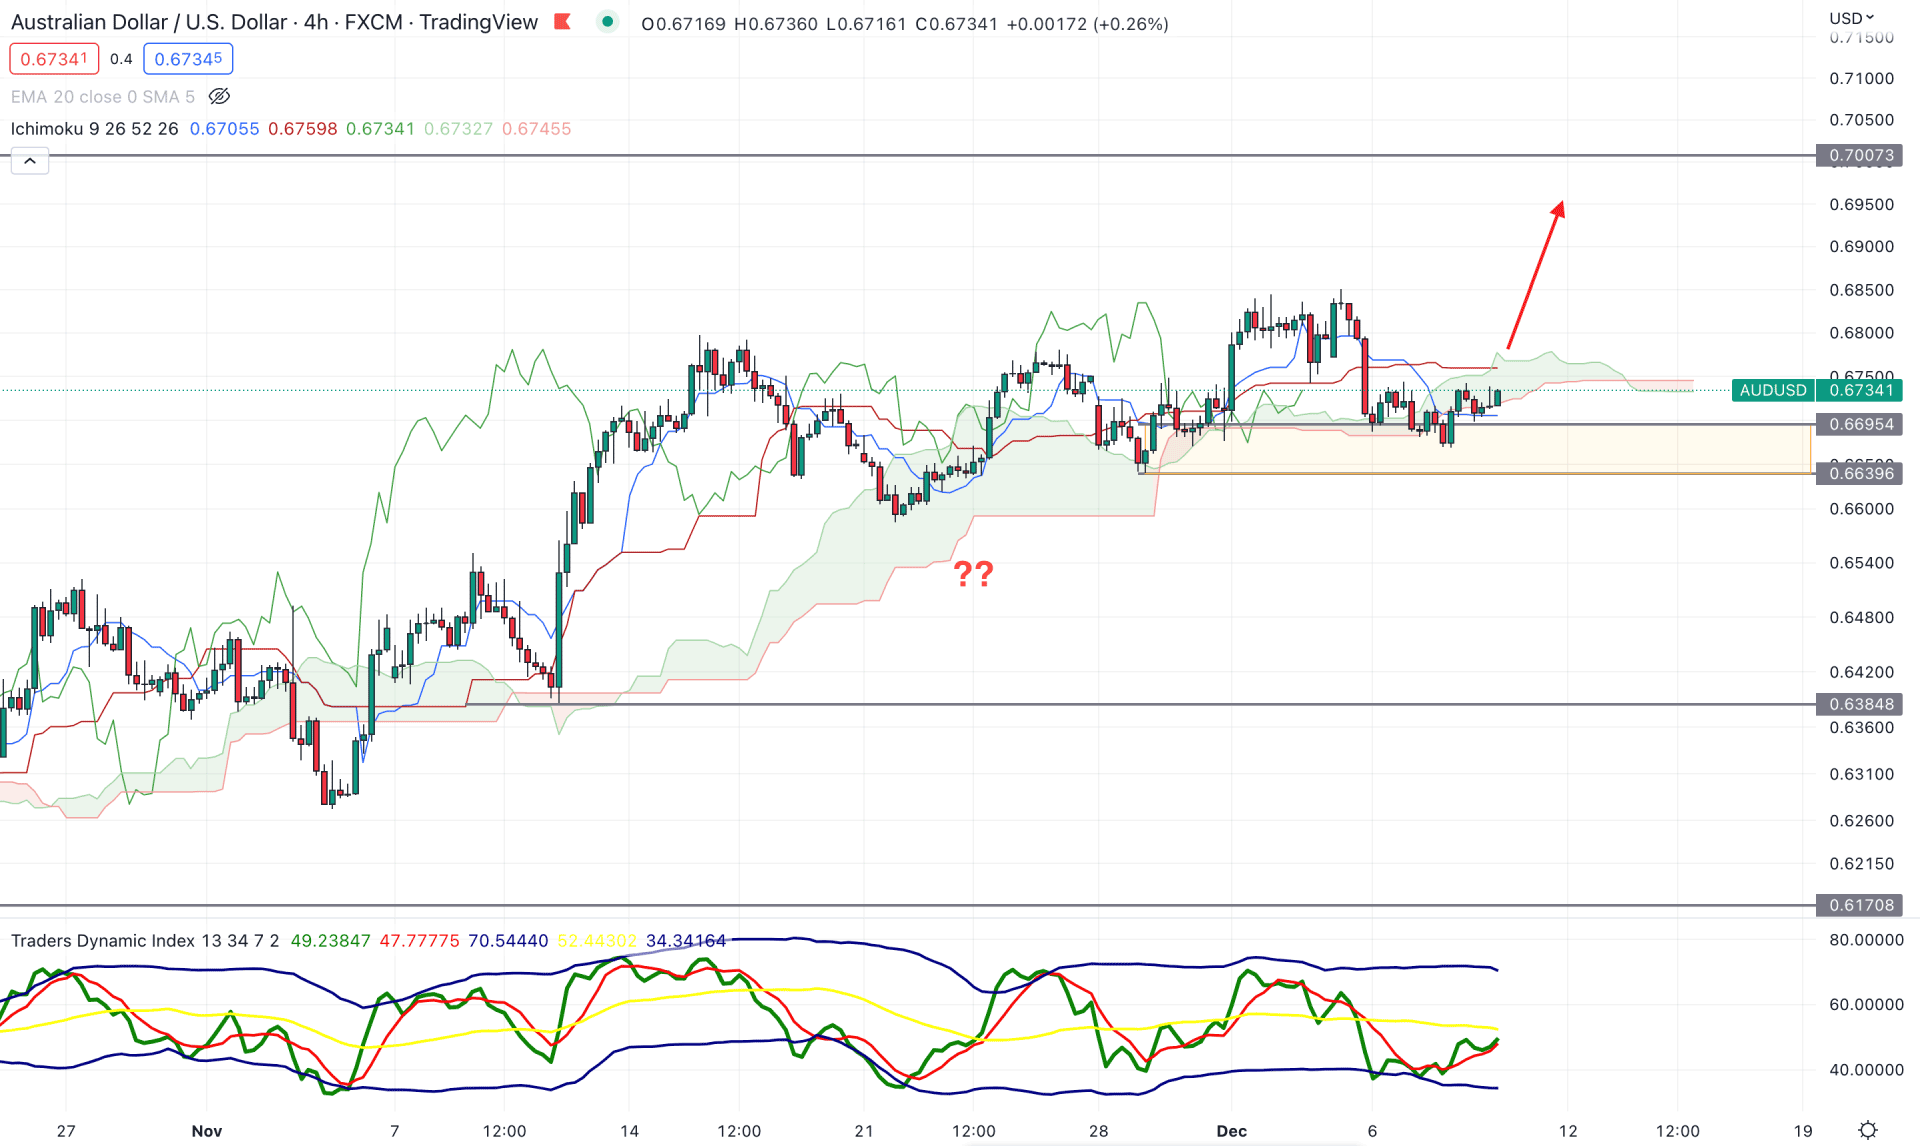
In the H4 timeframe, the bullish trend continuation opportunity is solid in the AUDUSD price as the current price is facing buying pressure from the near-term demand zone.
In the future cloud, the Senkou Span A is below the Senkou Span B but with a neutral momentum. Moreover, the current price is trading below the dynamic Kijun Sen level, which is a sign of indecision.
In the indicator window, the Traders Dynamic Index is showing buying pressure from the lower band while the current price is within the Kumo Cloud.
Based on the current market outlook, the bullish possibility is solid in this pair where a new H4 candle above the dynamic Kijun Sen could offer a long opportunity, targeting the 0.7000 level.
On the other hand, any selling pressure with an H4 candle below the 0.6639 level could eliminate the bullish possibility of a move towards the 0.6170 level.
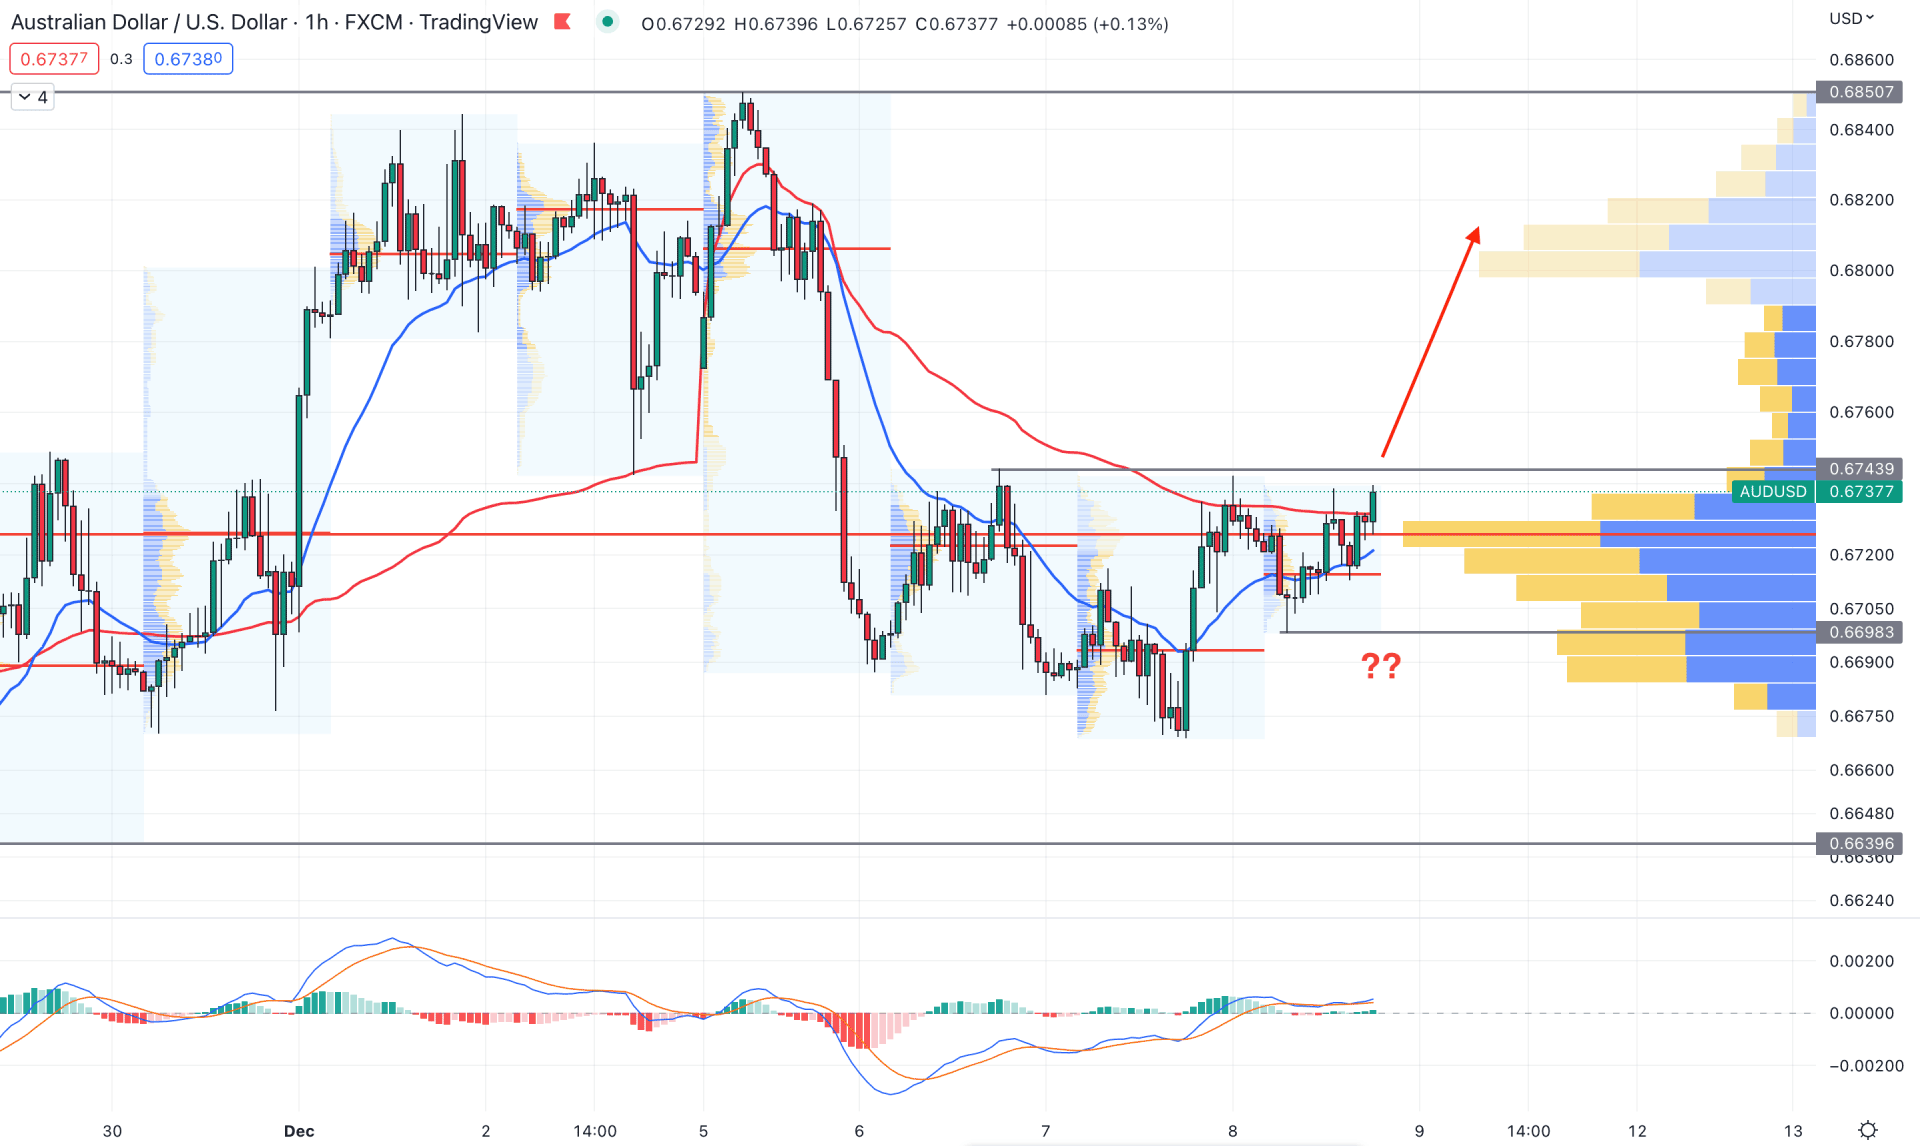
In the hourly chart, the buying possibility is solid as the current price is forming a bullish pre-breakout structure. Moreover, the visible range high volume level is below the price, working as immediate support.
The dynamic 20-day EMA is below the price and aiming higher, while the latest intraday high volume level is making a higher high below the current price.
Based on the current price behaviour, a new bullish H1 candle above 0.6743 would increase the bullish possibility towards the 0.7000 area. However, breaking below the 0.6698 level would invalidate the buying momentum and open a short opportunity towards the 0.6636 level.
Based on the current market analysis, AUDUSD bullish possibility is solid as the current daily price is trading above the critical support level. In that case, any intraday buying setup could work well until the H4 price comes below the 0.6639 level.


