

Published: September 3rd, 2026
As investors digested the latest trade data, the Australian dollar remained above $0.72, trading near its best level in over three months as robust economic growth increased the likelihood of an impending rate hike.
The US dollar (USD) strength was supported by growing US Federal Reserve (Fed) rate-hike bets and intensifying US-Iran tensions. However, markets initially reacted to Australia's higher-than-expected Q2 GDP figure. This implies that the AUDUSD pair's path of least resistance is downward and supports the idea of a recent decline from levels slightly above the 0.7200 mark.
The nation's goods trade surplus fell to A$1.9 billion in July from a corrected A$2.3 billion in June. It was still higher than the anticipated A$1.45 billion, thanks to lower fuel imports and higher gold exports.
The economy performed better than anticipated in the second quarter, according to new data. Although a rise to 4.60% is completely priced in for November, markets raised the likelihood of a hike during the month to 58% from 49% before the GDP data.
The hawkish policy stance also coincided with rising oil prices and inflation concerns brought on by fresh warfare in the Gulf.
Let's see the full outlook from the AUDUSD technical analysis:
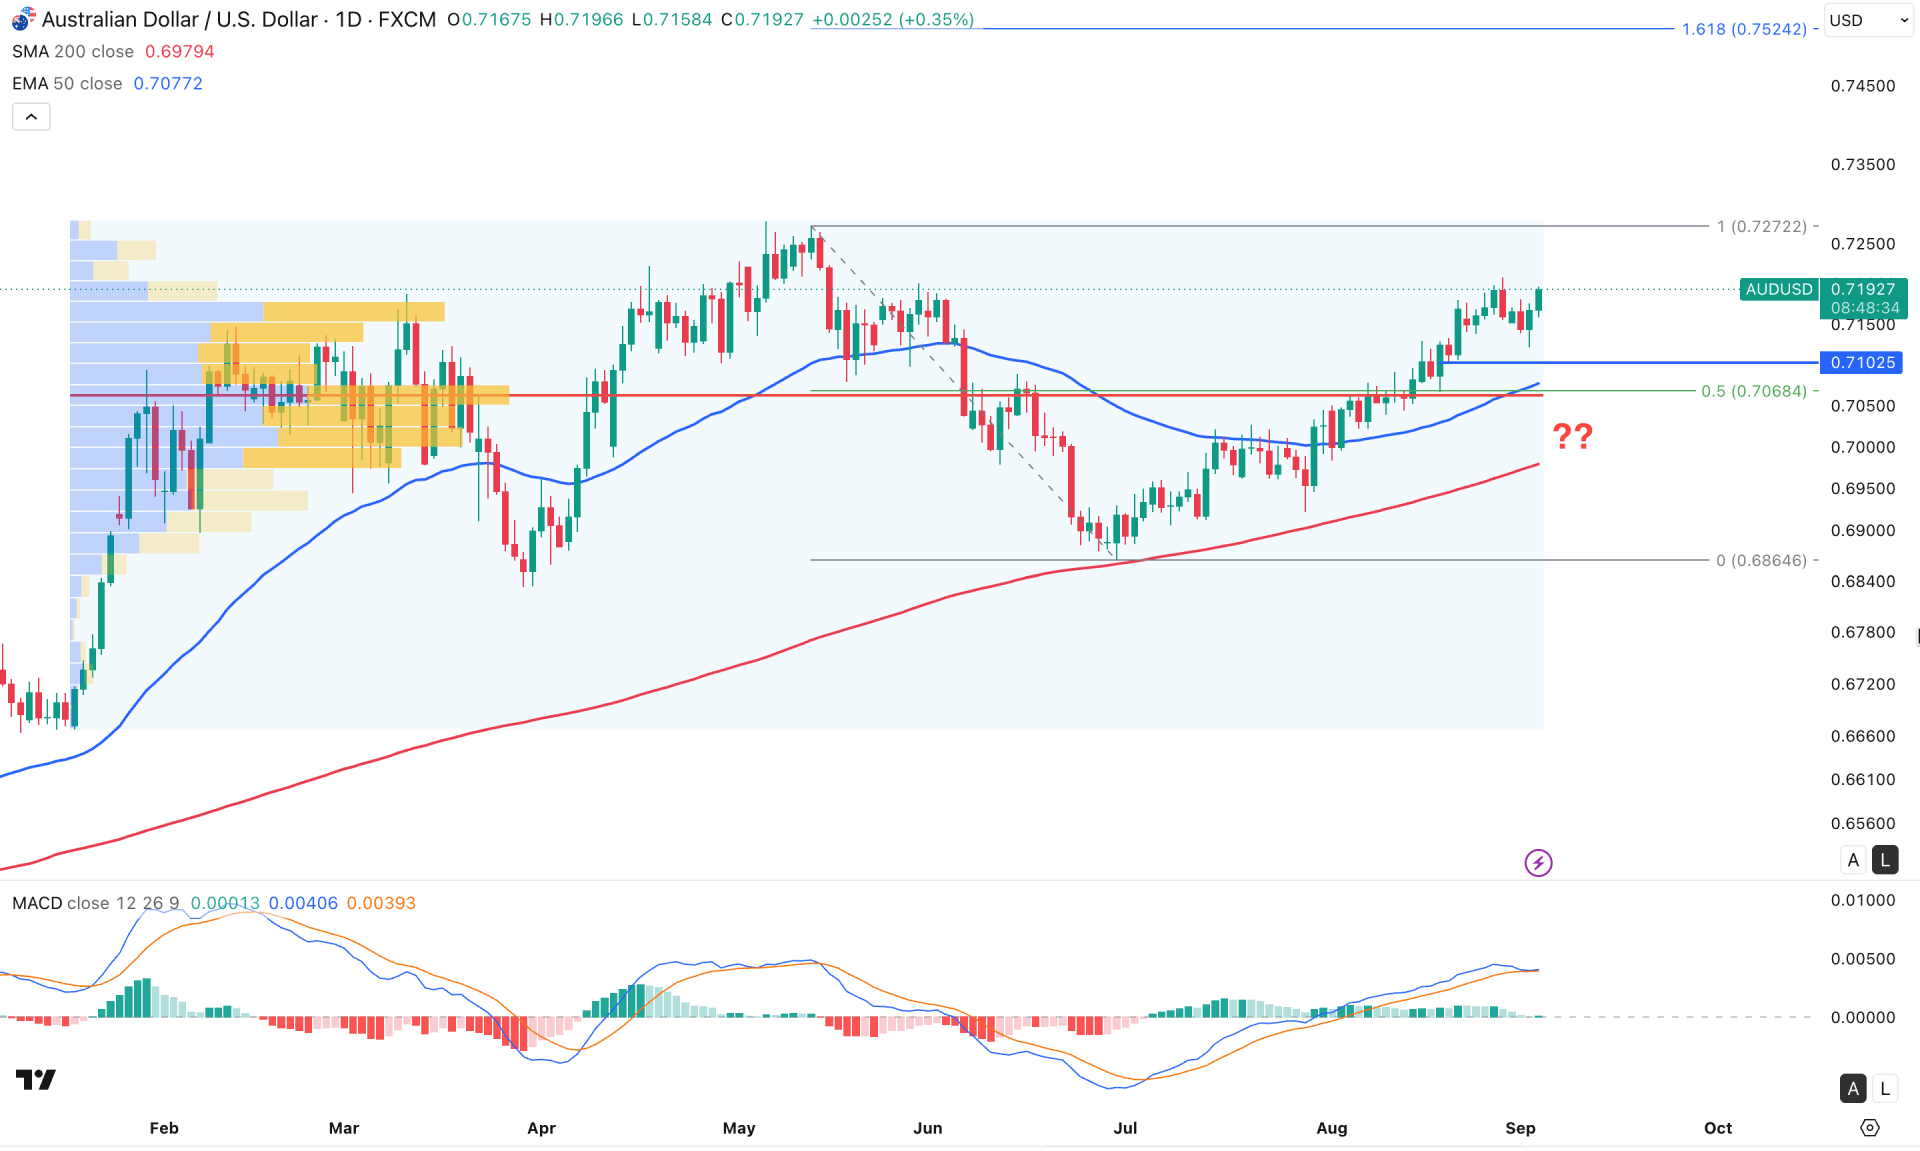
On the daily chart, AUDUSD shows ongoing bullish momentum, as the price continues to rise without violating the March 2026 swing low. This indicates a valid bullish trend continuation to the upside. However, downside risk remains present based on the overall market structure.
On the higher timeframe, decent buying pressure is visible, as three consecutive monthly candles are bullish following a minor downside retracement from the support area. As the current market price is hovering near the existing monthly resistance, a possible breakout could create a fresh bullish trend at any time.
The weekly timeframe shows a similar structure, with nine consecutive bullish weeks, followed by the existing bearish wave. As the price has almost recovered the losses initiated from May 11, a possible breakout awaits validation from the near-term resistance area.
Volume remains supportive of buyers, as the most active level since January 2026 is at 0.7061, below the current price. Overall, the structure may remain bullish as long as price holds above the high-volume line.
On the main price chart, the 200-day SMA and 50-day EMA have bullish slopes, as both lines remain below the current price with bullish separation. This indicates stable market momentum on the buyer side. In this structure, any Golden Cross continuation strategy could provide a trading opportunity.
In the indicator window, a different story is present, where the MACD signal line has reached a peak and become sideways. Meanwhile, the histogram has started to lose bullish momentum and is moving toward the neutral area, creating downside risk.
Based on the daily market structure, the recent sell-side liquidity sweep from 0.7136 is working as strong bullish pressure. As a valid bullish rebound candle has formed, the price is likely to move higher and test the 0.7272 resistance level.
In the long-term structure, we anticipate the buying pressure to continue as long as the price holds above the 50-day EMA line. In that case, overcoming the 0.7272 area could extend the buying pressure toward the 0.7524 Fibonacci extension level.
On the other hand, the immediate support level is at the 0.7102 level, which is at the bottom of the current structure. This indicates decent room to form a bearish correction without invalidating the bullish structure. Primarily, an immediate bearish rebound with a daily close below the 0.7165 level could increase the possibility of testing the 0.7102 level.
However, an extended loss below the 0.7060 level might increase the possibility of further downside pressure, where the ultimate target would be to test the 0.6830 swing low.
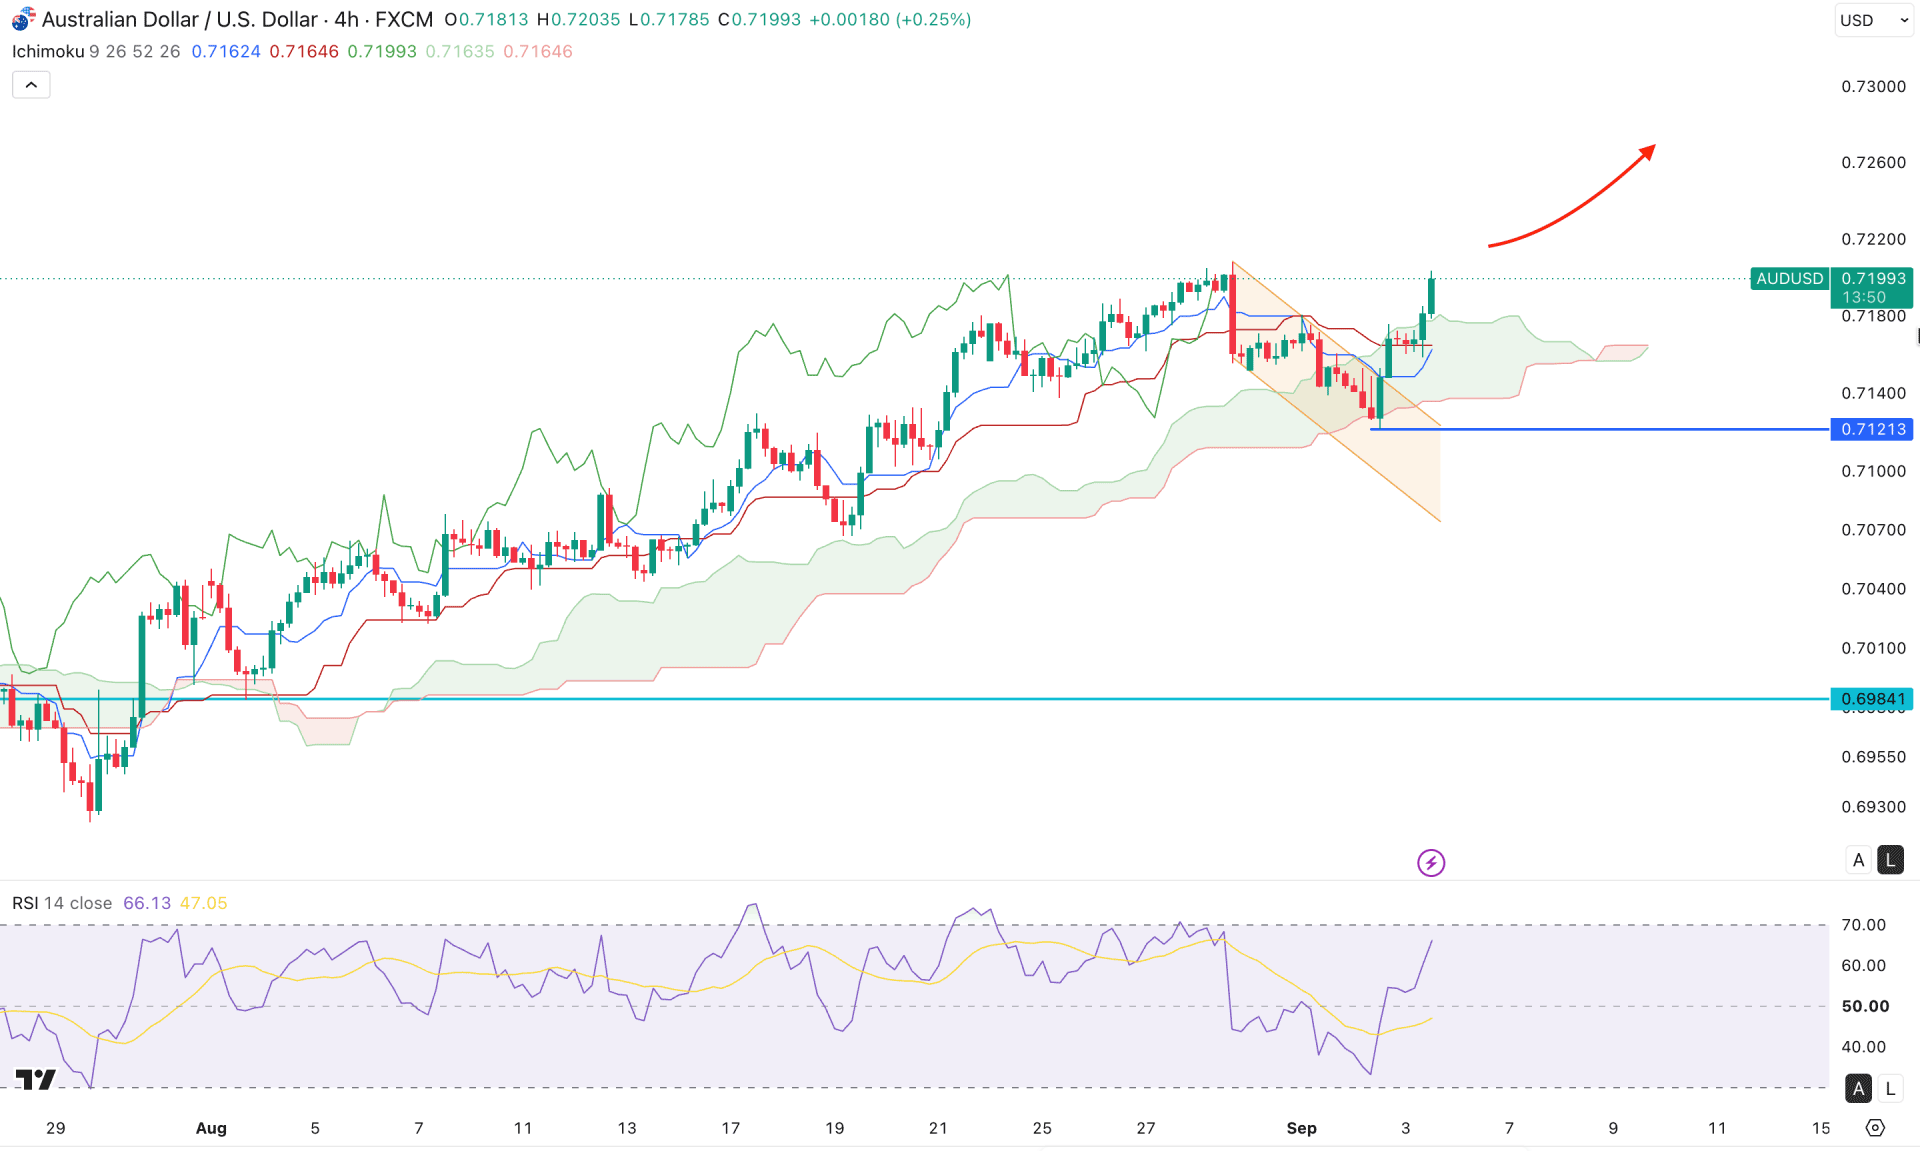
In the four-hour timeframe, AUDUSD is also trading with a bullish trend, while the recent rebound from the cloud support signals a potential bullish continuation opportunity.
In the Ichimoku Cloud structure, the price is trading above the dynamic support lines with a bullish crossover, which signals a potential bullish move. Moreover, the future cloud has squeezed to a point, while the leading span is aiming upward.
In the secondary indicator window, the Relative Strength Index rebounded above the 50.00 line without violating the 30.00 oversold level. As the current line is aiming upward, the price is likely to follow the momentum, as no divergence is seen in the premium area.
Based on this market outlook, the bullish continuation pattern remains valid as long as the price stays above the cloud support area. In that case, overcoming the August 2026 high would be a remarkable achievement that could take the price beyond the 0.7300 area.
On the other hand, a minor downside correction is possible, where the immediate support to watch is the 0.7021 level. A break below this line with consolidation might signal a bearish cloud breakout that could take the price toward the 0.7000 area.
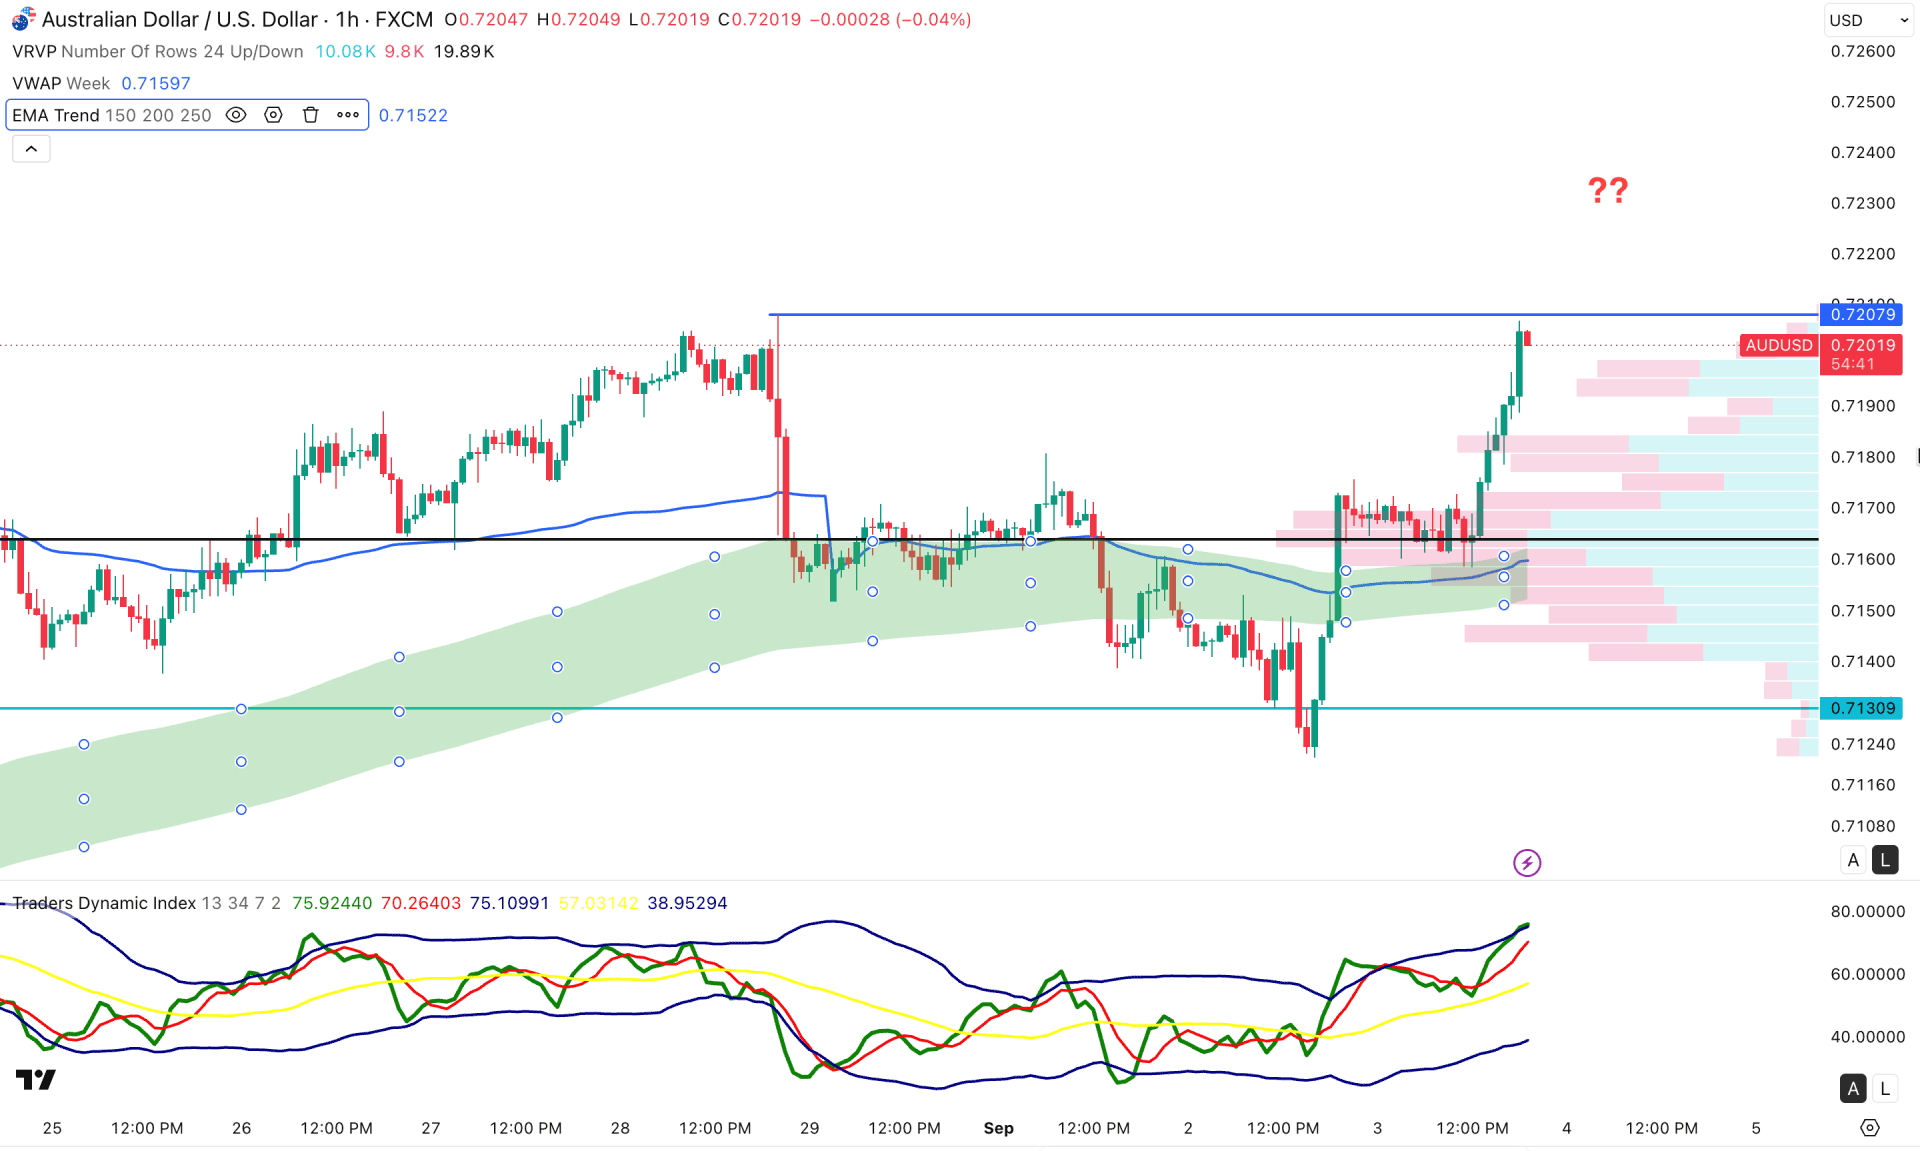
In the hourly timeframe, AUDUSD is trading bullishly with a rally-base-rally formation to the upside. The most recent price action has reached the previous high.
In the indicator window, the weekly VWAP and EMA wave are close together and working as strong support below the existing range-bound phase. Primarily, a bullish impulse is present with a valid breakout from the 0.7167 high-volume line, which signals potential bullish continuation.
In the secondary indicator window, the Traders Dynamic Index has reached the peak area, signalling a possible top formation in the main price chart.
Based on this outlook, the price is in an extremely bullish condition. The 0.7207 level is a crucial resistance to watch. A bullish recovery above this line followed by a failure to hold above it could increase the possibility of forming a correction, targeting the 0.7167 support level before continuing the existing buying pressure.
On the other hand, an extended correction with a break below the 0.7130 swing low could invalidate the bullish structure at any time.
Based on the market structure, AUDUSD is trading within a corrective bullish structure, while the long-term outlook shows more room for upside movement. Price faces resistance at the critical daily swing high, where a valid breakout is needed to confirm bullish continuation.


