
Published: May 7th, 2026
In the intraday chart, AUDJPY gained strength around 113.30 after news that the US and Iran are nearing an agreement to end the conflict.
On Wednesday, an Iranian official stated that the country was examining a peace proposal from the United States. According to sources, it would legally end the conflict but leave unfulfilled the crucial demands of the United States that Iran halt its nuclear project and restore the Strait of Hormuz. Iran is scheduled to deliver its response to mediators over the US offer to avert the war on Thursday.
However, concerns about intervention may restrict the cross's potential upside. Following alleged actions by Japanese officials to bolster the JPY. Atsushi Mimura, Japan's top foreign exchange official, declared on Thursday that he will keep a careful eye on the foreign exchange markets. Mimura also refused to comment on certain currency levels and FX intervention.
Let's see what price tells us from the AUDJPY multi-timeframe analysis:
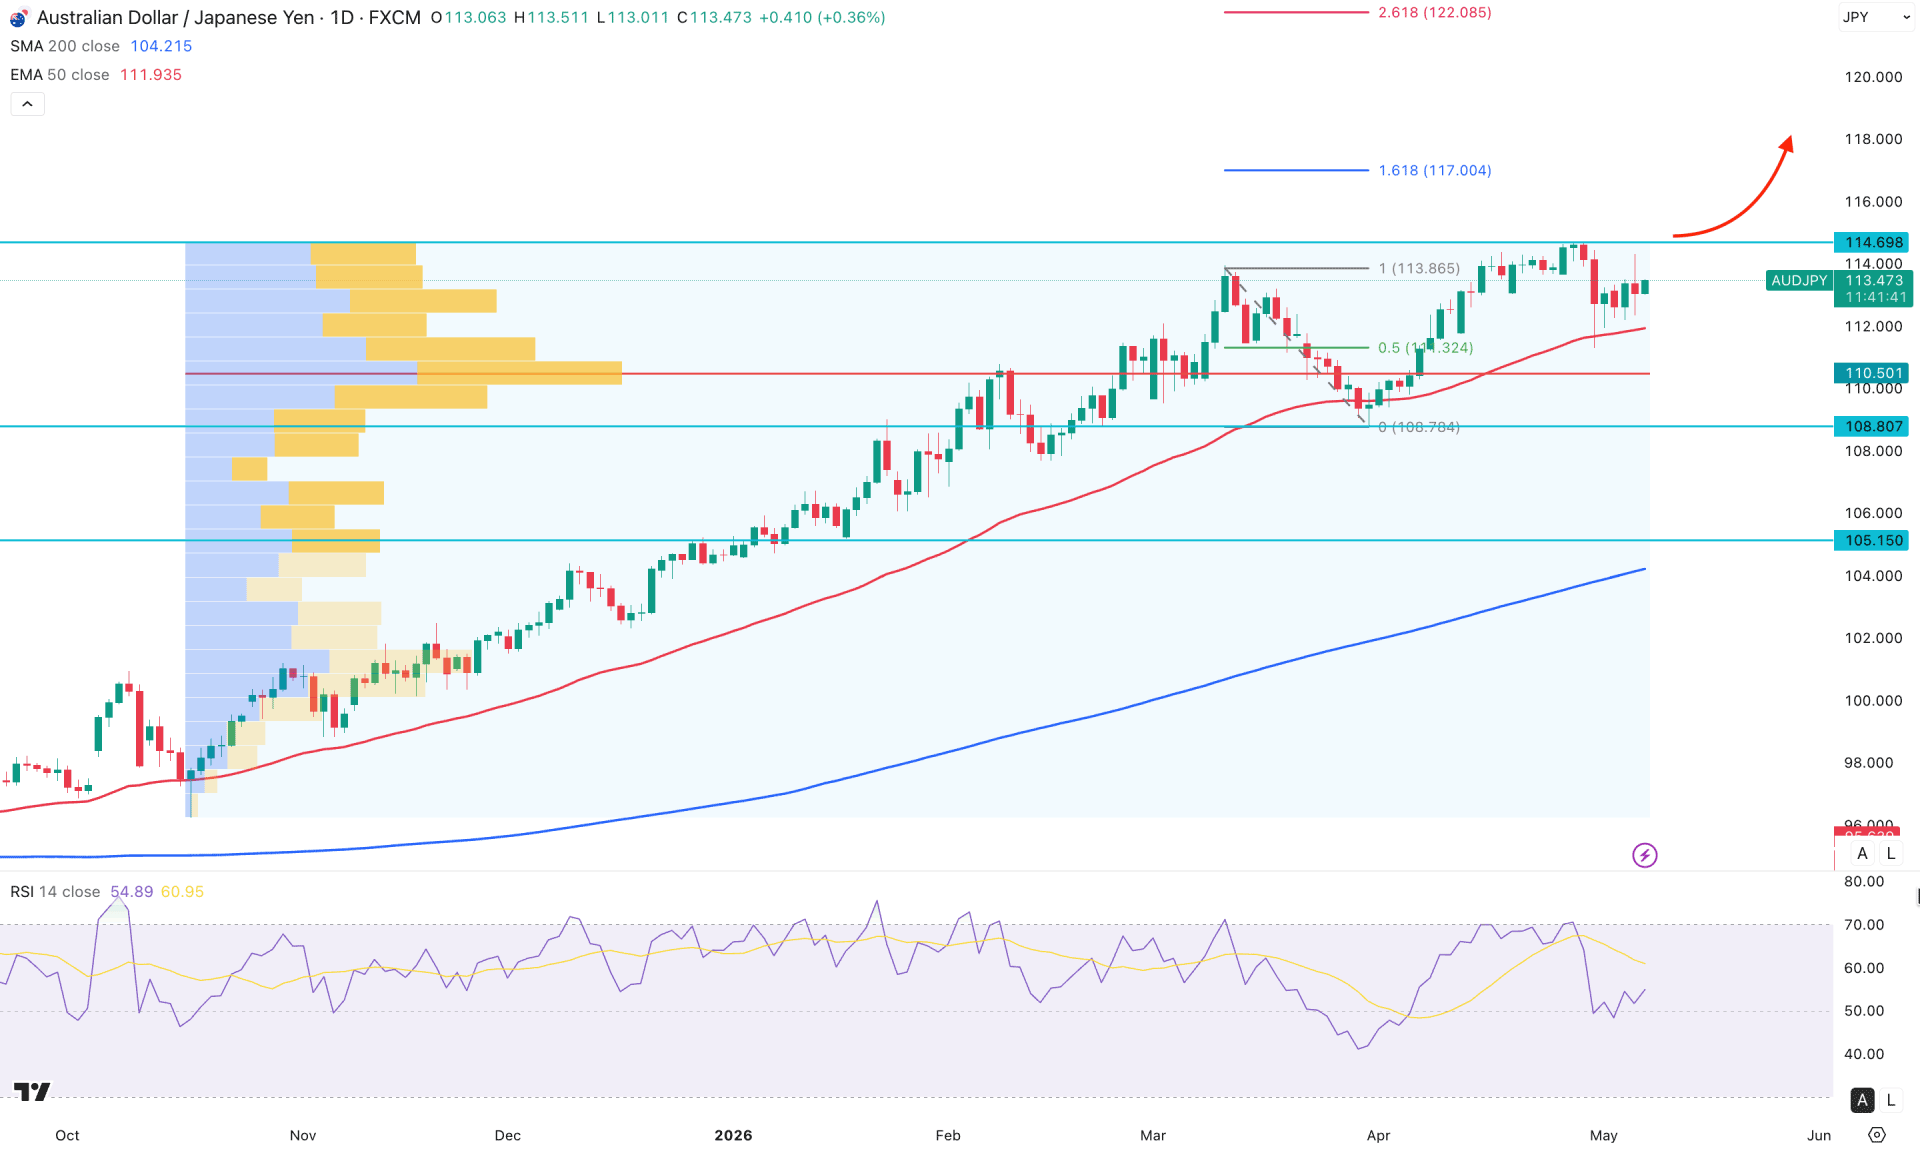
In the daily chart of AUDJPY, the major market momentum is bullish, even if a minor exhaustion is visible at the all-time high level. As no significant selling pressure is seen in the current price area, the primary aim could be to look for long trades only.
Looking at the higher timeframe, the monthly candle suggests an impulsive bullish wave with no sign of a recovery from the top. Moreover, the recent monthly candles failed to maintain downside momentum after forming a shooting star candlestick, signaling sellers' failure in the market. The weekly timeframe shows a similar structure, with no sign of bears at the top.
In terms of volume, bullish orders are still favorable, as the largest activity level since October 2025 is at the 110.50 level, which is way below the current price. Although the recent price is volatile after the announcement from the Bank of Japan, the entire structure is still on the buyers' side.
In the daily chart, the 200- day SMA is way below the current price, signaling a major bullish trend. Moreover, the 50-day EMA is acting as a short-term support level with multiple bullish rejections from this line.
On the other hand, the Relative Strength Index (RSI)is at the 50.00 neutral area, signaling sideways market pressure. However, as long as the RSI holds above the 50.00 level, a potential bullish recovery is possible.
Based on the overall market structure, the ongoing market momentum is bullish as long as the price trades above the 50-day EMA. In that case, a bullish recovery with a daily close above the 114.69 level could create a new swing high at the 117.00 Fibonacci Extension level.
On the other hand, any immediate selling pressure with a stable price below the 110.50 level will likely increase the possibility of moving below the 108.80 level and testing the 106.00 area.
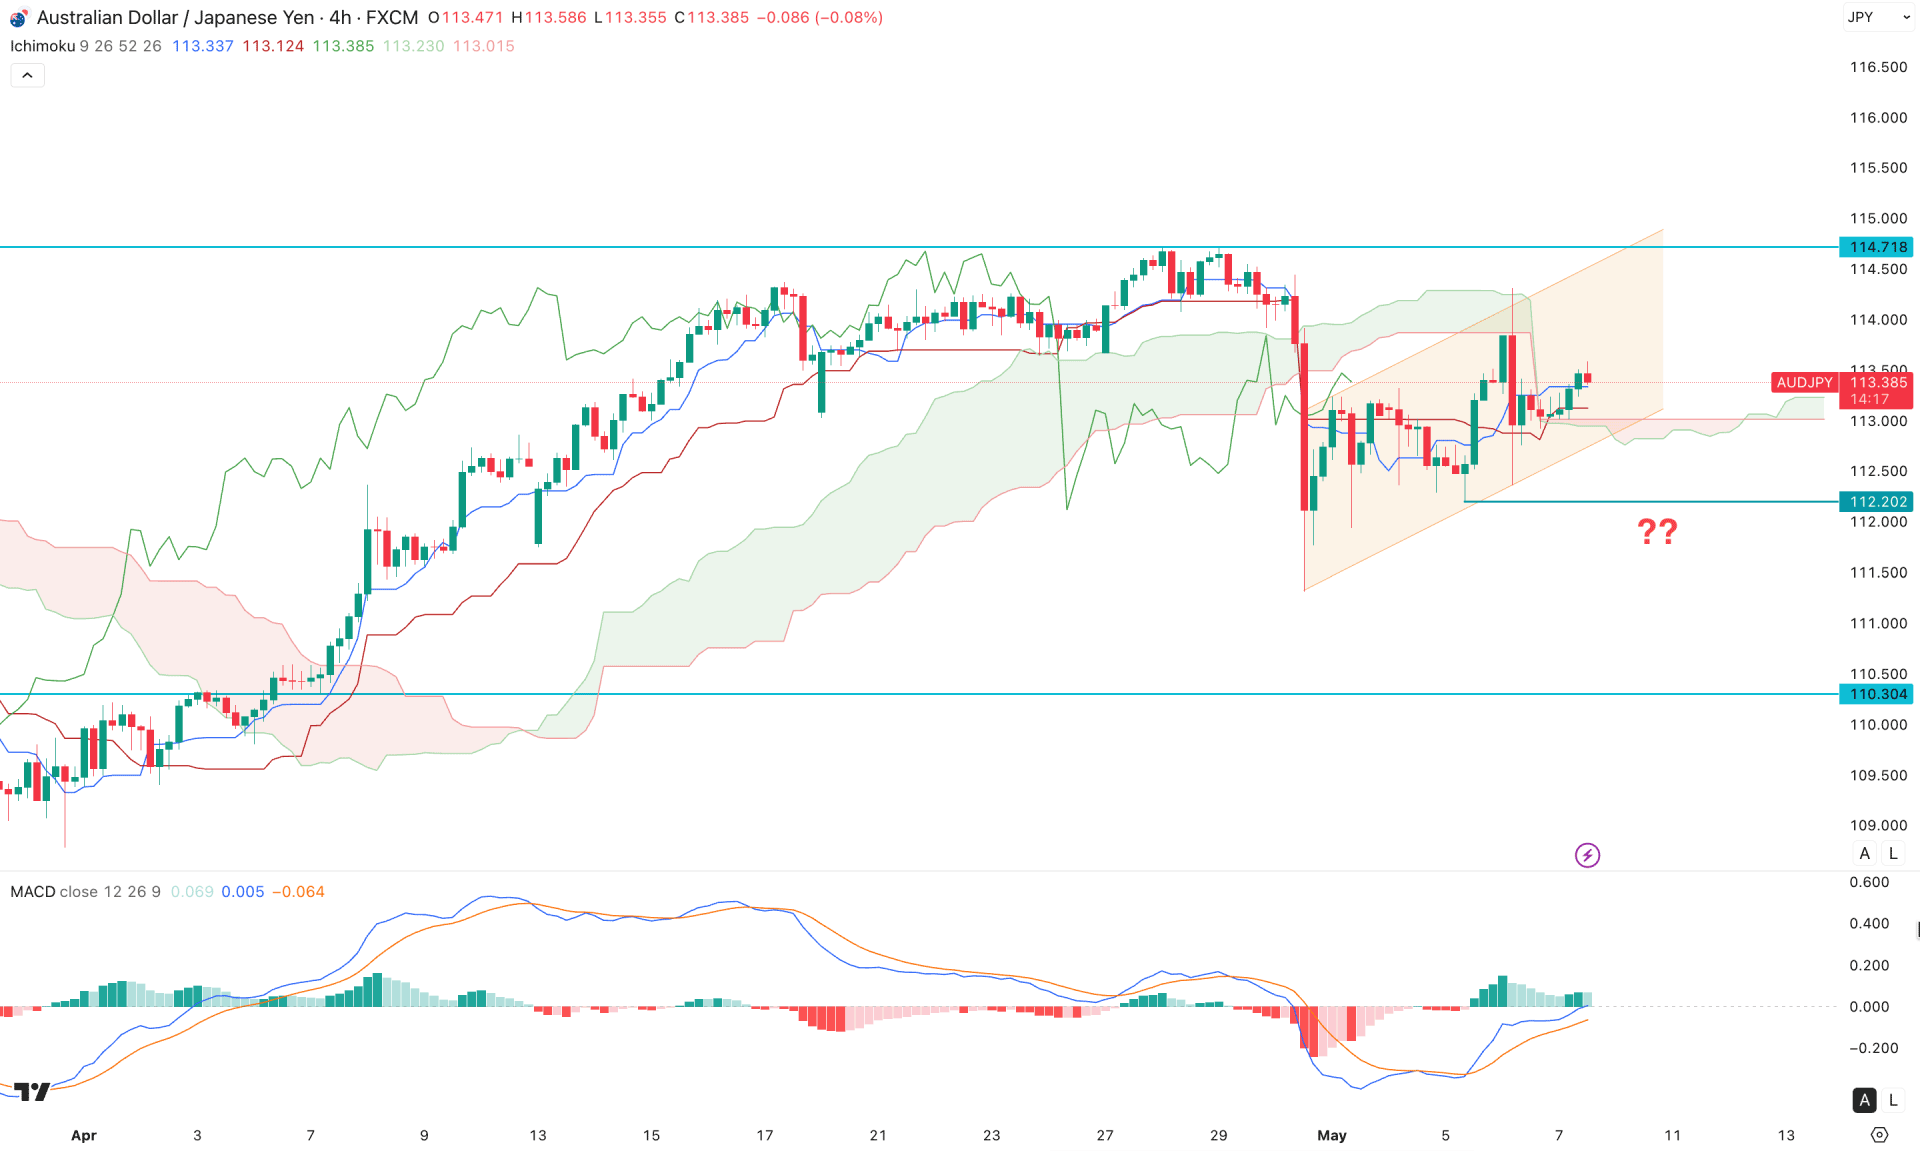
In the four-hour timeframe, AUDJPY is trading within a corrective bullish structure after having a strong break below the cloud area. Although the speed of the breakout is solid, the price failed to hold the momentum below the cloud area. As a result, an extended bullish correction has formed within an ascending channel.
In the future cloud, both lines are flat, moving in parallel and signaling indecision. The dynamic levels are also flat and closer to the current price, signaling sideways market momentum.
In the indicator window, MACD Histogram bars have rebounded without testing the neutral level. The MACD signal line is also showing a bullish recovery after forming a bullish crossover.
Based on this outlook, the price is trading within an ascending channel, from where any bullish rebound could be a long opportunity, targeting the 114.70 level. However, to validate the long-term bullish strength, investors should monitor how the price reacts at the 115.00 leve. Overcoming this line with a bullish close could open the room for moving beyond the 116.00 area.
On the other hand, the price is trading with extended sideways momentum. A failure to hold buying pressure at the channel support would be a key factor; in that case, a four-hour candle below the 112.20 level could extend downside pressure towards the 110.30 key support level.
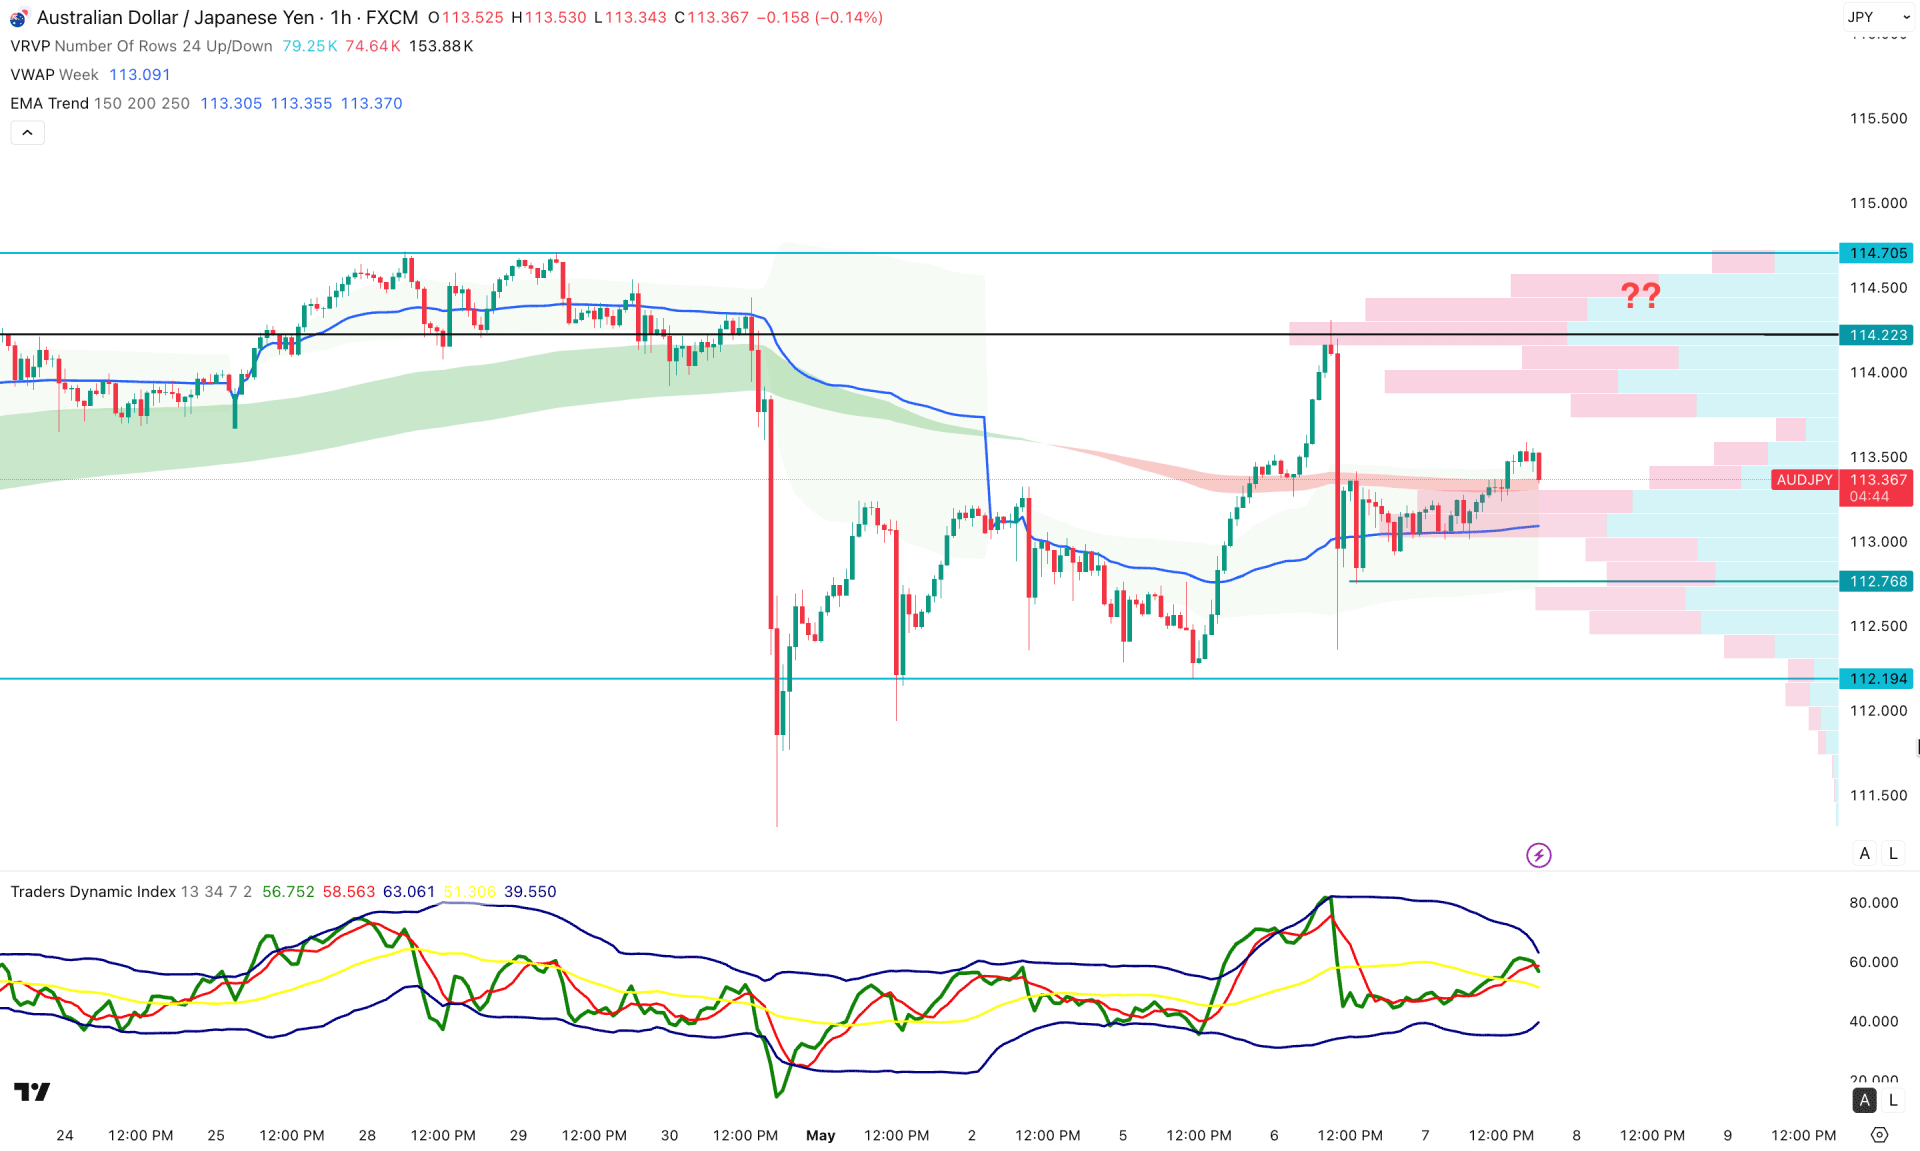
In the hourly chart of AUDJPY, extreme sideways market momentum is visible, as the most recent price is trading below the high-volume line of 114.22. On the other hand, the EMA wave is closer to the current price, and the weekly VWAP is below the current price. It is a sign that the price is trading within sideways momentum and needs a clear direction from a breakout.
The Traders Dynamic Index shows a similar picture, where the most recent line is near the neutral 50.00 level, which is also a confirmation signal of corrective market pressure.
Based on this outlook, the ongoing bullish bias is valid as long as the price holds above the weekly VWAP. A bullish rebound with recovery from the 113.00–112.19 area could open a long opportunity, targeting the 114.70 level. However, a failure to hold the price above the 112.19 level could create a new swing low below the 110.00 area.
Based on the overall market structure, AUDJPY is still trading with strong bullish strength, even if there is some exhaustion at the recent top following the Bank of Japan announcement on FX intervention.
As long as the overall price action remains bullish, taking any long trades from lower timeframe confirmation could be a valid approach.


