
Published: August 23rd, 2022
In the latest RBA minutes, the bank indicated the inflationary pressure might extend to the peak at the end of 2022 but will come down to the 2-3% range by the end of 2024.
The Australian labor market is strong while the unemployment rate is 50 years low. The RBA showed interest in paying more attention to the wage data to keep it above 30% to maintain stable inflation. However, the July employment was not pleasant where the employment dropped -by 40.9K, down from the expectation of a 25K increase. On the positive side, the unemployment rate ticked down to 3.4% to a 48-year low, coming from the big drop in the participation rate.
In Japan, the preliminary Q2 GDP showed that the country expanded by 0.5% quarterly and 2.2% annually. Personal consumption, which measures 60% of the GDP, showed a 1.1% increase while business investment is up by 1.4%.
The national inflation reading for July showed that the inflation shot higher, beating all measures, while the headline inflation came at 2.6% y/y and 2.4% y/y in June. Therefore, the Bank of Japan is likely to stay firmly on the easing path in the coming central bank meeting.
AUDJPY continued pushing higher, while bulls have been enjoying a 14% price increase since the beginning of 2022. The current price action with accommodative policies from BOJ could extend the buying momentum in the coming days.
Let’s see the future price direction of AUDJPY from the AUDJPY Technical analysis:
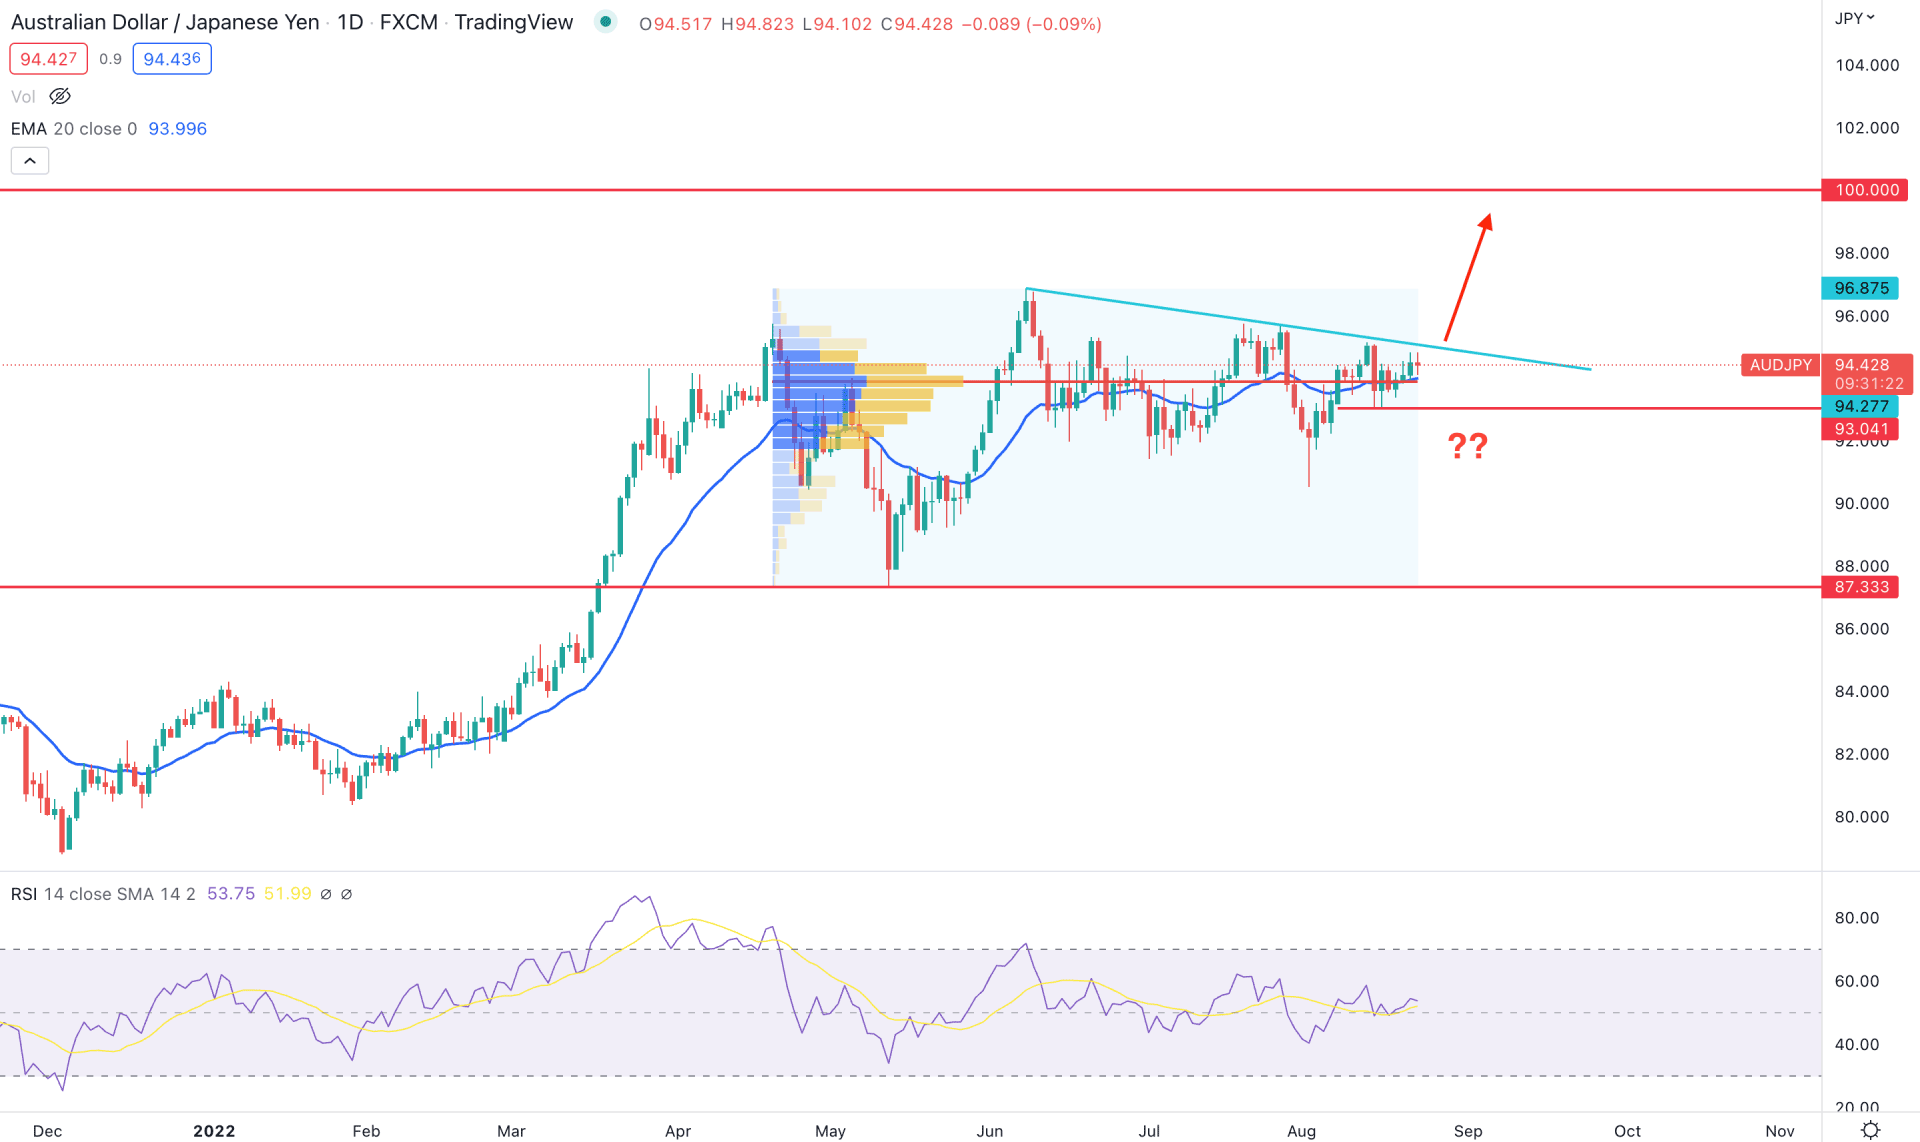
AUDJPY sell-side liquidity grab is over as the price made strong bullish exhaustion below the 92.00 key support level. Later, the buying pressure extended above the dynamic 20-day Exponential Moving Average with a corrective momentum. As the sell-side liquidity grab is over, the price is likely to extend higher above the trendline formed from June 2022 high.
Based on the volume indicator, the higher trading volume from April 2022 to August 2022 is at the 94.27 level, which is below the current price. Therefore, the buying pressure will likely extend until bears exceed the 94.27 high volume level.
The Relative Strength Index (RSI) showed a neutral opinion where the current RSI level is slightly above the 50% level. In that case, the bullish trendline breakout with the RSI level above the 50% area would be a solid combination for higher prices.
Based on the daily context, any bullish daily close above the 95.00 psychological level would be the first sign of the buying pressure towards the 100.00 level. On the other hand, the alternative approach is to find the price below the 93.04 support level with a bearish daily candle formation before aiming toward the 87.33 level.
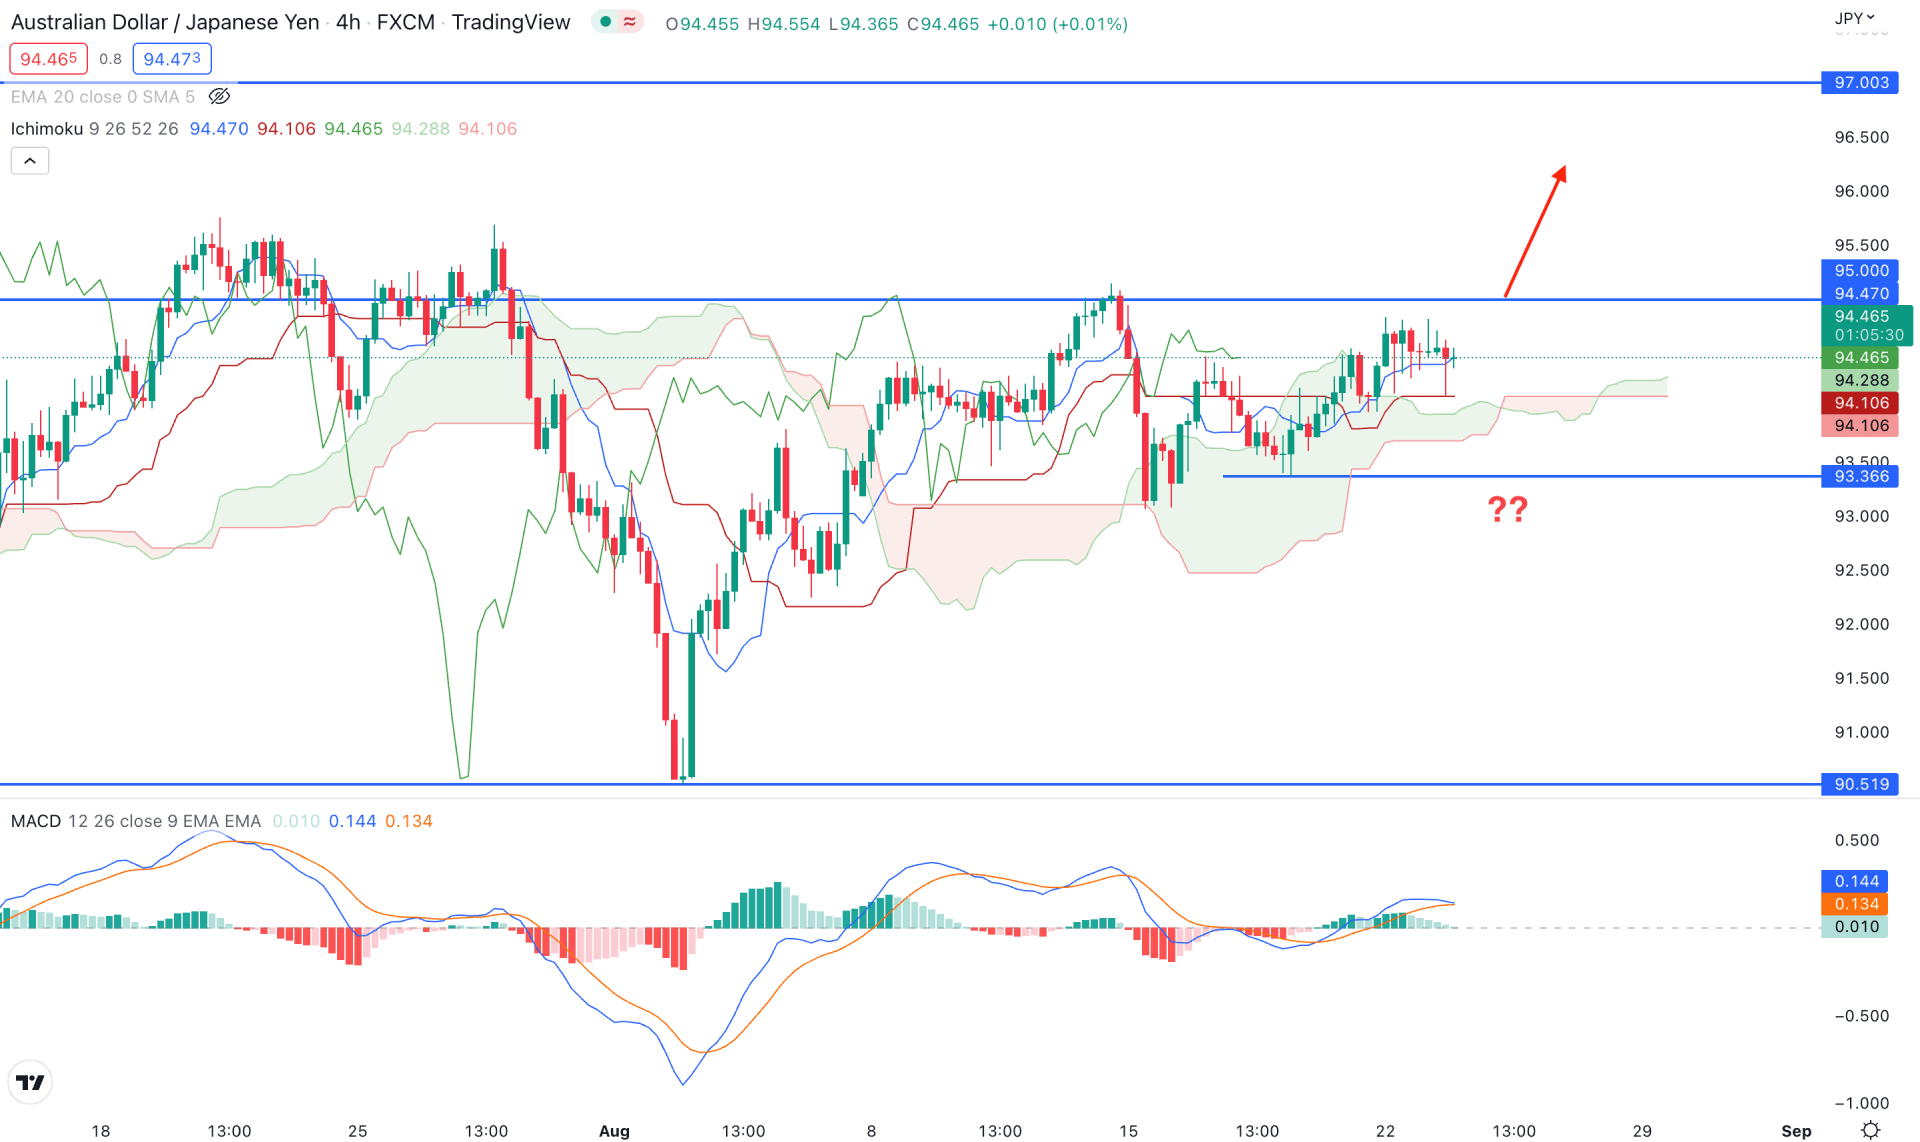
Based on the Ichimoku Cloud, AUDJPY trades within a corrective momentum where the Senkou Span A is above the Senkou Span B in the future cloud. The recent selling pressure on 15 August failed to overcome the cloud support and renounced higher, above the dynamic Kijun Sen level.
In the indicator window, the corrective price action is visible from the MACD Histogram, which trades nearly the neutral zone. The dynamic Tenkan Sen and Kijun Sen are working as immediate support levels from where a bullish rejection candlestick formed.
Based on the H4 context, investors should monitor how the price trades at 94.82 swing low, where a bullish H4 close above the 95.00 psychological level would be a potential bullish opportunity for this pair. On the other hand, breaking below the 94.10 cloud support level would extend the loss towards the 93.36 support level from where a bullish correction may happen.
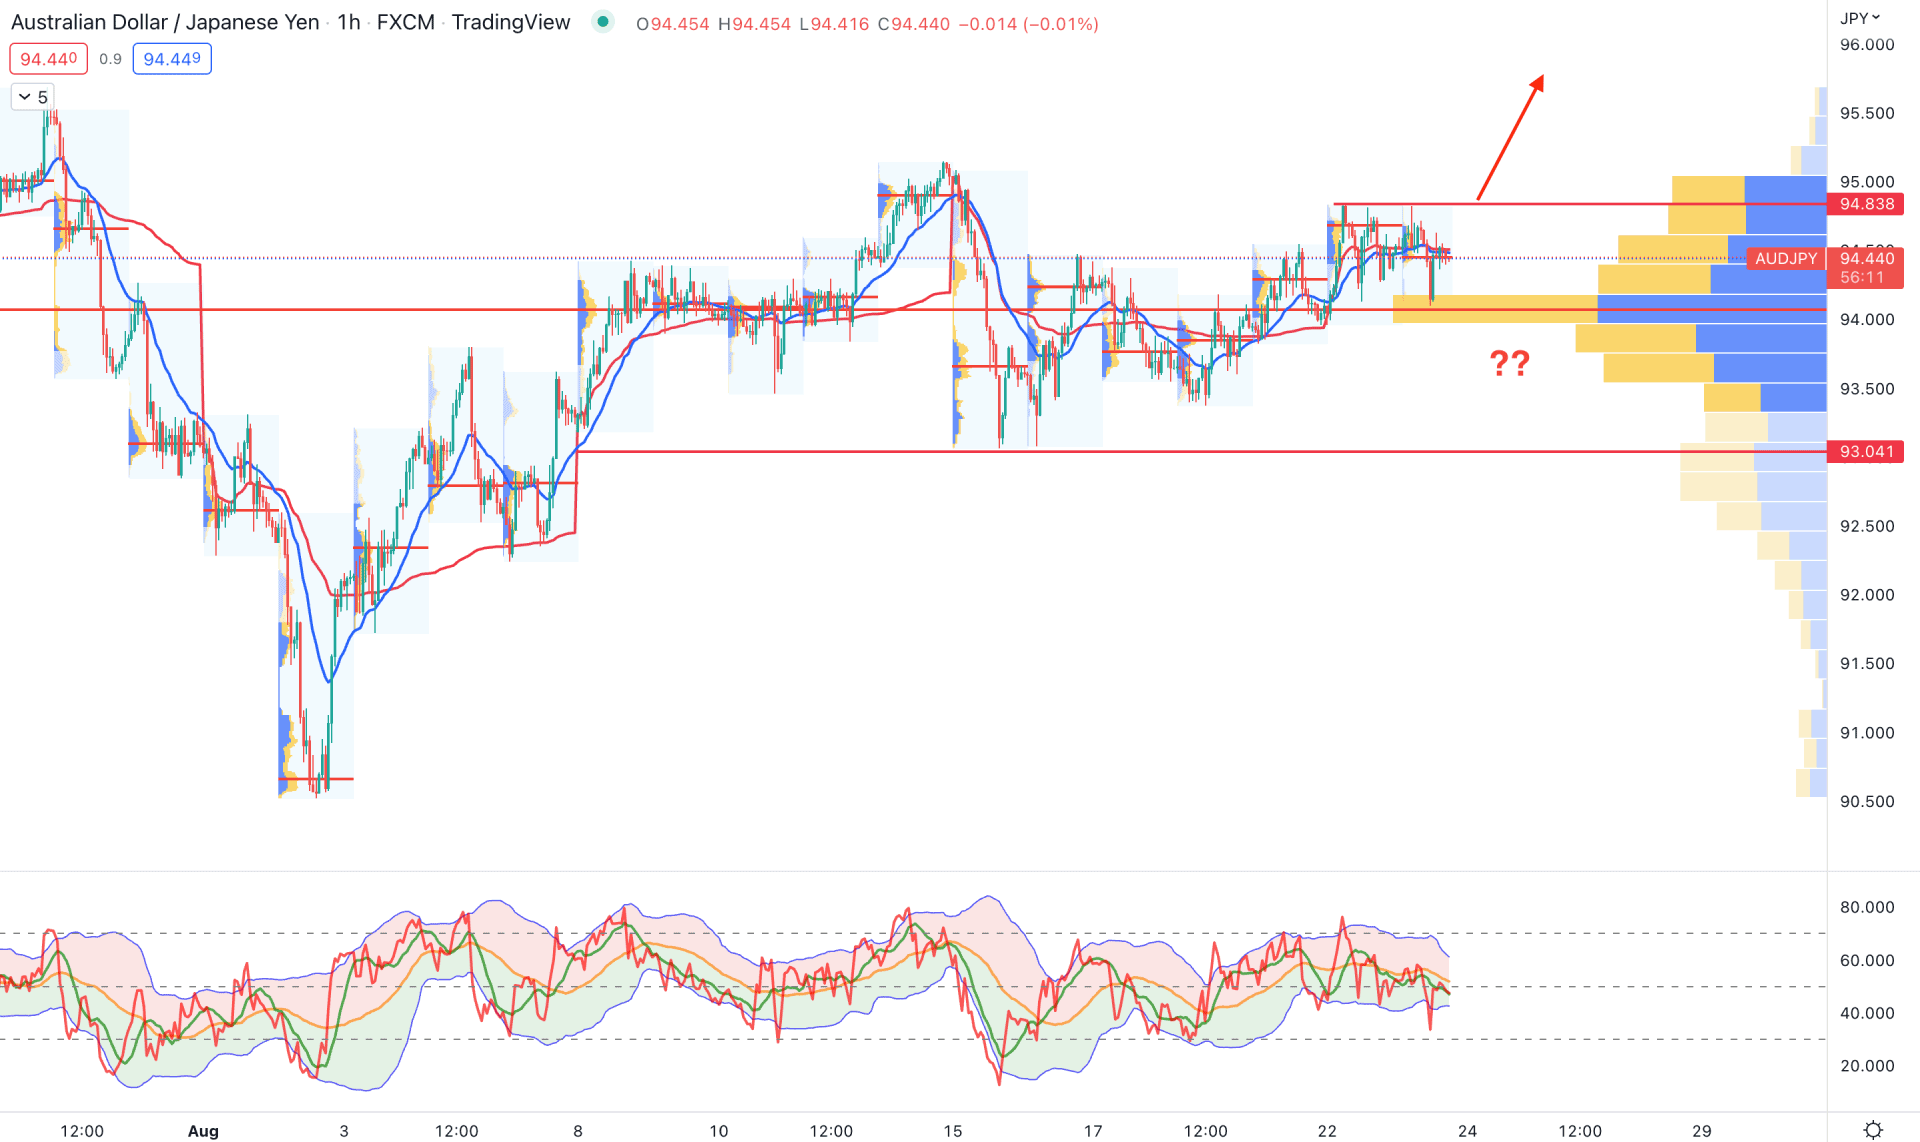
In the H1 timeframe, AUDJPY trades within a bullish trend, with a stable buying pressure above the 93.04 support level. Based on the visible range volume indicator, the higher trading volume was seen at the 94.10 level, signifying buyers' interest in the current price. Therefore, if bulls hold the price above the 94.00 level and form a bullish rejection candlestick, we may consider it a valid bullish opportunity towards the 96.00 level.
In the indicator window, the Traders Dynamic Index shows selling pressure as the current TDI level is below the 50% area. The dynamic 20 EMA and weekly VWAP are also above the price, working as resistances.
Based on the H1 chart, a bullish H1 candle above the 94.83 level is needed to consider the buying pressure potent. However, any bearish pressure below the 94.00 level with an impulsive momentum would hint at sellers' presence in the market that can hit a bearish opportunity towards the 93.04 level.
Based on the current multi-timeframe analysis, AUDJPY buying pressure may extend towards the 100.00 level. However, the current price still trades below the trendline resistance, where a bullish indication from the intraday chart is needed to validate the buying opportunity.


