

Published: November 5th, 2026
In the recent meeting, the RBA adopted a hawkish tone on the economy, moving away from a wait-and-see approach. According to the central bank, the risk of unemployment has fallen, opening room for a future rate hike. Overall, this is a major bull case for the AUD and could prompt buyers to take positions in the AUDJPY pair.
On the other hand, Japan's policymakers have decided to move from zero inflation to a stable 2%. However, several steps remain before it achieves the target. Higher energy prices and rising goods and services prices are major challenges for the BoJ.
At its recent meeting, BoJ policymakers left the interest rate unchanged at 1.25%. Moreover, the bank hinted that inflation could reach 2.5% in the near future.
As a result, the Japanese economy awaits monetary stimulation after decades of low borrowing costs.
Let's see the further aspect of this instrument from the AUDJPY technical analysis:
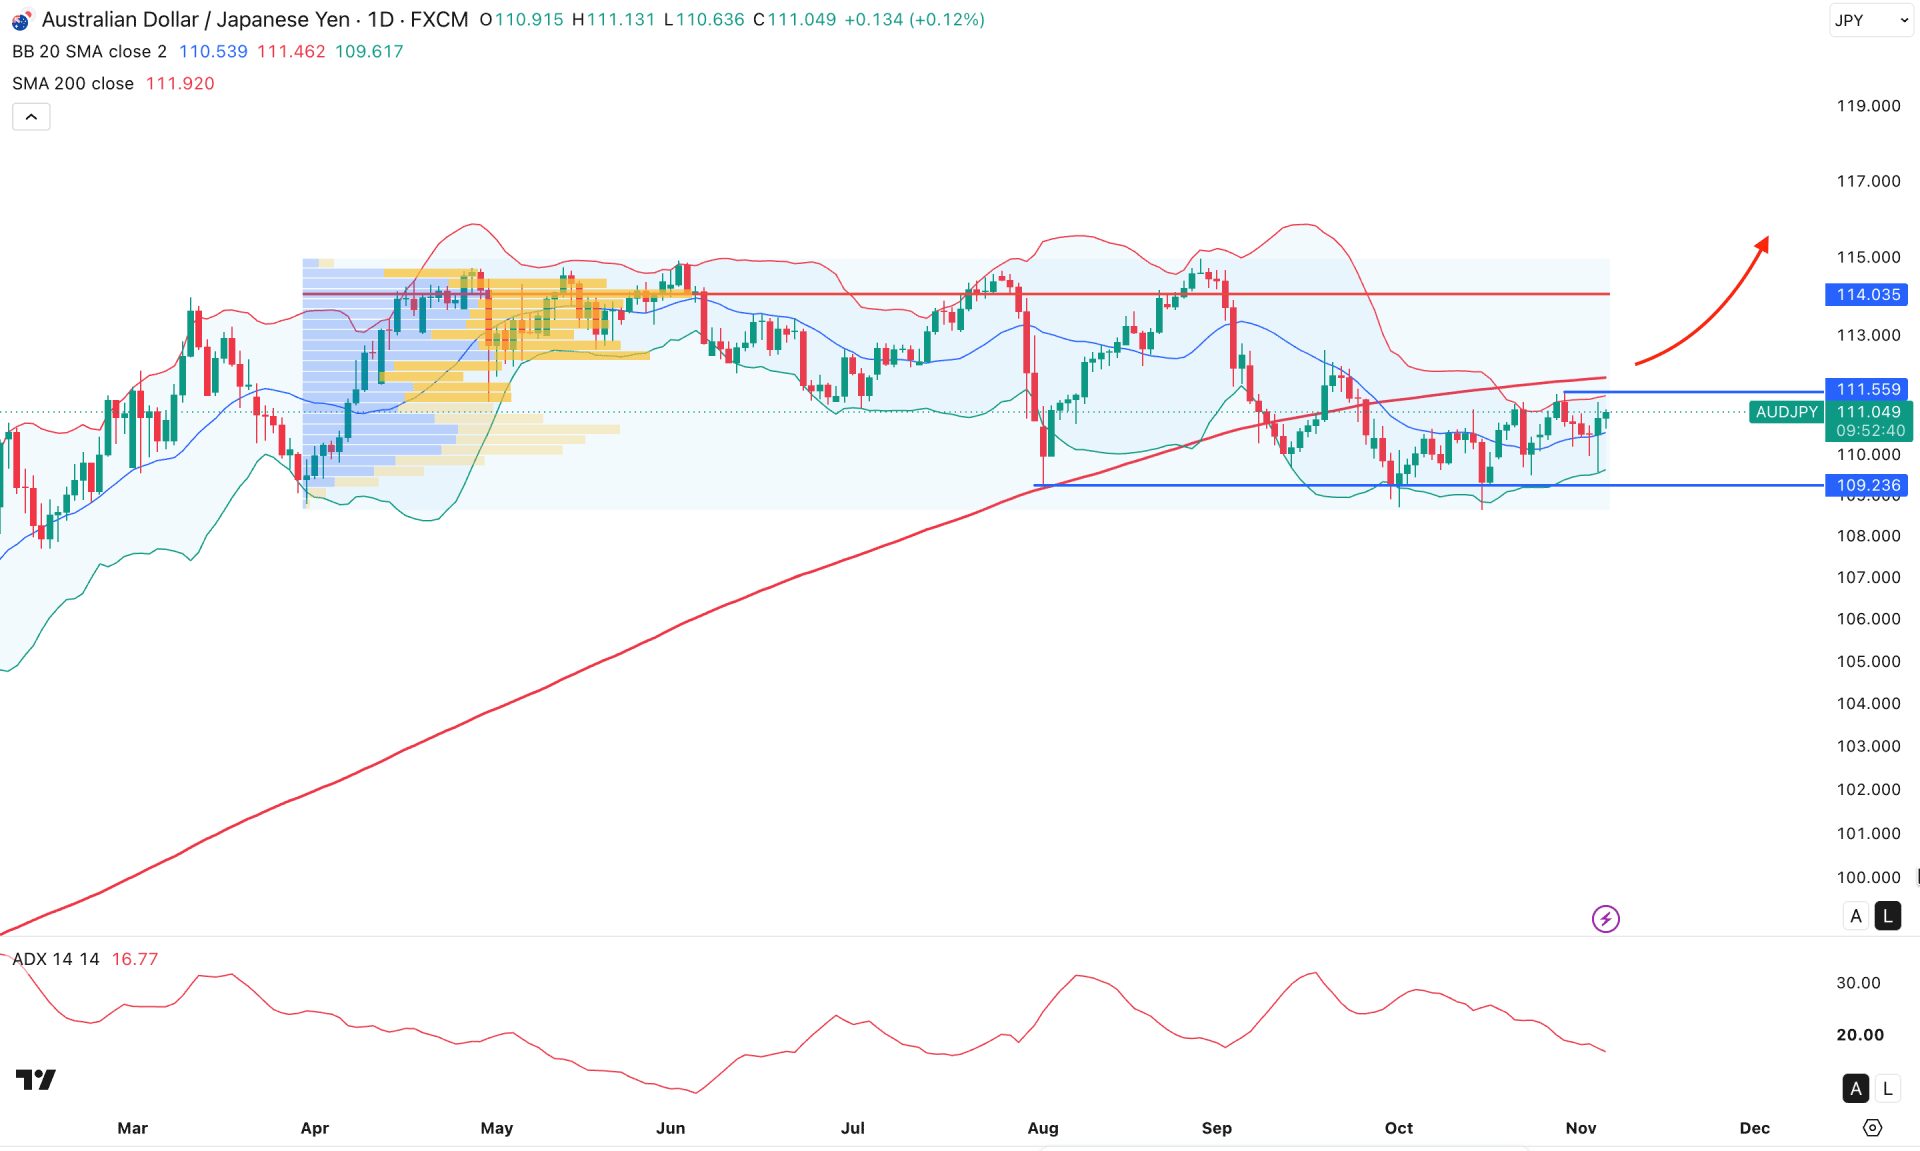
On the AUDJPY daily chart, sideways momentum is visible after volatility expanded at the bullish peak. As price remains above the August 2026 low, investors may expect a rebound on proper validation.
On the higher timeframe, price action is bullish, as the recent price is still trading above the major monthly support. However, price is now moving sideways after a bearish inside bar, where a bearish breakout is possible and could create strong selling pressure. The weekly timeframe shows a corrective structure, which is insignificant to consider a trend reversal after a long bull run.
Based on volume, price needs more confirmation before aiming higher, as the largest activity level since March 2026 is at 114.03. As the high-volume line sits in the bullish peak area, it signals counter-momentum at the top. Moreover, extended volatility over the last few months signals a buyers' struggle in the market.
On the other hand, the action is sideways, with a double-bottom breakout from the 109.23 low. Most recently, price tested the mid-Bollinger Band line and closed bullishly above it. Still, price must overcome the crucial 111.55 level to confirm the bullish U-shaped recovery.
Long-term market momentum is challenging for buyers, as price has remained below the 200 SMA for more than two months. However, a fresh trend is yet to form from the current range, where buyers still have an opportunity to win.
The Average Directional Index reached the 20.00 bottom line, signaling a sideways market.
In this structure, a recovery above the 200 SMA with a rebound in the Average Directional Index could be the first sign of a bullish trend continuation. In that case, the immediate resistance to watch is the 114.03 high-volume line. Breaking above this line could trigger a fresh bull run beyond the 116.00 area.
On the other hand, price is trading below the 111.55 crucial resistance line, backed by the 200 SMA.
In that case, a bullish continuation with a buy-side liquidity sweep from the near-term resistance area could be the first sign of a fresh trend. In that case, a downside reversal with a daily close below the mid-Bollinger Band lines could increase the possibility of testing the 109.23 support level before moving below the 107.00 area.
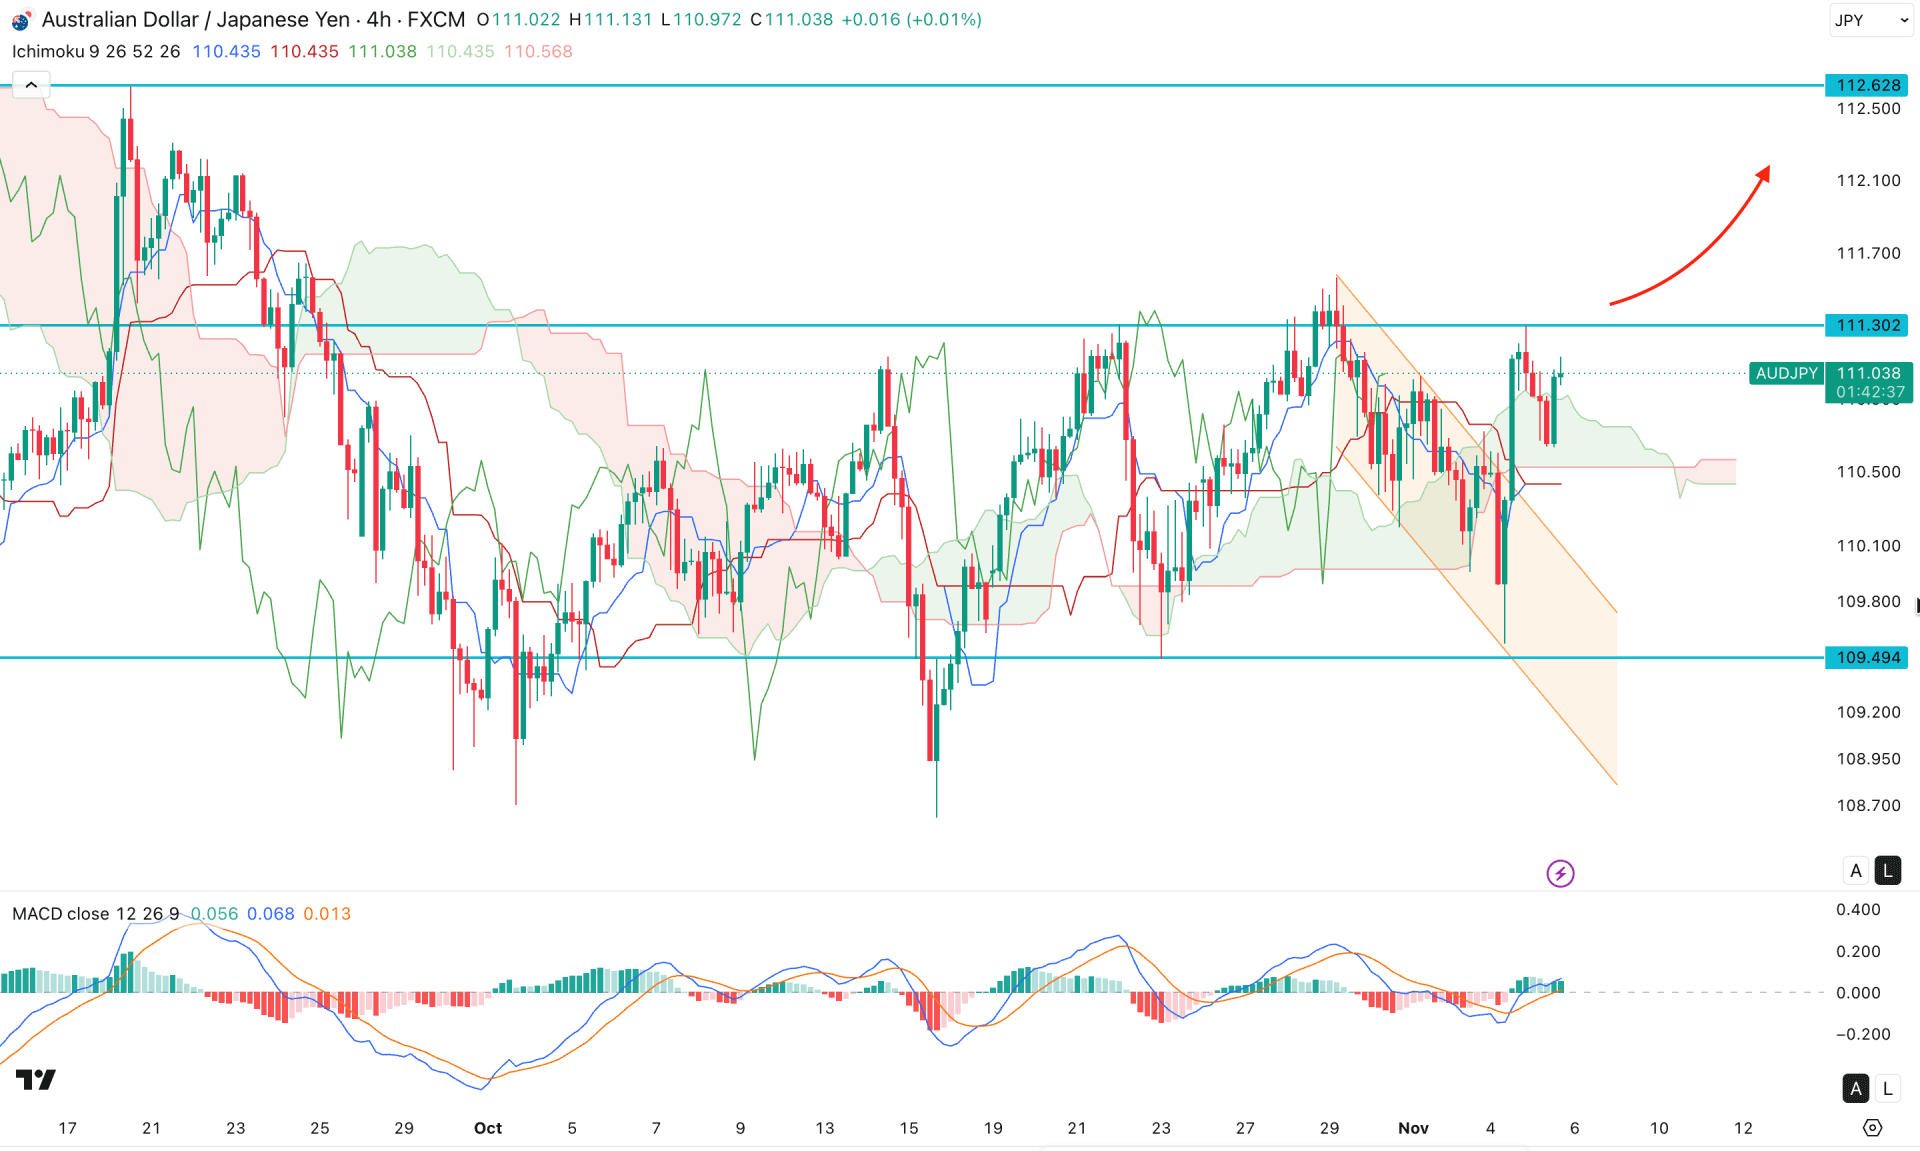
In the four-hour timeframe, AUDJPY is trading within an extreme corrective momentum. Multiple violations are visible in the near-term swing area. Most recently, price formed a strong sell-side liquidity sweep below the cloud support and then an immediate bullish breakout. Still, the price is trading below the 111.30 critical resistance line, maintaining sideways price action.
In the secondary indicator window, the MACD histogram rebounded, with multiple bars above the neutral area. Moreover, the signal line also formed a bullish crossover and moved just above the neutral area, signaling bullish momentum in the main price.
Based on the four-hour market structure, the ongoing momentum remains valid, with no sign of a transformation. On the bullish side, price is still holding momentum above the cloud support. In that case, a bullish break above the 111.30 level with a consolidation could increase the possibility of testing the 112.62 resistance level.
Alternatively, a range extension is possible as long as the price remains within the current rectangle pattern; in that case, immediate bearish pressure with a rebound below the Kijun support level could increase the possibility of testing the 109.49 support level.
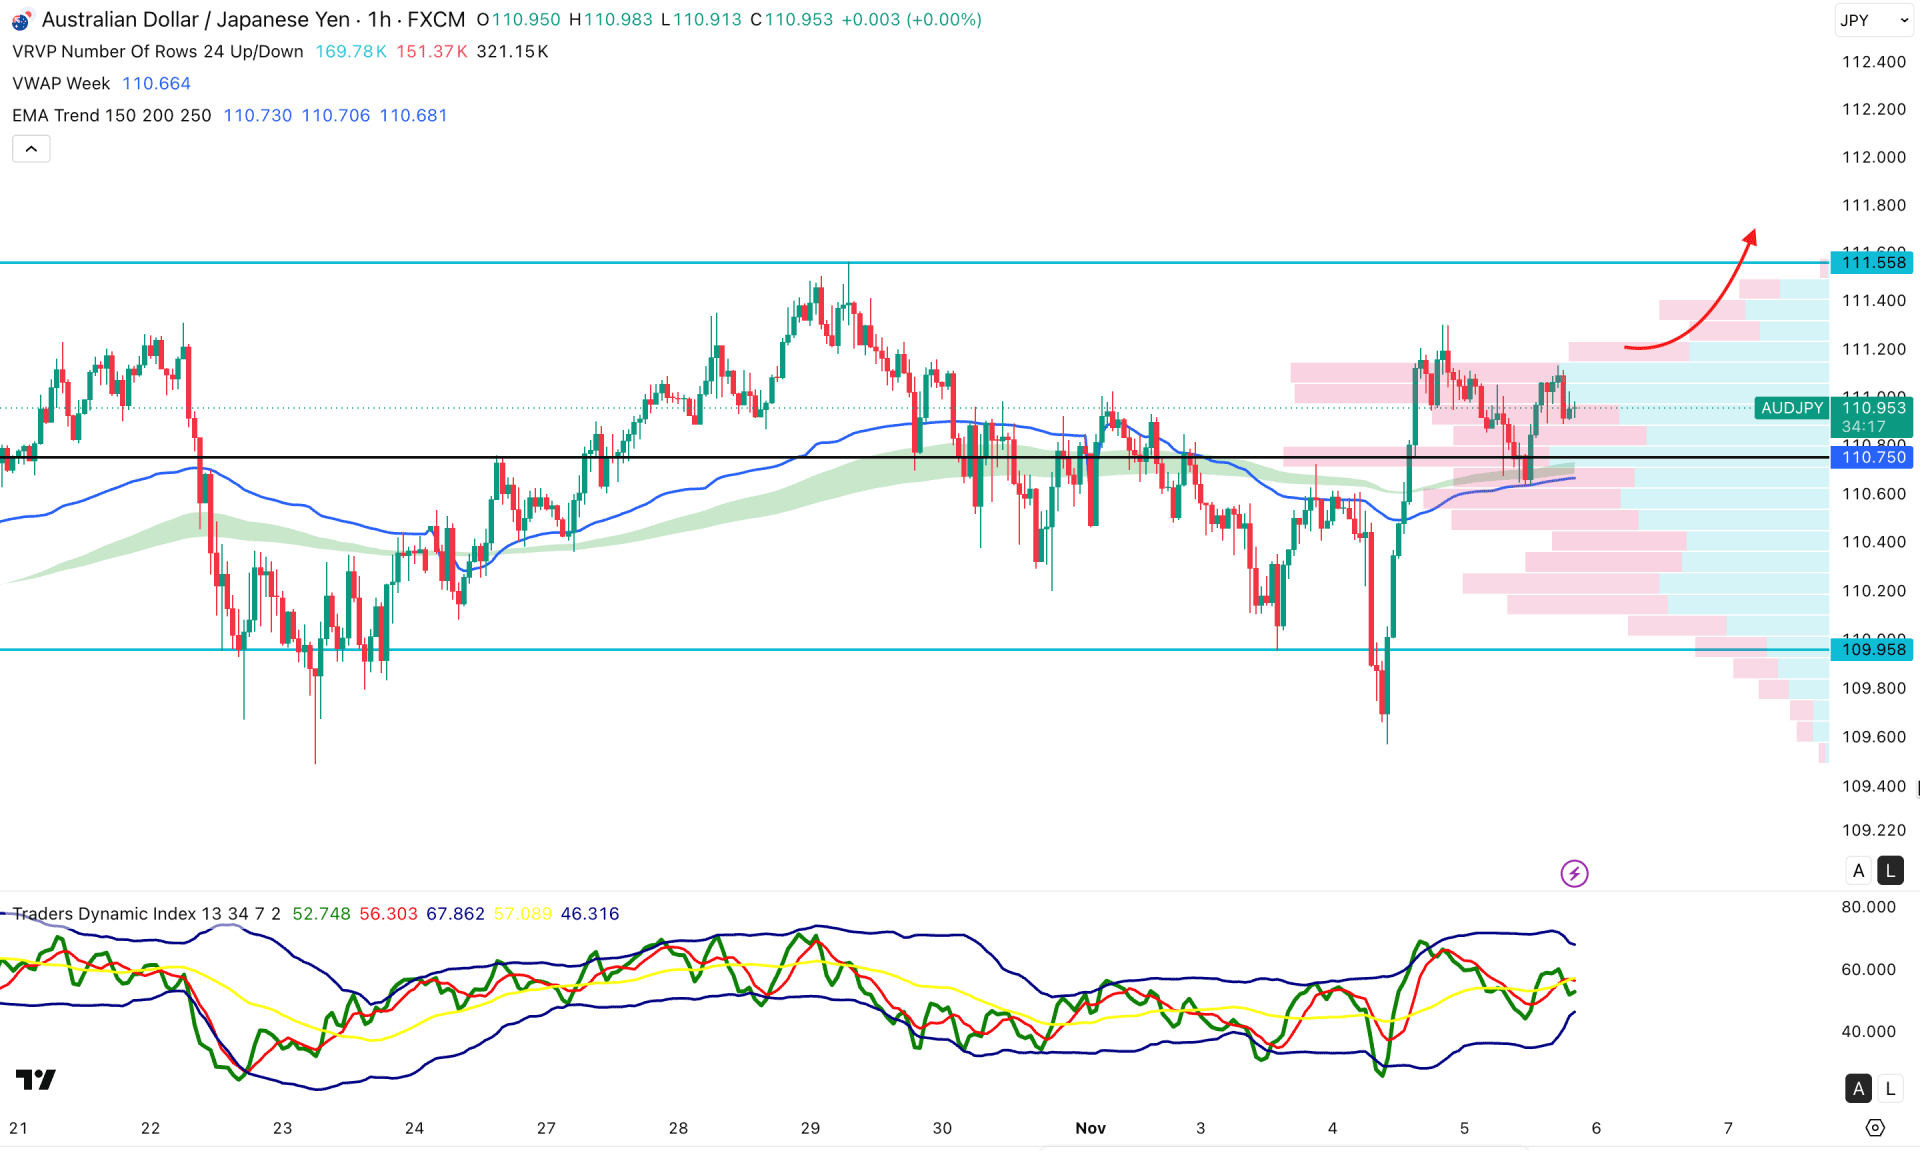
On the hourly timeframe, AUDJPY is trading within a bullish structure, as price recently rebounded higher from the 109.95 support level. Price is currently trading sideways above the exponential moving average wave. Moreover, the weekly VWAP line is behaving similarly, remaining below the current price with bullish pressure.
The indicator window tells a different story, with sideways momentum visible as the Traders Dynamic Index remains in the 50.00 neutral area.
Based on this market structure, investors should closely monitor how the price reacts at the current area. As long as the price hovers above the weekly VWAP level, we may anticipate a continuation at any time.
On the bullish side, breaking above the 111.12 swing high would be a bullish signal, targeting 111.55.
On the other hand, several barriers are present below. The current price area for immediate support is at the weekly VWAP line. A break below this line, followed by consolidation, could increase the chance of testing the 109.95 level.
Based on the overall market structure, AUDJPY is trading within a bullish structure, as the recent price failed to sustain the downside momentum from the existing yearly high level. Intraday price is extremely sideways, and a valid bullish rectangle breakout could validate the bullish rebound opportunity at any time.


