
Published: June 9th, 2021
In June, the Australian economy should show a better performance due to improved fundamental data from Australia and New Zealand. However, the sentiment changed as soon as the Iron ore price moved down amid the long-term US interest rate. As a result, the AUDJPY price moved down from the 85.79 level in May but failed to create a new swing low.
On the other hand, the NZ finance minister showed a hawkish tone regarding New Zealand’s economy, which came from the post-Covid scenario that is favorable for the economy. As New Zealand is the prominent partner of Australia, the growth in the NZ labor market may continue supporting the Australian Dollar.
However, investors will see a clearer view of the Australian economy after the RBA’s board meeting on July 6. In this meeting, the RBA will discuss whether they will extend the 3-year yield or not. Furthermore, the recent restriction on Australian imports by China might affect the AUD. Therefore, investors should keep a close eye on Chinese comments regarding commodity prices.
In the price chart, the AUDJPY price is moving up within a long-term bullish trend where the recent price is supported by a trendline. Can buyers’ hold their momentum?
Let’s see the future price direction from the AUDJPY technical analysis:
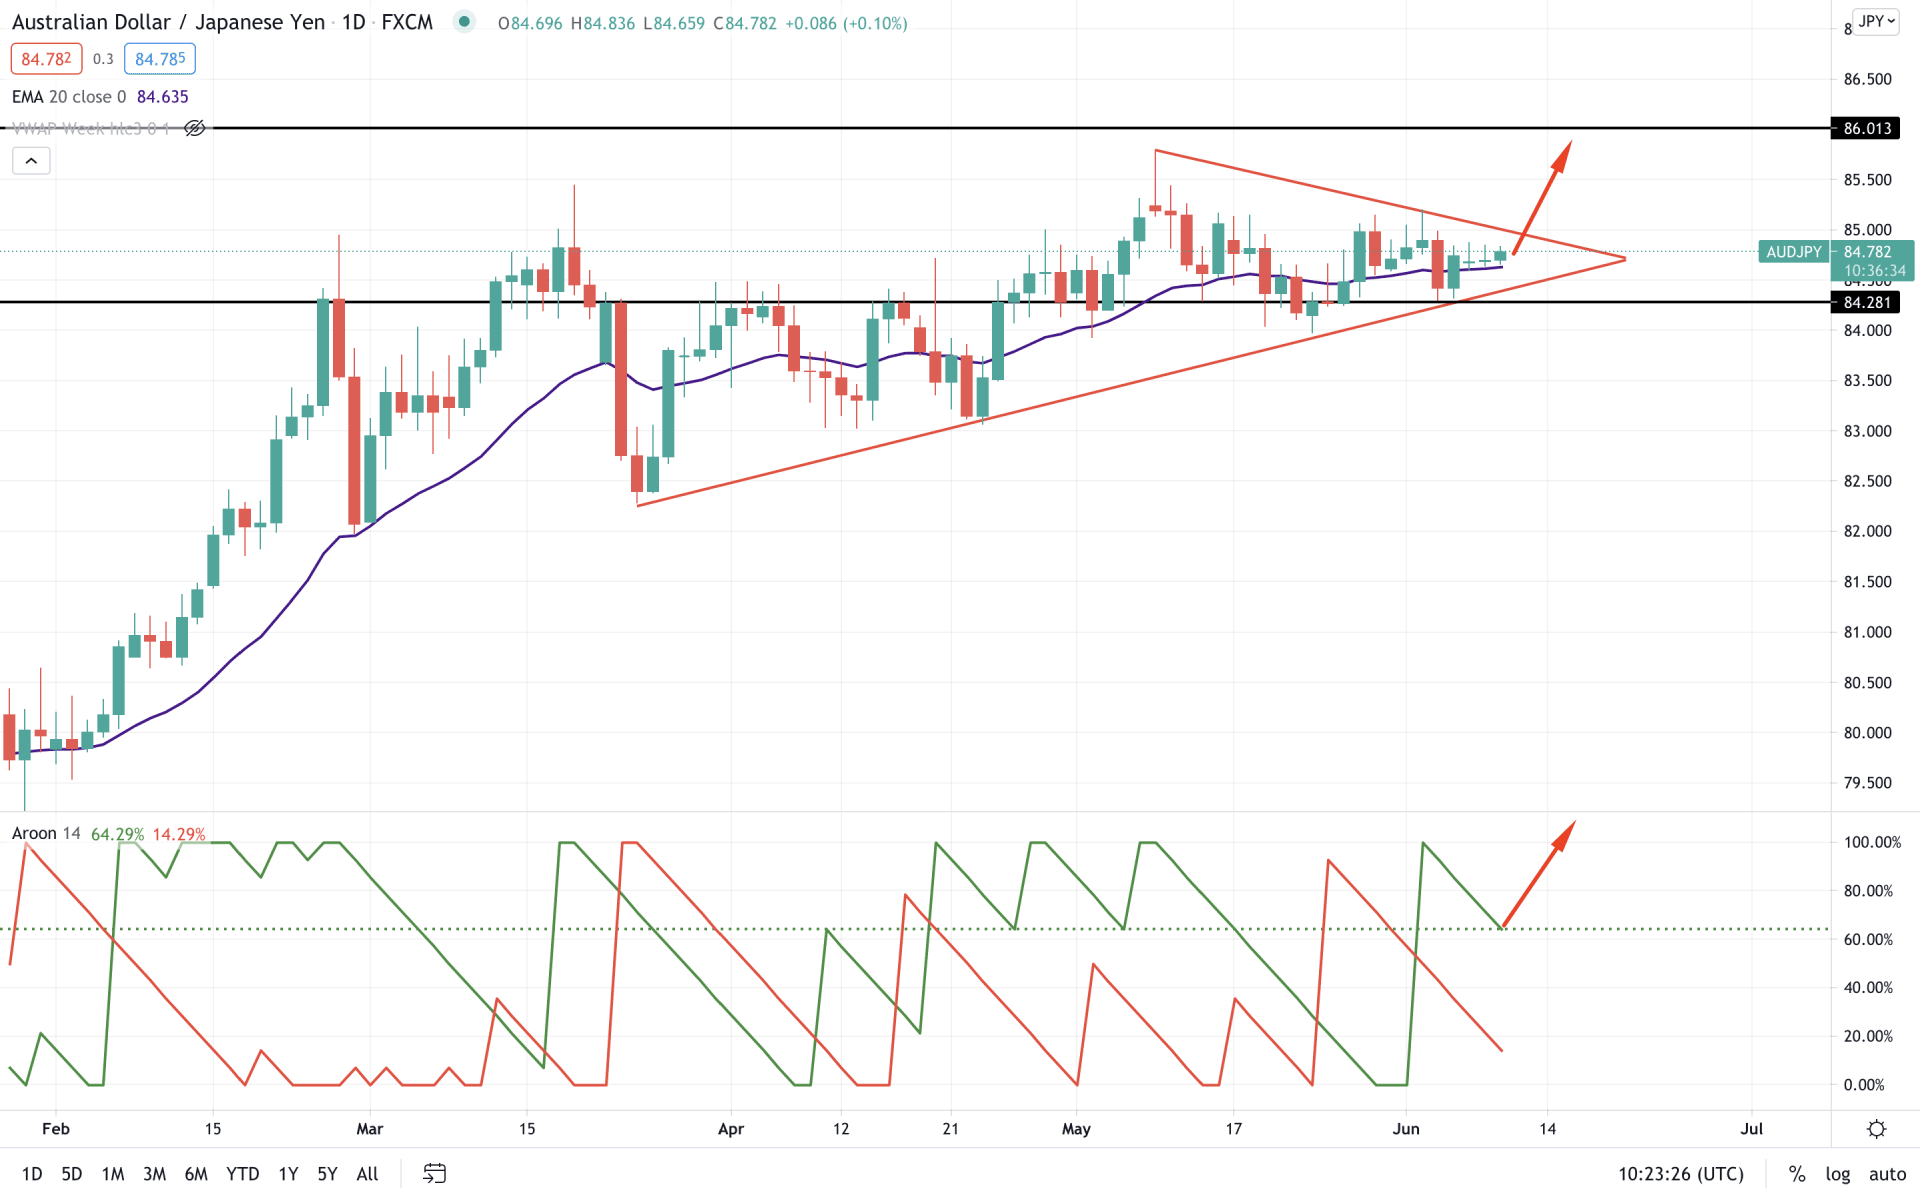
AUDJPY started the consolidation at the beginning of May and tested the multi-year high of 85.79. Later on, the price came down but failed to hold the momentum below the 84.28 event level. Therefore, as long as the price is trading above the 84.28 level, it has a higher possibility of continuing the bullish pressure.
In the above image, we can see the daily chart of AUDJPY, where dynamic 20 EMA supports the price, pointing out that short-term buyers’ are still interested in taking the price higher. Moreover, in the indicator window, Aroon Up reached 100 levels before the correction. Therefore, any upside pressure in the Aroon up would increase the bullishness to the price.
Moreover, the current price is squeezing its momentum to a symmetrical triangle where bulls are in favor. Therefore, any breakout above the 85.00 psychological level with a strong bullish daily candle may take the price higher towards the 86.00 level in the coming days.
On the other hand, a stable break below the 84.28 event level with a bearish daily close may ensure that the bearish triangle breakout is valid. In that case, the price may come lower towards 83.00 swing low.
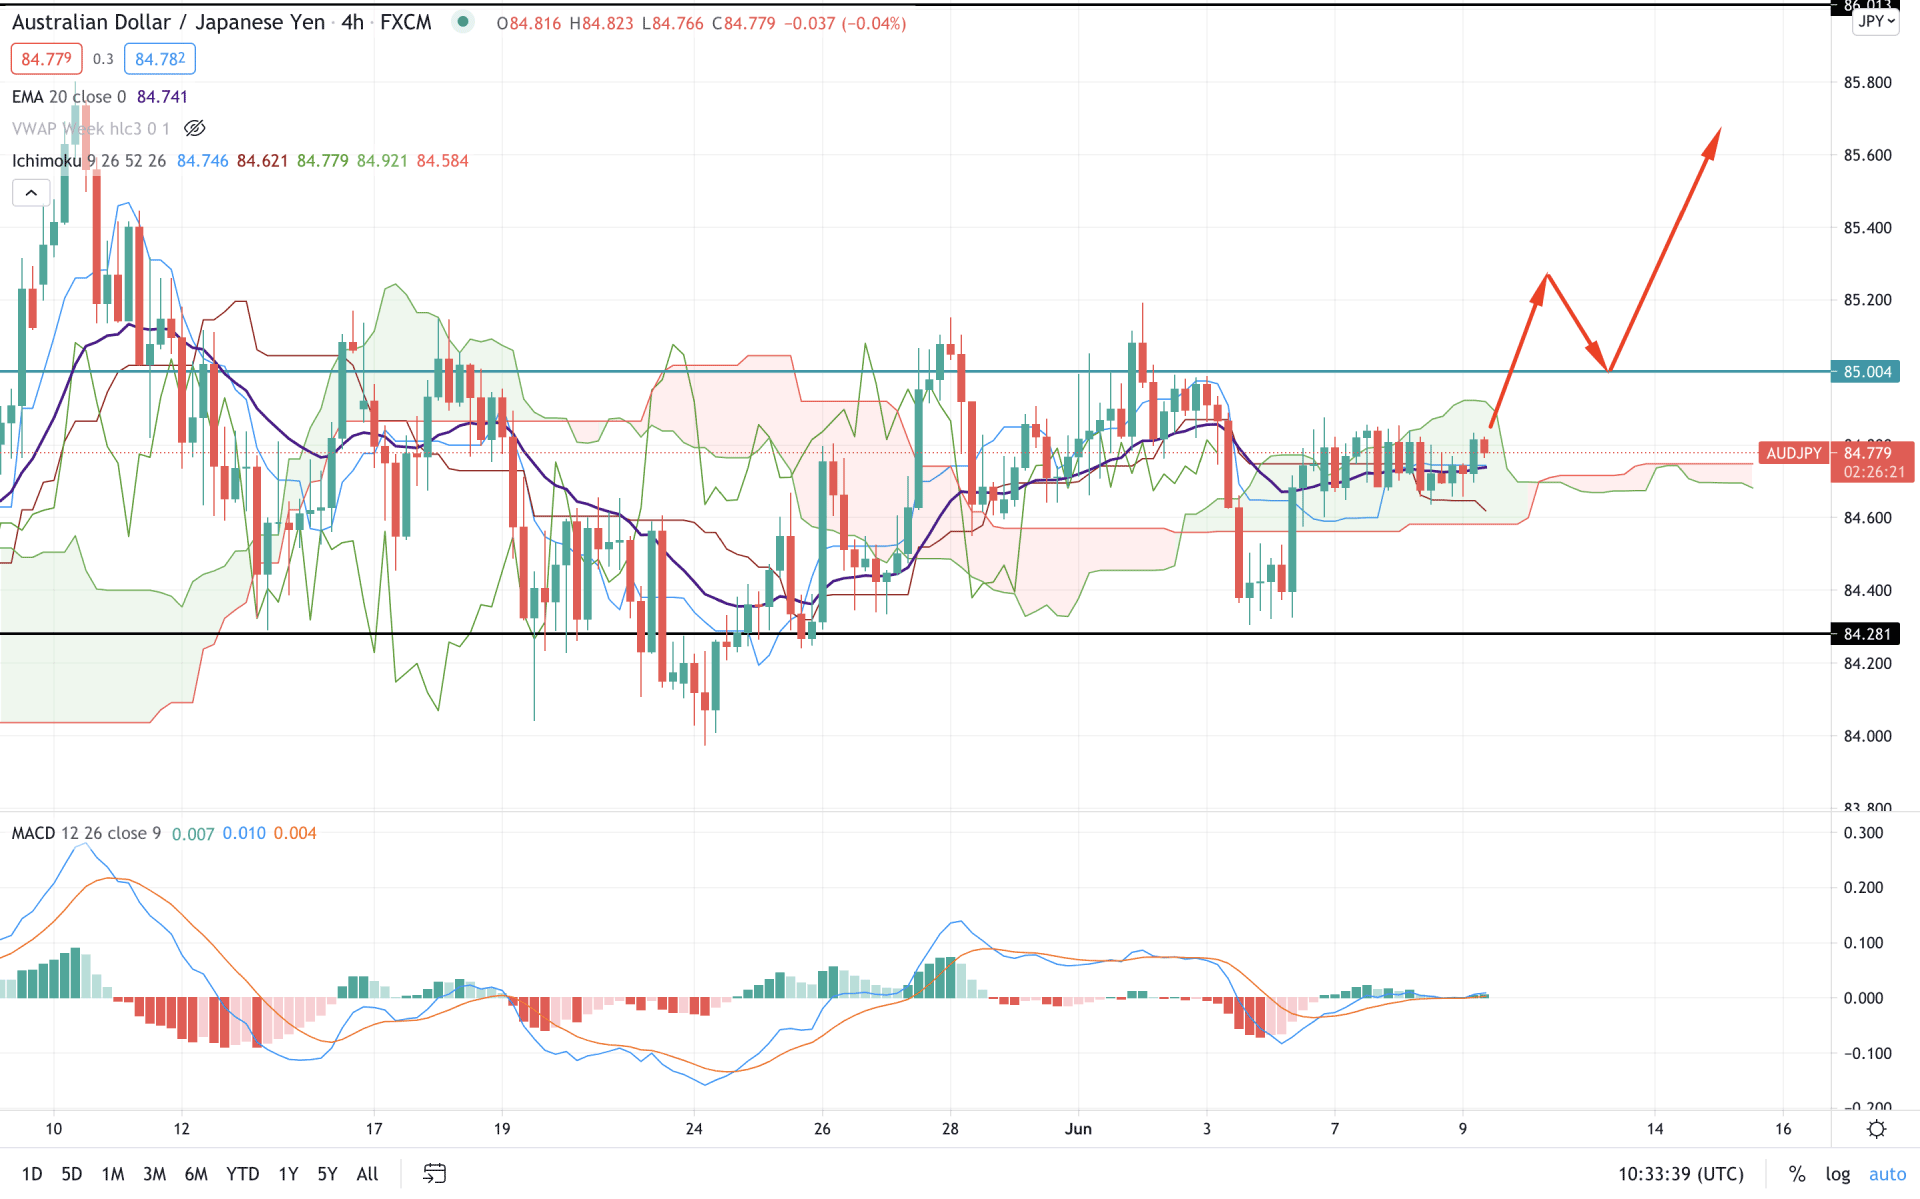
Based on the Ichimoku Kinko Hyo on the H4 chart, the price is trading within the Kumo Cloud, indicating indecision to the momentum. However, at the beginning of June, the price broke below the Kumo Cloud but failed to hold the momentum. Therefore, the recent failure of sellers is a sign that bulls are still active to the price.
In the above image, we can see that the price made a strong bullish H4 close above the dynamic Tenkan Sen and Kijun Sen. Therefore, if the price breaks above the near term Kumo resistance, the Chikou Span will move above the price. As a result, the price may move higher with an impulsive bullish pressure towards 85.40 and 86.00 levels.
On the other hand, sellers need to take the price lower below the 84.28 level to consider the current bullish pressure invalid.
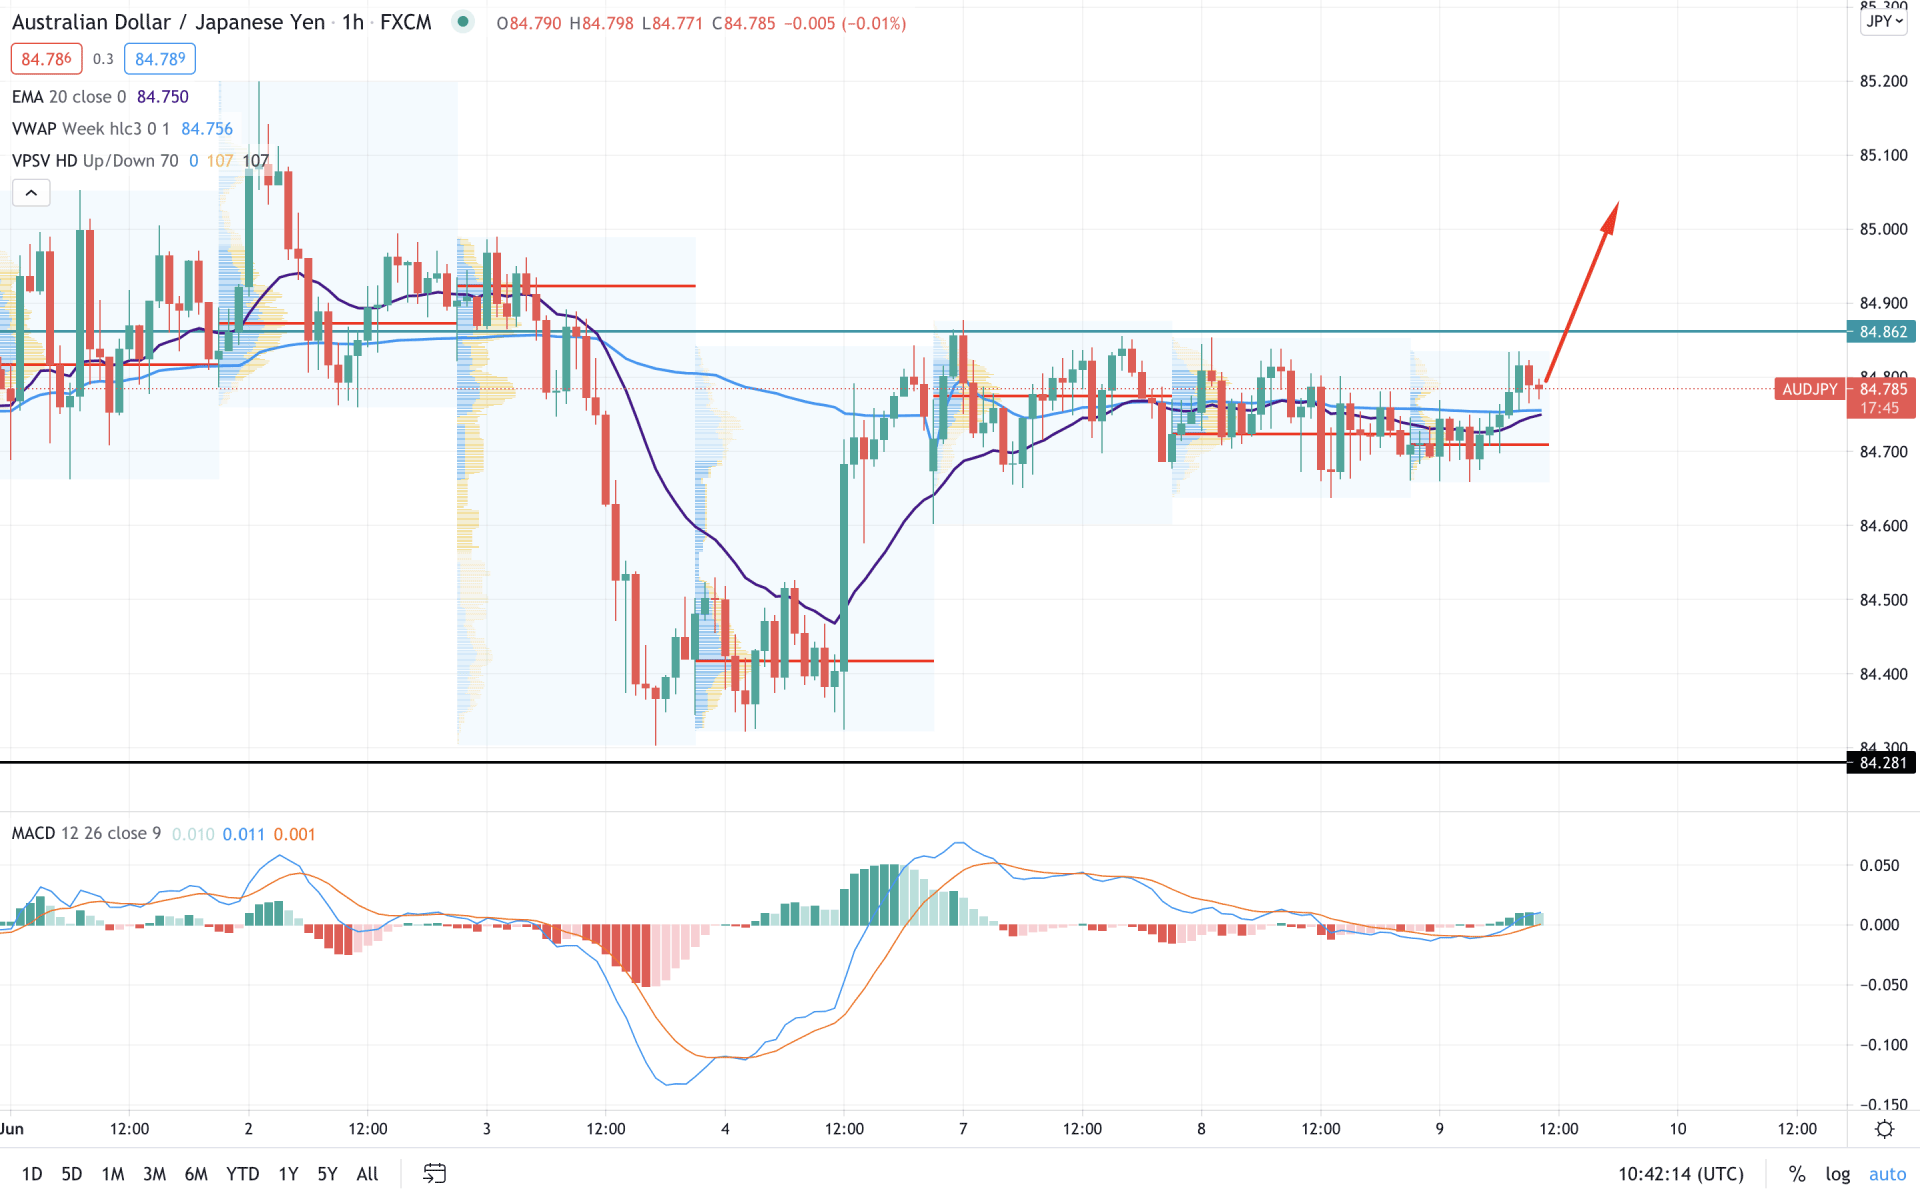
In the intraday chart, AUDJPY plays with the range where the most recent momentum took the price higher above the intraday high volume level of 84.70. Therefore, as the price is near the intraday resistance at 84.86, any bullish solid breakout above this level may create a substantial bullish possibility.
In the above image, we can see the H1 chart of AUDJPY, where the price is getting support from the dynamic 20 EMA and vwap. Therefore, as the price had an H1 close above the vwap level, it may move higher in the coming sessions.
On the other hand, MACD is still bullish where the Histogram remained above the zero lines. Therefore, any new high in MACD Histogram would increase the bullishness to the price.
As of the above discussion, we can say that AUDJPY has a higher possibility of breaking above the current symmetrical triangle pattern based on the buyers’ pressure in the intraday chart.
On the other hand, the 84.28 will work as a major trend changer point where any strong bearish daily close below this level would take the price lower towards 83.00 level.


