
Published: April 27th, 2022
In the latest meeting minutes, RBA showed a hawkish picture indicating the possibility of a rate hike in the coming quarters. However, the bank showed interest in remaining data-dependent to collect additional evidence regarding inflation and rising labor costs. In the upcoming data, the inflation report for Q1 came within banks' 2% to 3% targeted zone. Moreover, the wages report will come in on 18 May when the current anticipation is not to come above the 3% desired level. Until these reports come, AUD bears may take a chance by providing a discounted price to bulls for making another rally.
In Japan, BOJ Governor Kuroda stated that the weaker Yen might work as a positive factor for the Japanese economy. As a result, the bank showed no interest in getting away from the monetary easing program. On the other hand, the 10Y JGB moved rapidly to the 0.25% level, indicating further weakness in JPY. This week’s BOJ meeting may come with no change in decisions but any thought on rising inflation would be a price driving factor for JPY pairs.
Let’s see the future price direction from AUDJPY technical analysis.
The long-term bullish rally in the AUDJPY pair started at the beginning of 2022 showed sellers' interest in the weekly chart from a strong inverted hammer candlestick at the 95.74 resistance level. Following the weekly close, the price moved lower immediately this week and moved below the 92.39 support level. Moreover, the weekly RSI level moved below the overbought 70 level while MACD started to lose its bullish momentum. Therefore, as long as the price trades within the weekly hammer candlestick, further downside pressure may come.
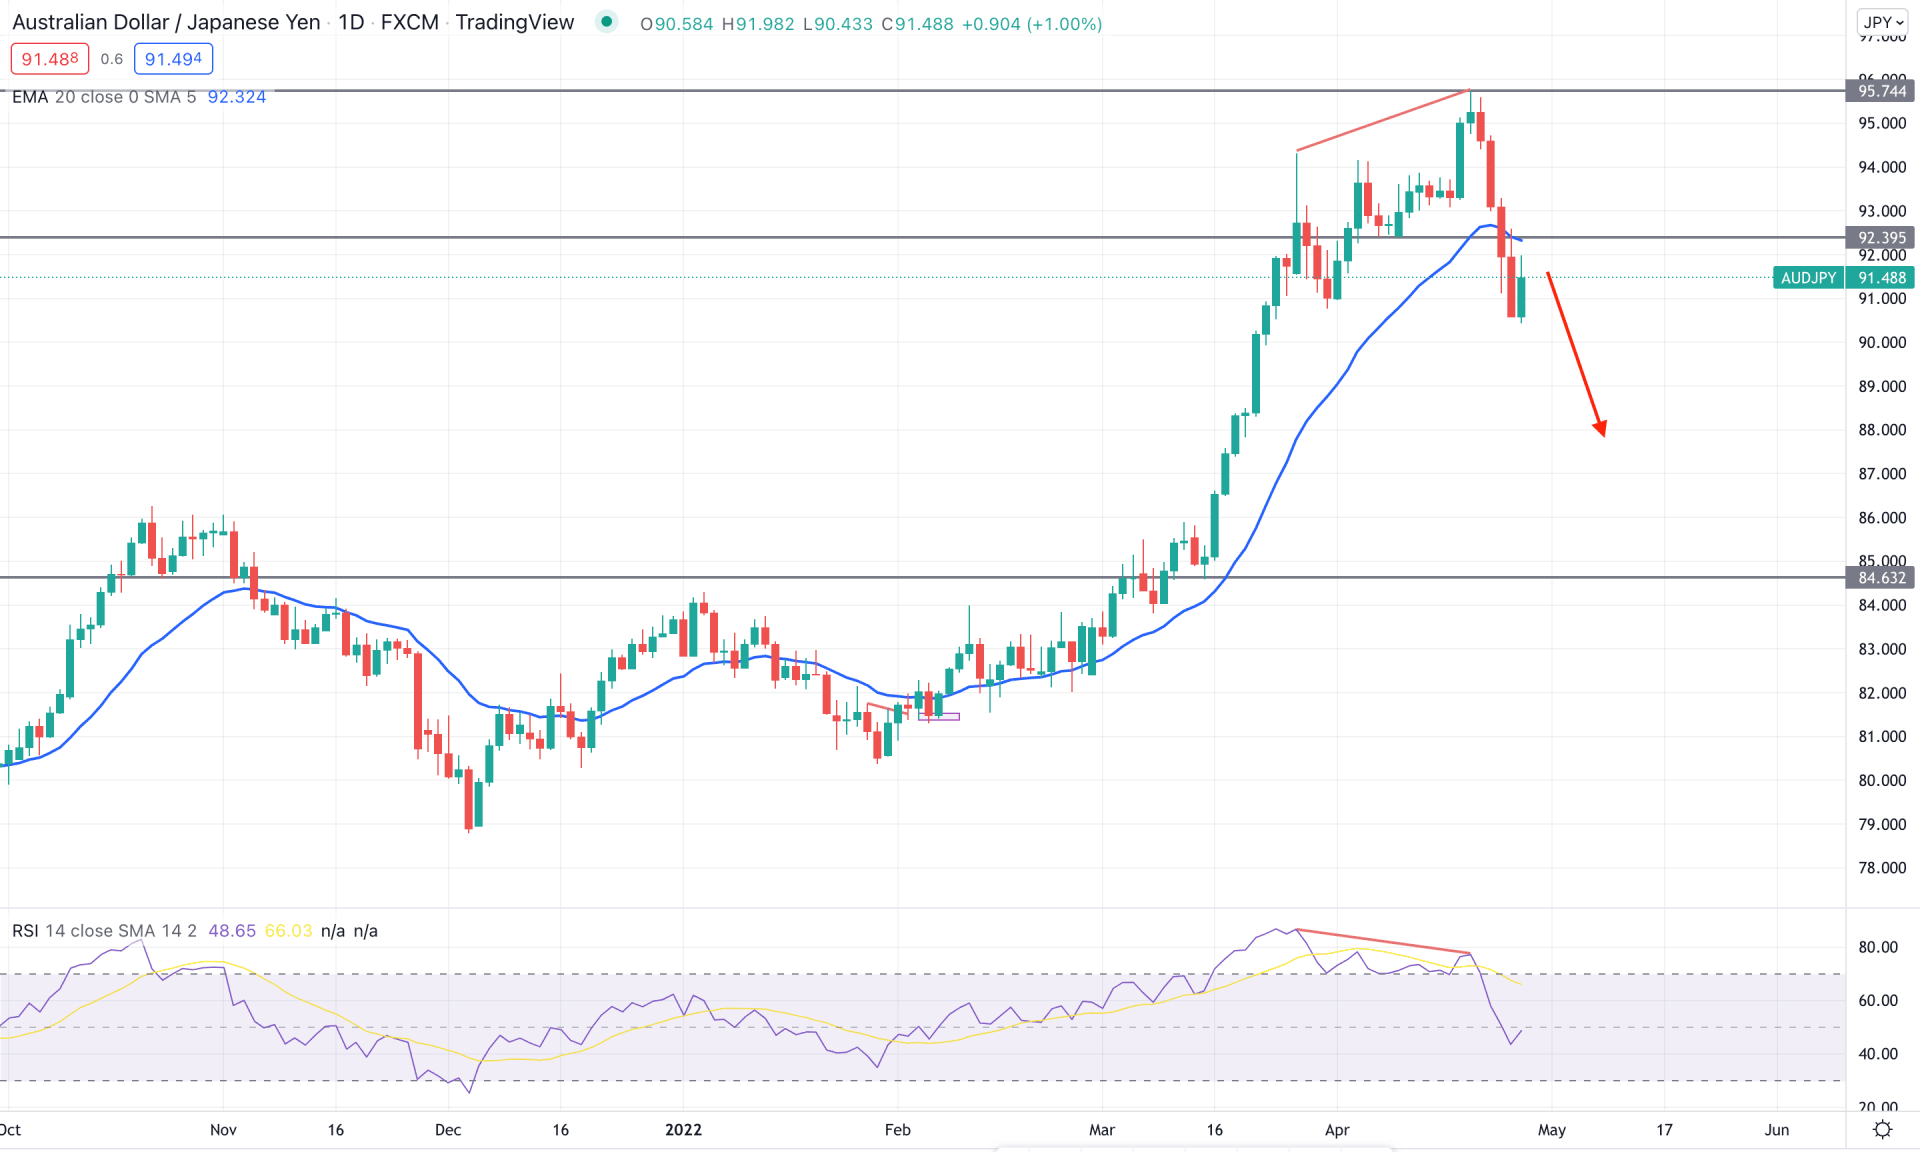
The above image shows the daily chart of AUDJPY where the price formed CHOCH at 75.74 swing high with a bearish break of structure below the 92.39 swing low. Moreover, the selling pressure is backed by divergence with RSI while the current price trades below the dynamic 20 EMA. As the RSI level moved below the neutral 50 level, investors may expect the RSI to move down to the 30 level with selling pressure in the price.
Based on the daily structure, investors may consider the upcoming price direction as bearish as long as the daily price trades below the dynamic 20 EMA. In that case, the main aim is to test the 84.63 level, which is the near-term support level for this pair. On the other hand, as the broader trend is still bullish an immediate rebound with a bullish daily candle above the 92.39 would open a bullish opportunity toward the 96.00 area.
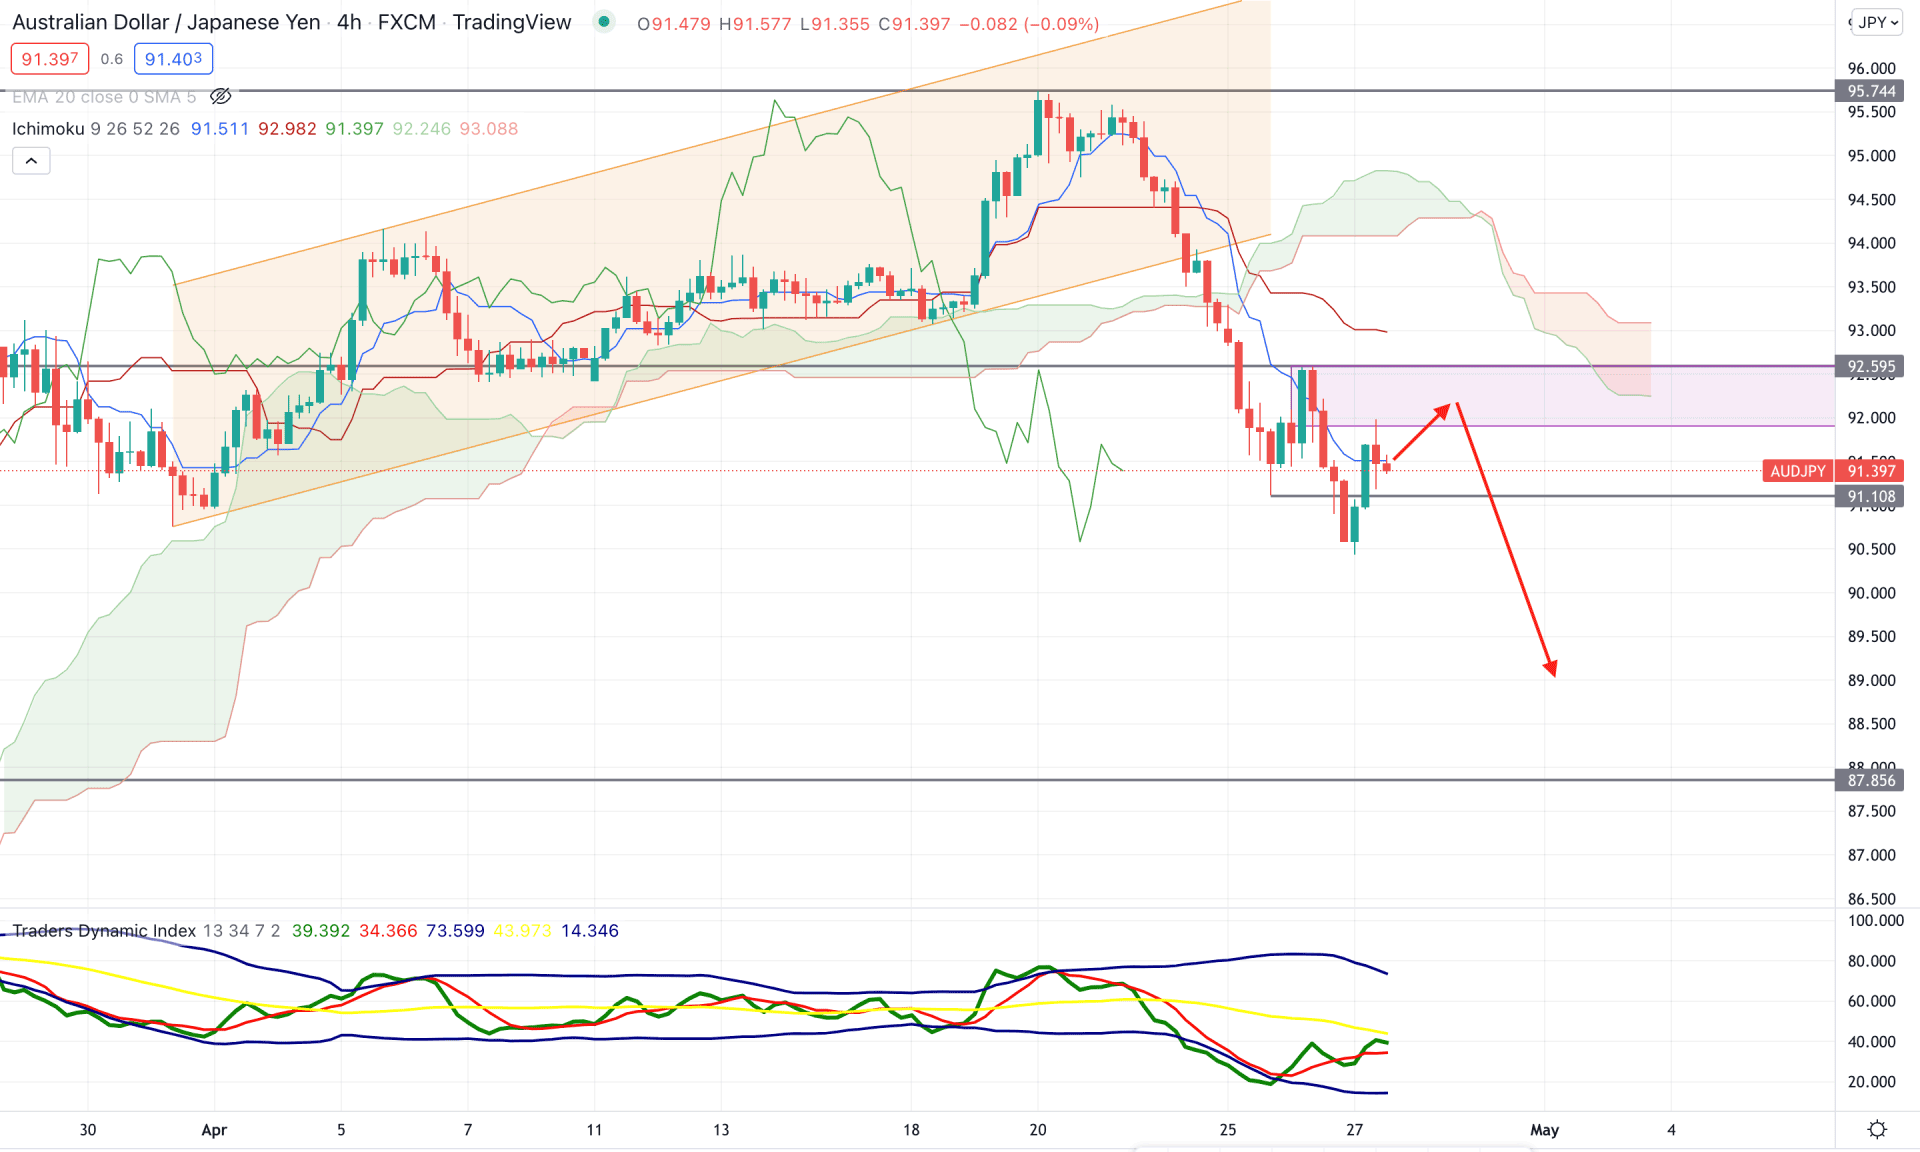
According to the Ichimoku Cloud, the AUDJPY H4 chart trades lower as the most recent price moved below the Kumo Cloud with an impulsive bearish pressure. Moreover, the price formed a base at 92.59 level before making another swing low. Meanwhile, the future cloud is bearish as the Senkou Span A is below the Senkou Span B, indicating further bearishness to the price.
The above image shows how the price remained steady bearish below the dynamic Kijun Sen and Tenkan Sen where the recent break of structure below the 91.10 level increased the bearish possibility towards the 87.85 level. In the indicator window, the TDI line remained corrective after a bearish pressure and held a strong momentum below the neutral 50 level. In that case, if the TDI line remained below the 50 level, any selling pressure in the price chart would extend the momentum in the coming hours.
Based on the H4 structure, any bearish pressure from 92.00 to 92.60 area has a higher possibility of opening a bearish opportunity in this pair where the primary aim is to test the 87.85 level. On the bullish side, an h4 close above the 93.00 level would increase the long opportunity towards the 95.00 area.
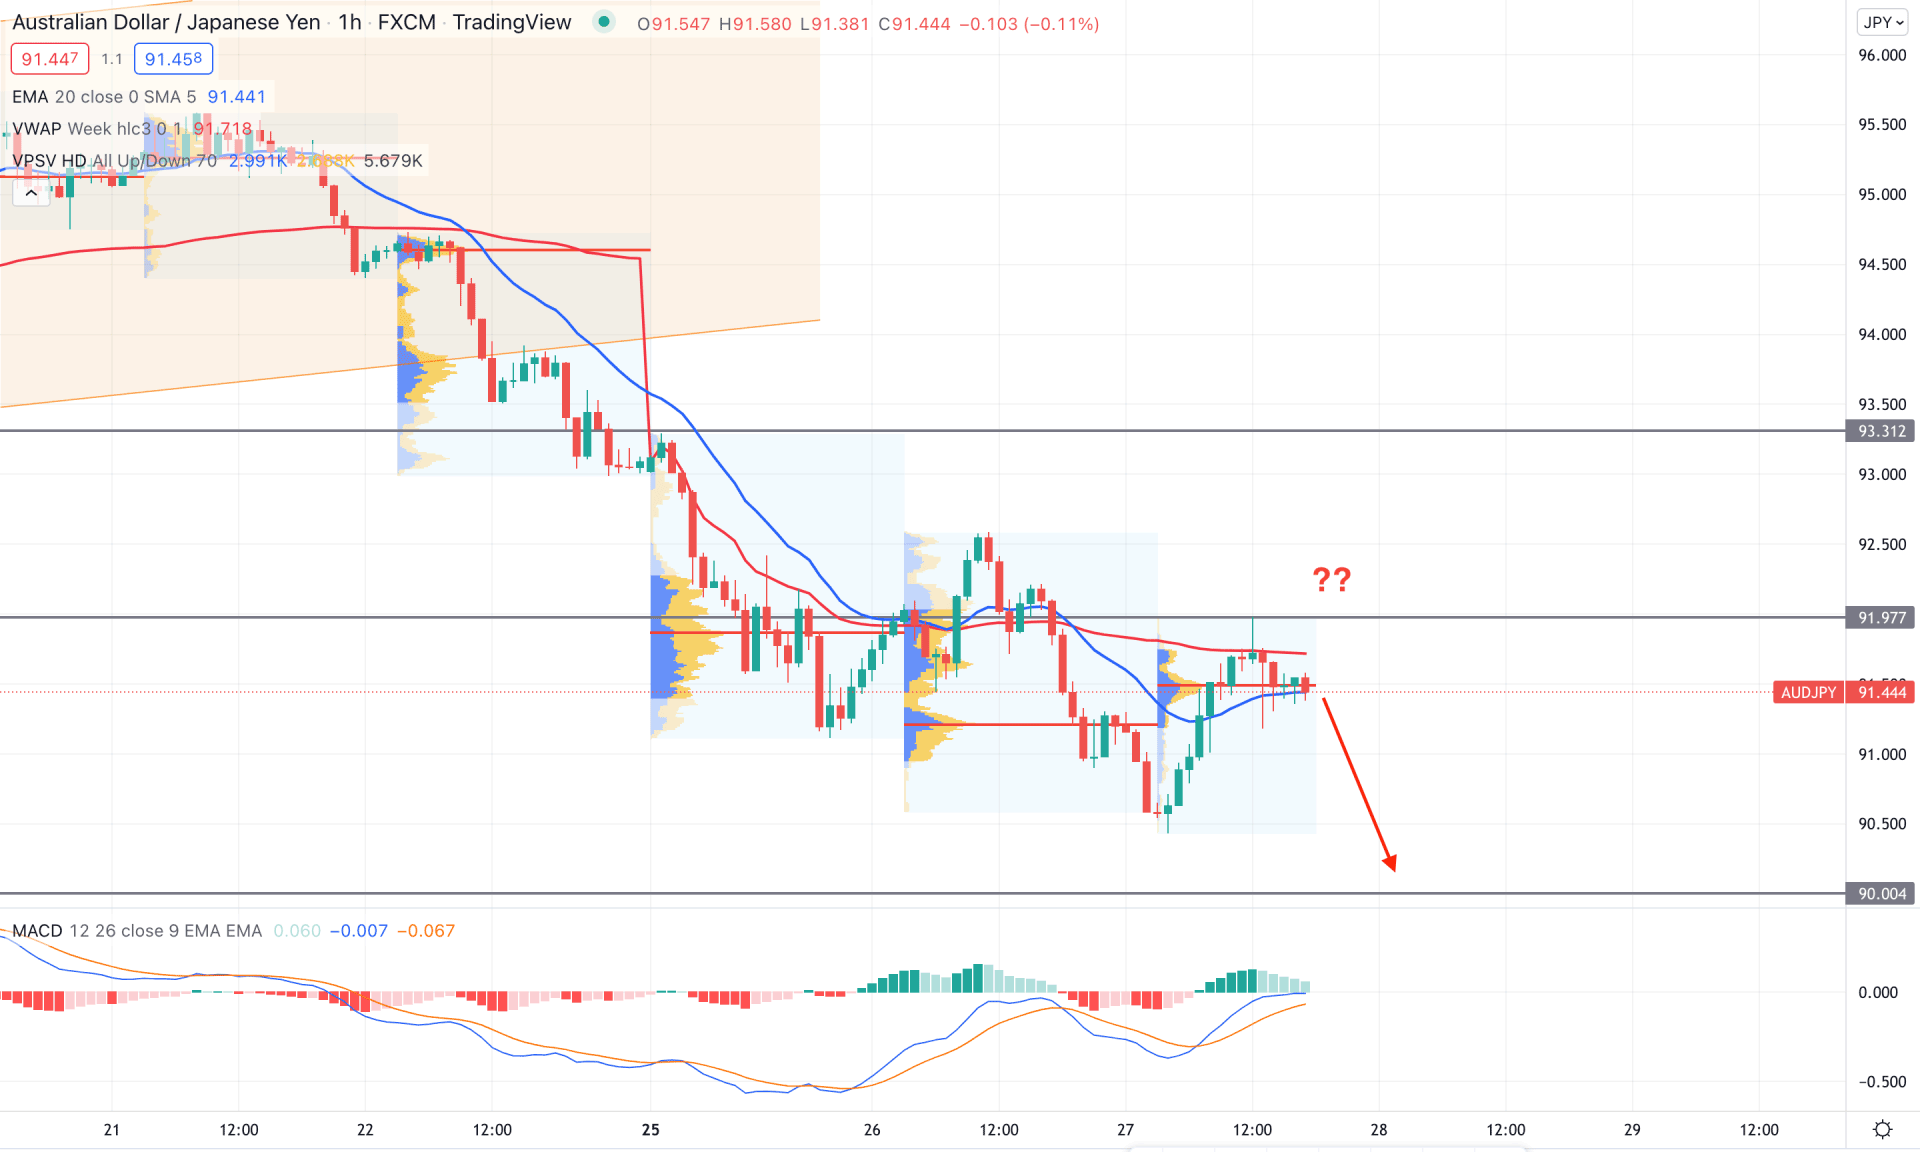
In the intraday chart, AUDJPY trades within a corrective structure where the most recent high volume level is at 91.47 level. Therefore, the primary approach is to find a bearish opportunity from 91.47 to 92.00 area with additional confirmations. The dynamic 20 EMA is close to the current price whereas any H1 candle below it would be a bearish factor for this pair.
The above image shows how the MACD Histogram loses its bullish momentum and squeezes to the neutral level while the dynamic weekly VWAP is above the price. In that case, any selling pressure in the intraday chart from 91.40 to 92.00 area would be a bearish opportunity toward the target of the 90.00 level. On the other hand, the break above the 92.50 level would eliminate the current market structure and initiate a consolidation.
Based on the current multi-timeframe analysis, AUDJPY has a higher possibility of extending the bearish pressure in the coming days where the main aim is to test the 84.93 support level in the higher timeframe. Moreover, investors should remain cautious about the lower timeframe price action before going short in this pair.


