
Published: July 26th, 2023
The Australian Bureau of Statistics (ABS) reported on Wednesday that the country's Consumer Price Index (CPI) increased by 0.8% during the second quarter of 2023. This growth compared to a rise of 1.4% in the first quarter and fell short of market expectations of 1.0% growth.
In spite of the fact that there is still a long way to go in combating inflation, progress is being made in the correct direction; as reassured by Australian Treasurer Jim Chalmers, the Australian dollar later recovered some of its losses.
In contrast, the Japanese Yen (JPY) received a modest boost following the publication of the Cabinet Office's monthly report. It indicates an improvement in business sentiment for the month of July, the first positive change in seven months. In addition, Japan maintained that the economic recovery was proceeding at a moderate rate.
Meanwhile, the International Monetary Fund (IMF) warned about Japan's rising inflation and urged the Bank of Japan (BoJ) to abandon its easy-money policy. On Wednesday, Governor Kazuo Ueda of the Bank of Japan reaffirmed that the central bank will maintain its accommodative monetary stance.
In addition, he emphasized the stability of the long-term yield rate under the yield curve control (YCC) policy.
The outlook represents a weakness for the JPY as the accommodative JPY could bring the AUDJPY price up. Let’s see the complete outlook from the AUDJPY technical outlook:
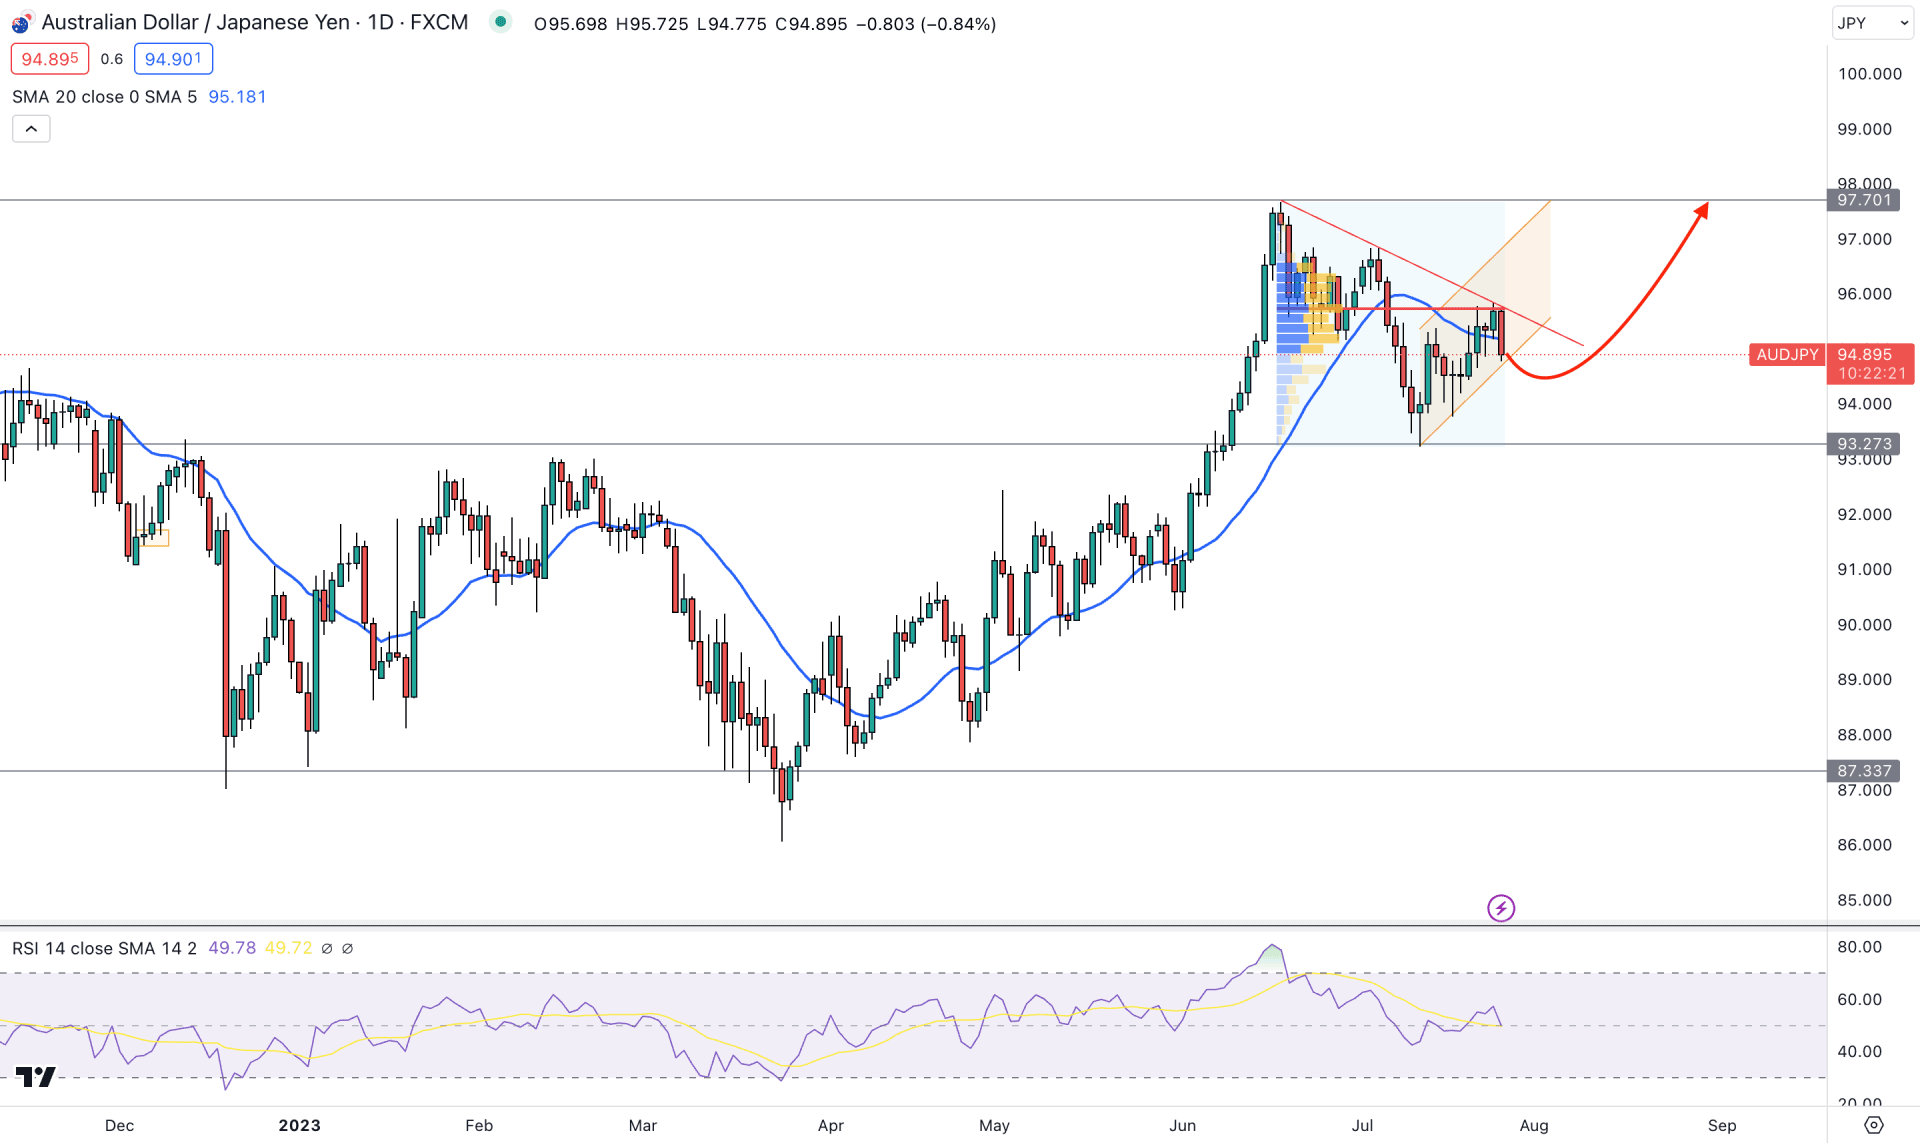
The broader market direction for AUDJPY is bullish as the recent price shows several higher high formations in the daily chart. Also, there is no sign of exhaustion at recent resistance levels. It is a sign that bulls aren't done with the price and can regain momentum at any time.
In the higher timeframe price action, the recent upward momentum is supported by the Strong bullish monthly candle, where the current candle moves sideways as an inside bar. Also, the weekly price shows a test of a multi-week high from where an extended bearish correction is possible.
After testing the 97.70 level, bears have become active in the market, where the most recent price shows a new lower low formation at the 93.27 level. However, a bullish rebound came after the day but failed to show enough momentum to extend the trend. Bulls' weakness is visible from the latest high volume level, which is above the current price.
Based on the visible range high volume level since the 19 June 2023 peak, the most active level was at 95.75 level, which is above the current price. Moreover, a bullish correction is present with an ascending channel formation, where a bearish break could lower the price in the coming days.
In the main chart window, the dynamic 20-day EMA is above the current price, backed by buyers’ failure to hold the price above it. Moreover, the 14-period Relative Strength Index (RSI) moved below the neutral 50.00 line, which increased the possibility of reaching the 30.00 area.
Based on this outlook, AUDJPY could show bearish pressure in the coming days, but it might become invalidated at any time. An emerging trendline above the high volume level indicates a trend line liquidity, which needs to fill before forming a sharp fall.
In that case, a bullish rebound after the channel breakout and a D1 candle above the trendline resistance could increase the price towards the 97.70 level.
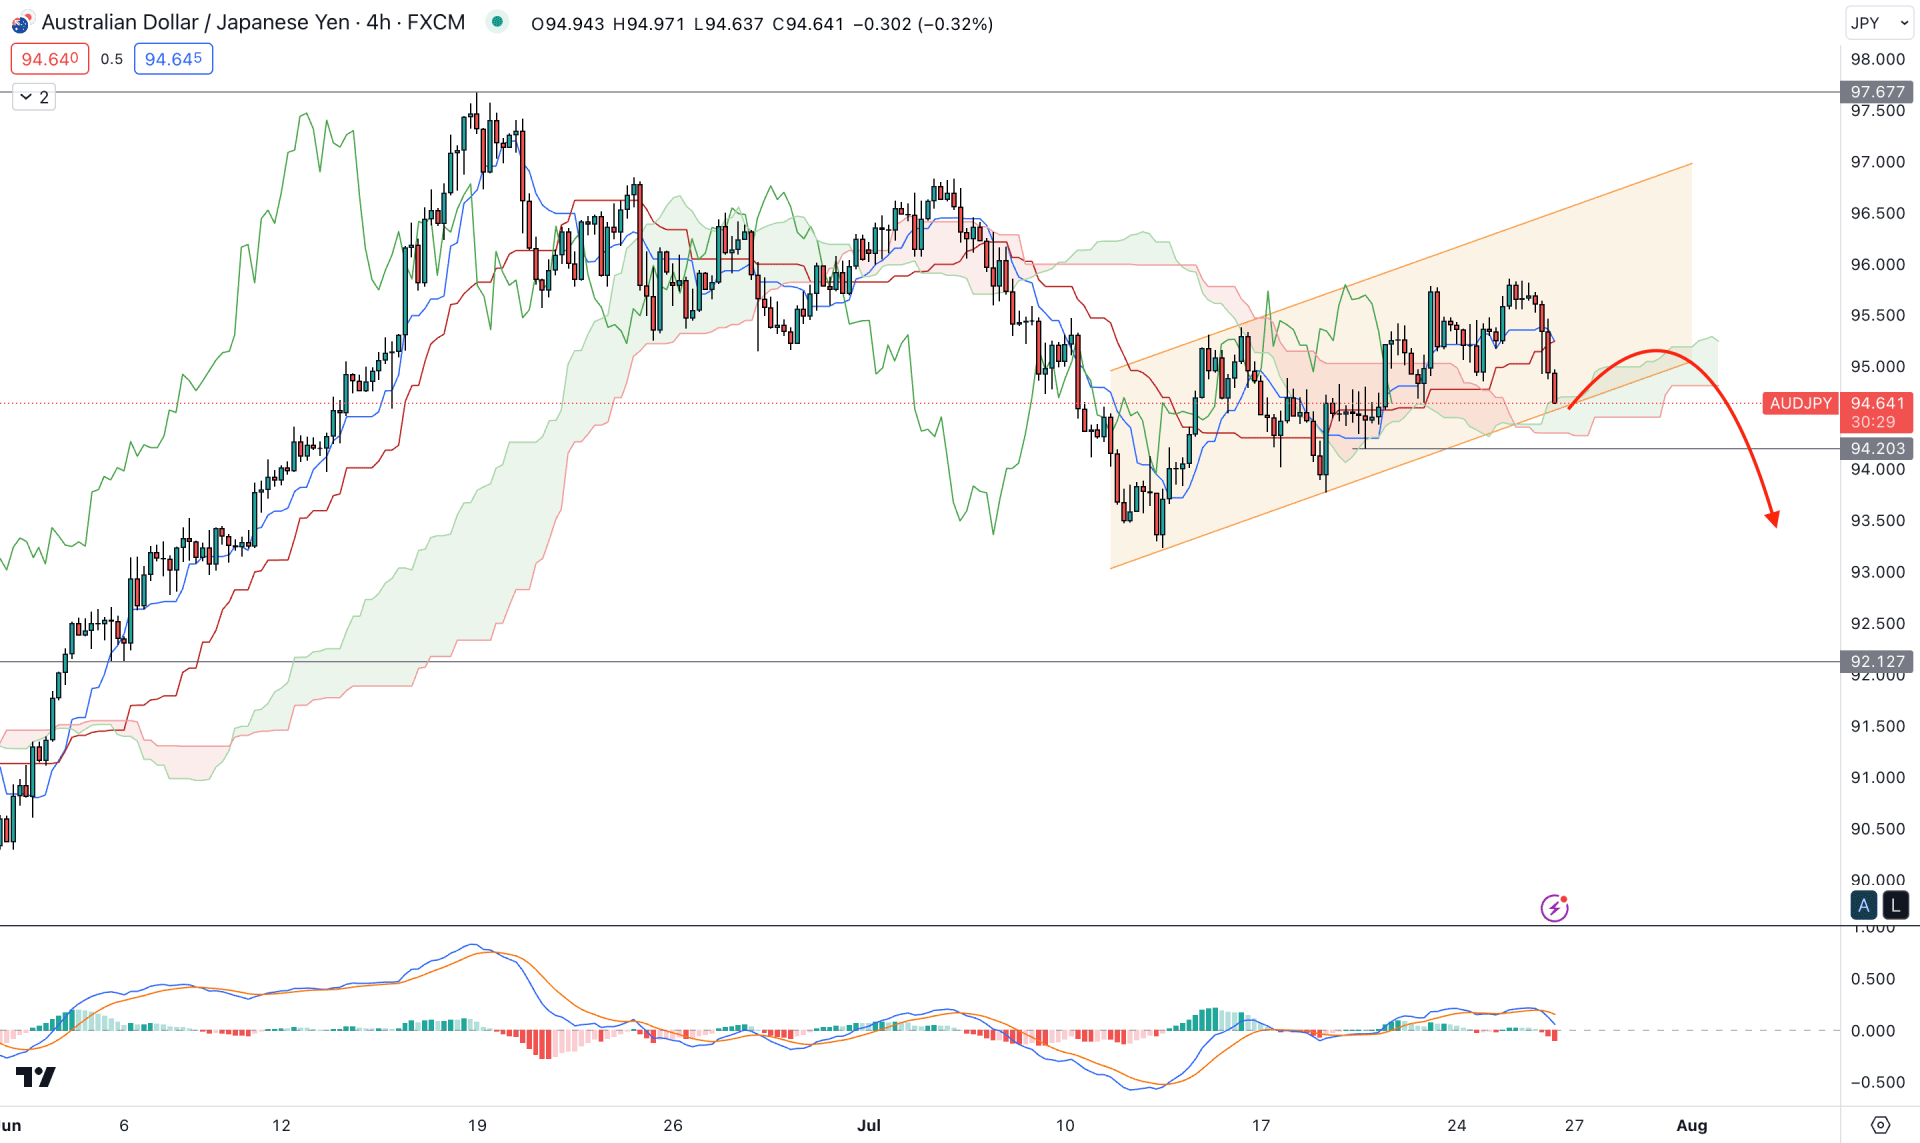
In the H4 timeframe, the broader market direction is corrective, as the current price is trading sideways within a descending channel. Although the current price is trading above the Kumo Cloud, there is no sign of a strong buyers’ presence in the market from the price action.
The Ichimoku Kumo Cloud shows a strong bullish possibility in the market as the current Senkou Span A is above the Senkou Span B. However, a bearish H4 candle is seen below the dynamic Kijun Sen with a bearish MACD Histogram.
Based on the H4 outlook, investors might expect downside pressure if a new H4 candle comes below the 94.20 support level. In that case, the downside momentum might extend towards the 91.50 level.
The alternative approach is to look for a bullish rejection from the 93.00 to 91.20 area before aiming for the 97.00 key psychological level.
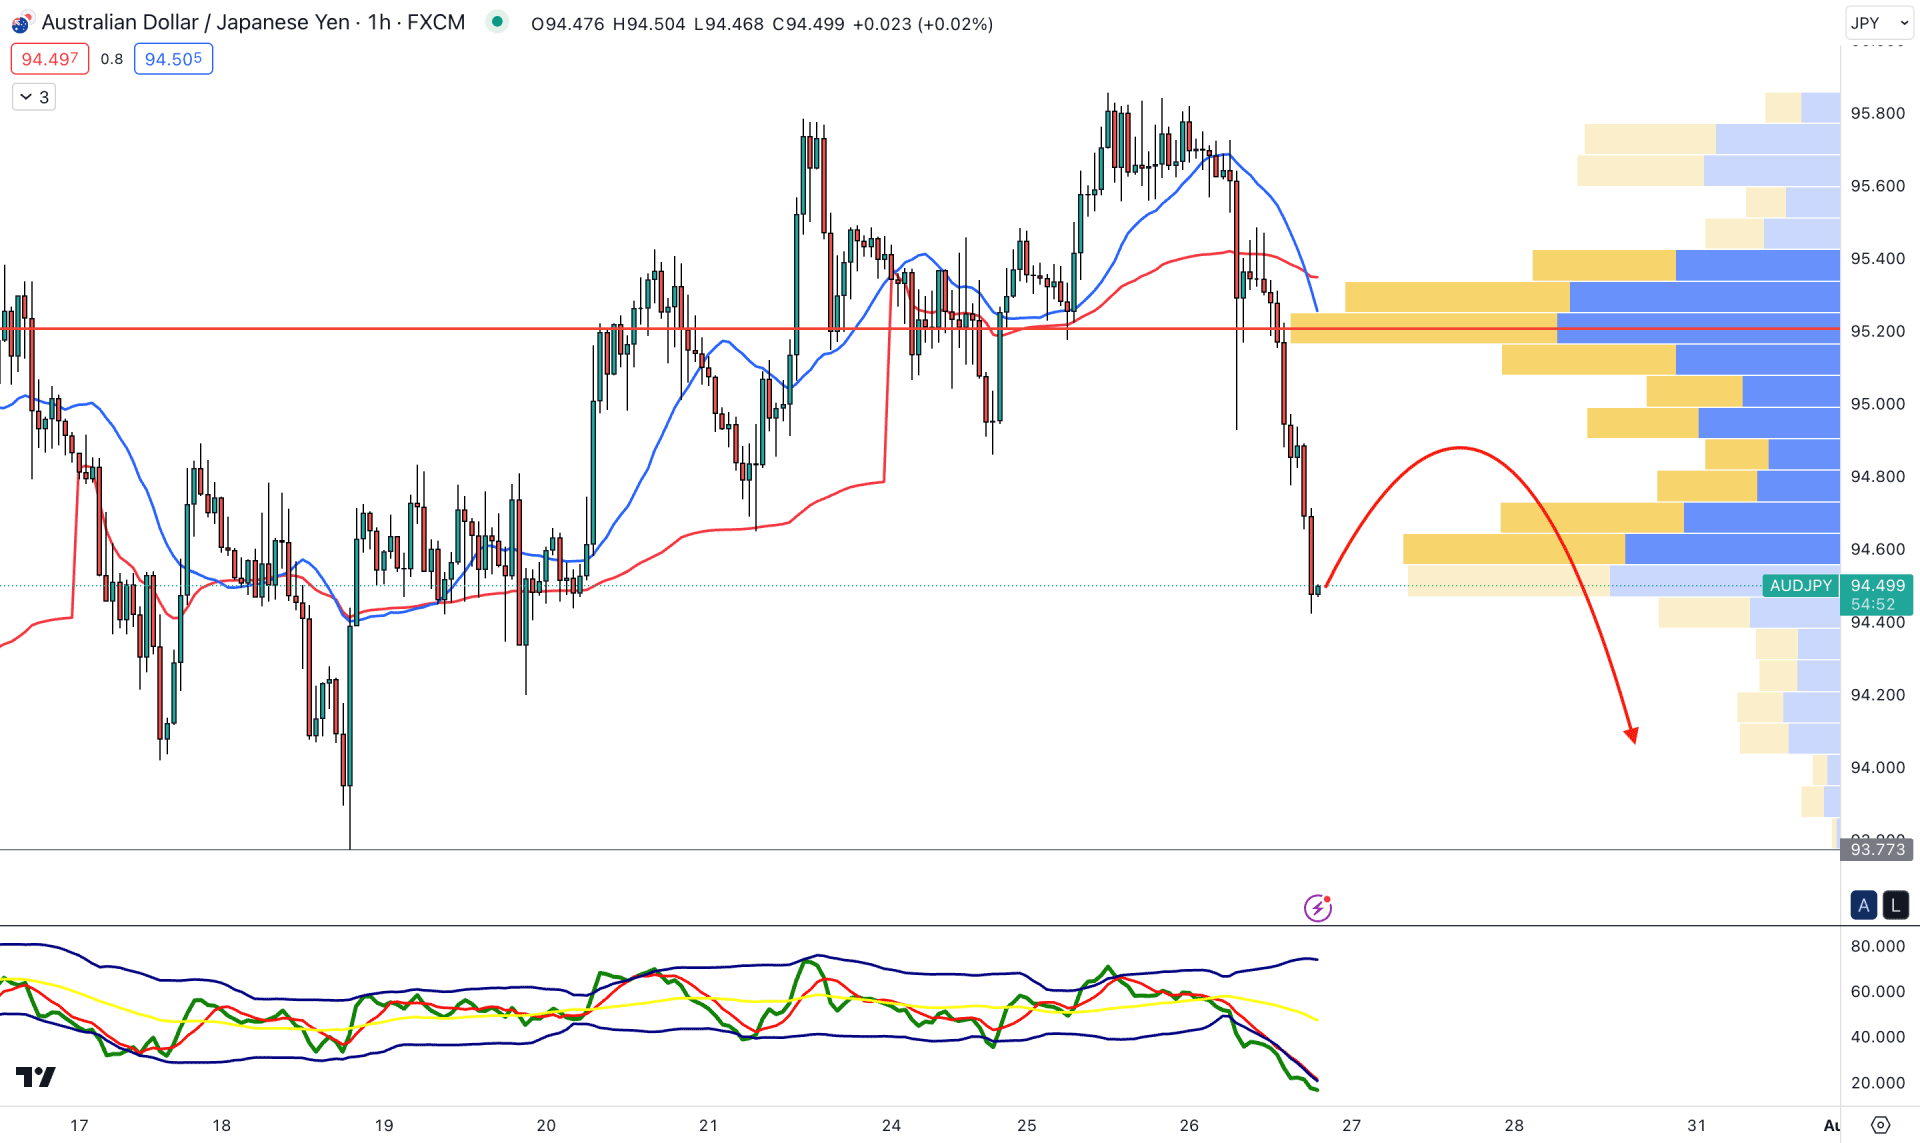
In the hourly chart, the current visible range high volume level is above the current price, showing a strong sellers’ presence in the market. Moreover, a bearish crossover between 20 EMA and weekly VWAP signals an increase in the sellers’ position in the market.
The current TDI level shows an extreme downward pressure by moving below the 50.00 line, but the overextension at the 20.00 level signals a possible bullish correction as a mean reversion.
Based on the H1 outlook, the bearish possibility is strong in the AUDJPY price, but a minor upside pressure may come. Any bearish rejection from 94.60 to 94.90 could be a bearish opportunity, targeting the 93.77 key support level. However, a new high volume level with an H1 candle above the dynamic 20 EMA is important to consider as a bullish reversal.
Based on the current market outlook, AUDJPY downside pressure may extend in the coming days, but the long-term view is still bullish. Investors can consider the channel breakout as a short-term bearish opportunity but a veiled recovery above the trend line level is needed to open a long position.


