
Published: April 10th, 2025
The AUDJPY pair bounced back from its daily drop and traded above the 91.00 barrier. The revived trade talks with Australia and the European Union (EU) are a source of confidence for the Australian dollar (AUD).
During an hour-long video conference on Wednesday night, EU representatives decided to resume the trade negotiations with Australia that had halted. EU Trade Commissioner Maros Sefcovic suggested a new schedule for talks with Australian Trade Minister Don Farrell. Differences in access to agricultural markets for the 450 million EU consumers caused the previous phase of negotiations to end two years ago.
However, the rising trade disputes between the US and China presented challenges for the AUD. After China increased tariffs on US goods to 84% in retaliation, US President Donald Trump proposed an immediate raise to 125% on Chinese imports. Australia's substantial commercial links with China make the prospects for the commodity-linked AUD uncertain due to the renewed trade battle.
As long as the Japanese yen (JPY) remains bullish, the AUDJPYs upward potential may be constrained. Market predictions that the Bank of Japan (BoJ) will keep hiking interest rates in the wake of better-than-expected Producer Price Index (PPI) data lend support to this.
Japan's PPI exceeded market estimates, rising 0.4% in March and 4.2% year over year. The stronger-than-expected figures could result in higher consumer prices, supporting the argument for the Bank of Japan (BoJ) to tighten policy further and strengthen the Japanese yen.
Let's see the complete outlook of this pair from the AUDJPY technical analysis:
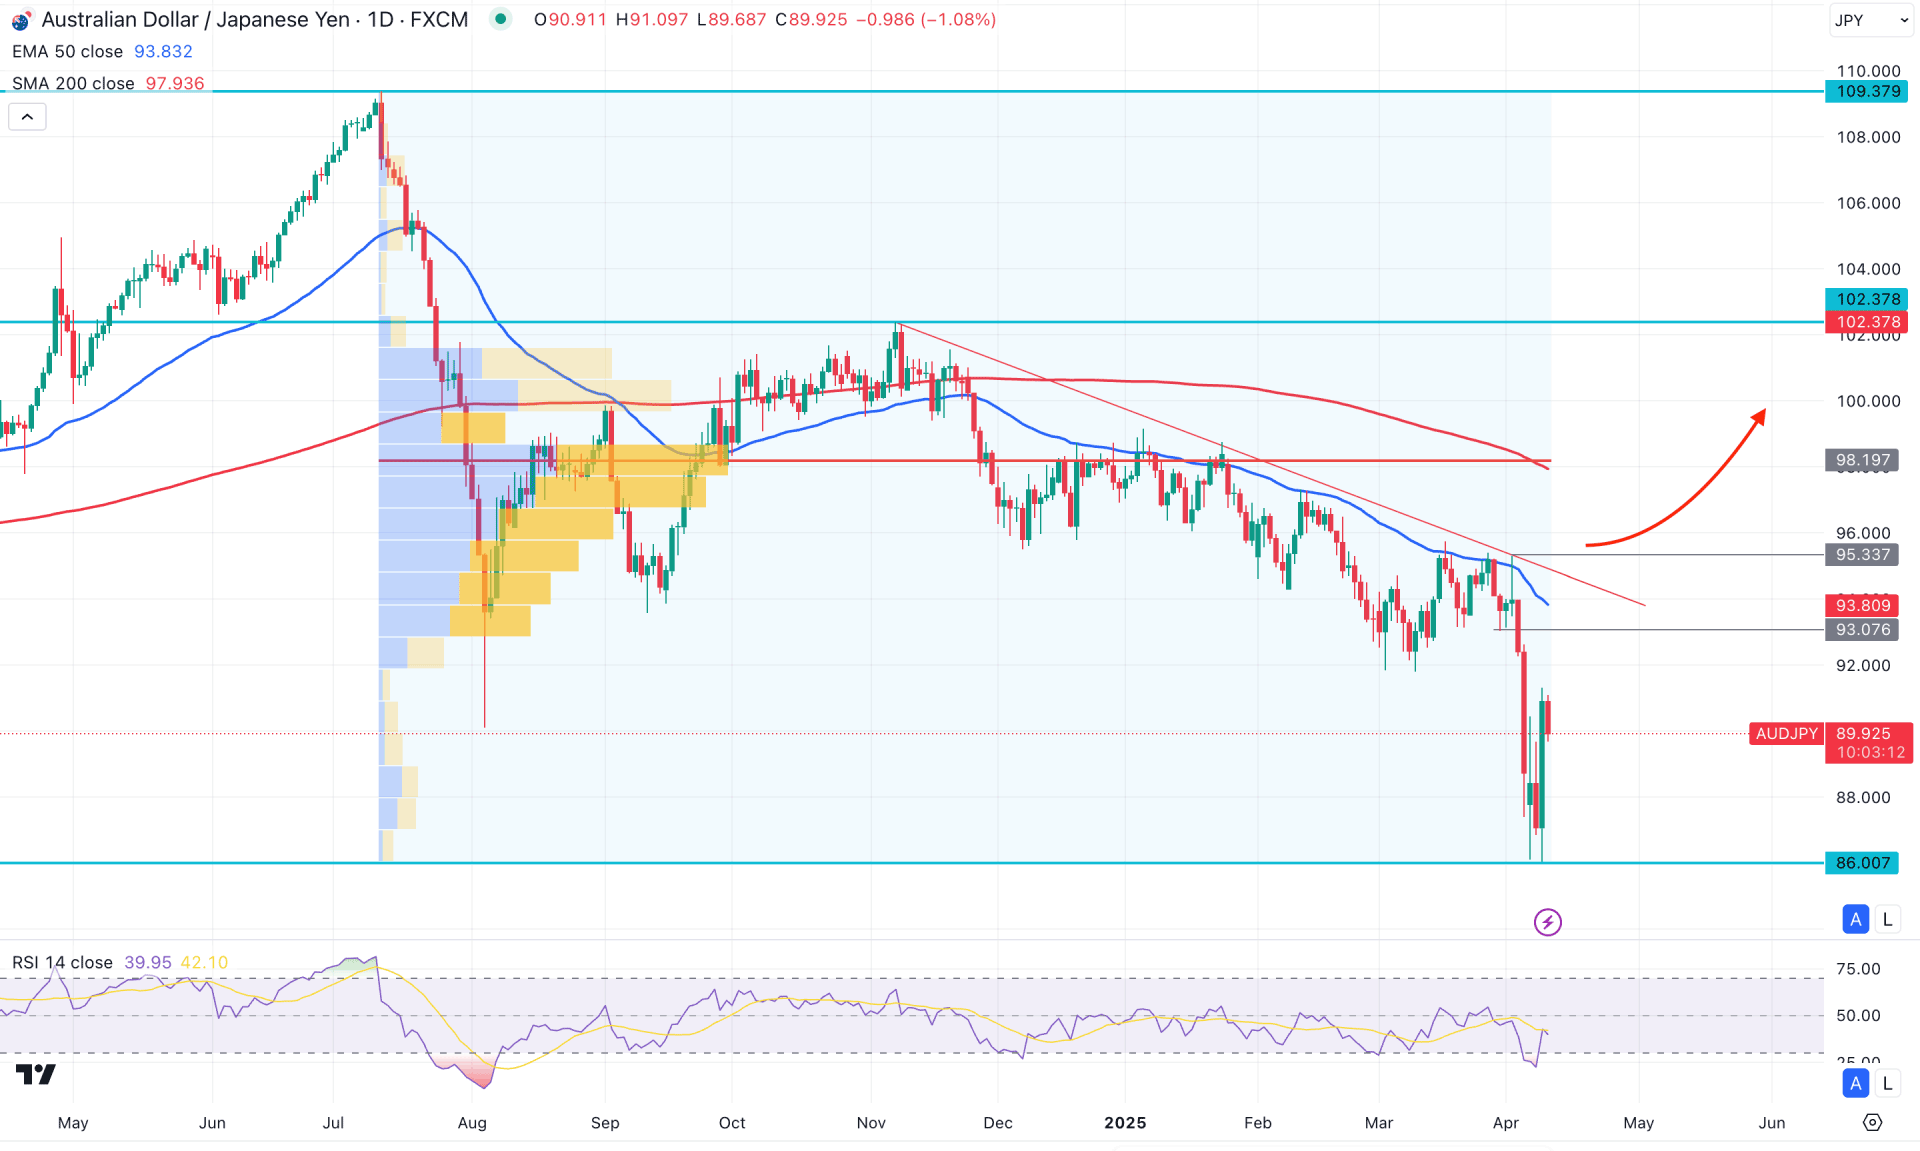
In the daily timeframe of AUDJPY, significant selling pressure originated from the 109.37 level, leading to a 17% price drop. After bottoming out, the price experienced a correction to the upside but then resumed its downward pressure. The latest selling pressure was initiated after forming sufficient liquidity beneath a falling trendline resistance. Currently, the price appears exhausted below the descending channel's lower boundary, indicating that a counter-bullish momentum is necessary to grab buy-side liquidity.
On the higher timeframe, the pair has been trading bearish for six consecutive months, with the current price hovering around a 25-month low. The extended bearish pressure has pushed the price below the previous monthly candle's low, from where a bullish recovery could occur. In the weekly timeframe, the price is moving sideways, following a massive bearish inside bar formation. Hence, the downside pressure remains valid as long as the price stays below the 95.31 weekly high.
In terms of volume structure, selling pressure is evident, with the most active level since July 2024 situated at 98.19. Although the current price is significantly below this high-volume level, a notable bullish correction is likely pending.
On the daily chart, both the 200-day SMA and the 50-day EMA are positioned above the current price, indicating a strong downtrend. However, the extended gap between the current price and the 50-day EMA suggests a potential bullish correction due to mean reversion.
From the Relative Strength Index (RSI) perspective, the current RSI value bottomed below the 30.00 oversold level, from where a recovery has come. However, the RSI line is still hovering below the neutral 50.00 level, which could pose a challenge for the bulls.
Based on the daily market outlook, AUDJPY is highly likely to extend its upside correction before resuming the broader bearish trend. However, an extended bullish rally with a daily close above the 95.33 level could signal a trend reversal. In such a scenario, the price is likely to revisit the trendline resistance near the 102.37 level.
On the other hand, the first resistance to monitor is at 91.34, followed by the 93.00 to 95.33 zone. Any bearish pressure emerging from the existing order block zone could resume the downtrend and drive the price to a new swing low below the 86.00 area.
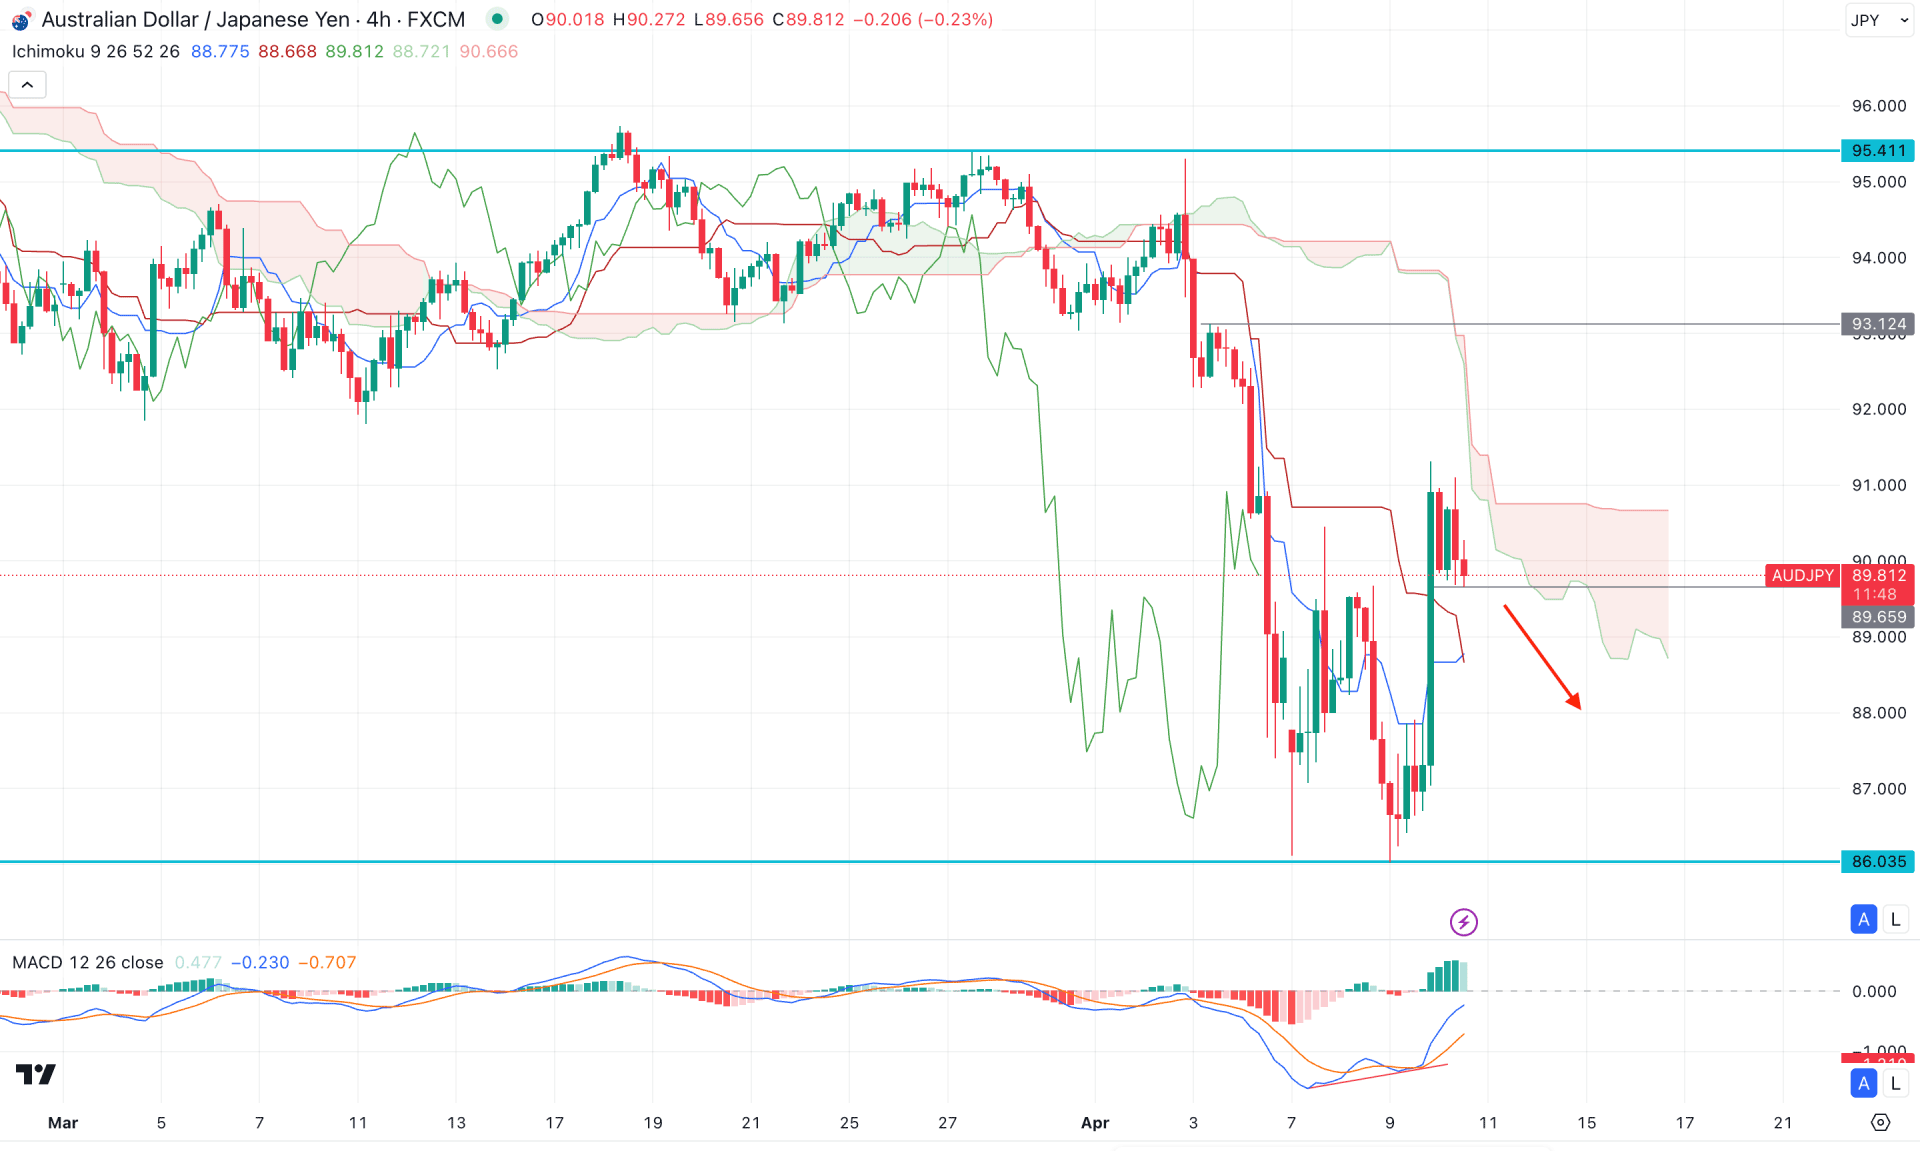
During the four-hour timeframe, AUDJPY traded within a range that followed a valid breakout. As a result, the price moved below the cloud zone, aligning with the measured bearish trend.
In the future cloud, both lines are sloping downward, suggesting a potential continuation of the bearish trend. However, the position of the dynamic lines has limited the selling pressure as they are hovering below the current price. As long as the dynamic areas remain below the current price, a clearer signal might emerge after a valid candlestick formation.
In the secondary window, a potential divergence is visible, as the MACD signal line failed to follow the market trend. Moreover, consecutive bullish histograms are present, also indicating a possible bullish shift.
Based on the four-hour outlook, a continuation of the current strength is highly likely, following the broader market momentum. In that case, a bearish reversal below the dynamic support area could validate a short opportunity.
On the other hand, sustained bullish pressure with a stable price above the 93.12 level could confirm a trend reversal, targeting the 96.00 area.
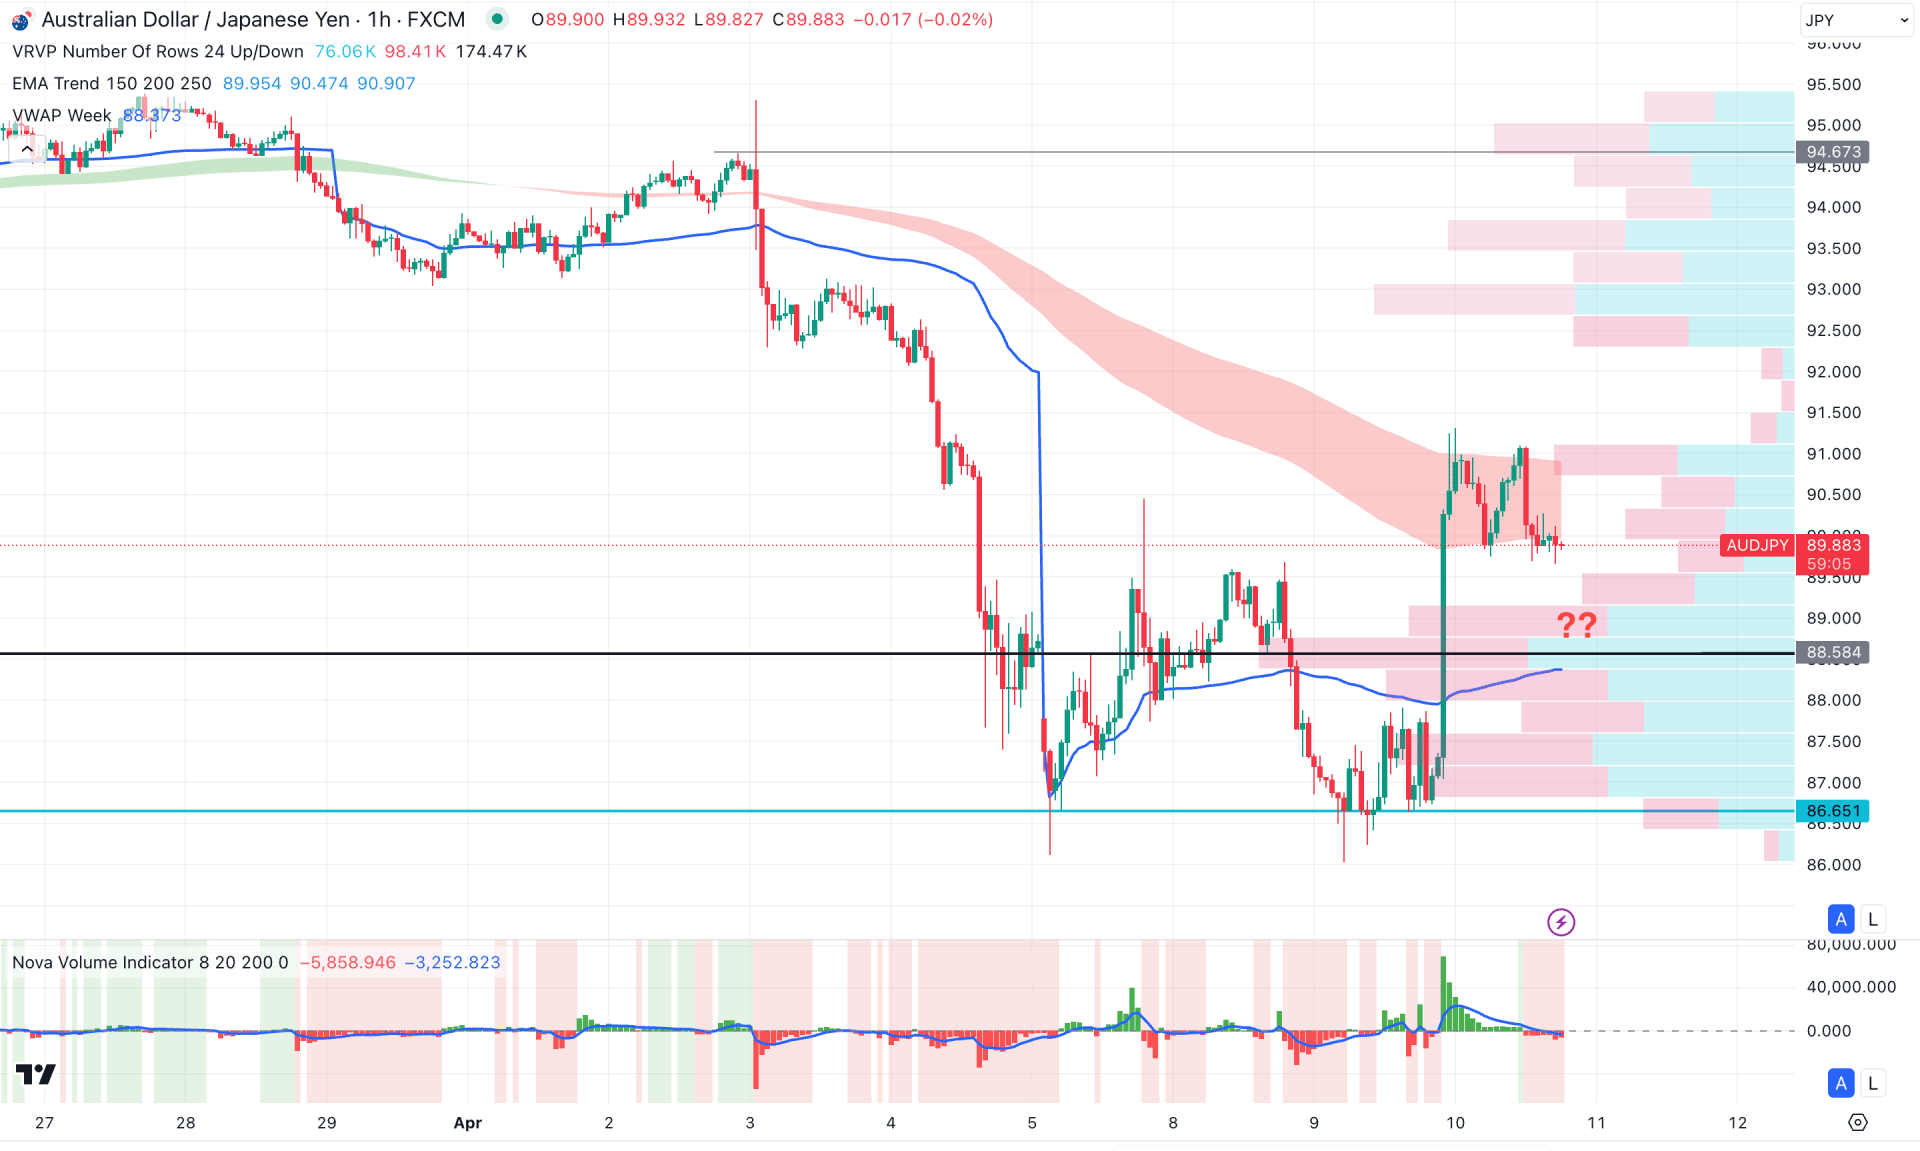
In the H1 chart, the current price is trading above the visible range high volume line, suggesting an intraday bullish pressure. However, the Moving Average wave is hovering with the current price, suggesting a consolidation.
On the other hand, the volume histogram suggests a lower activity, which signals a pending breakout from the current range before anticipating a stable trend.
Based on the hourly structure, the intraday bullish pressure could extend as long as the price hovers above the high volume line. In that case, overcoming the EMA wave could open a long opportunity aiming for the 93.00 area.
On the other hand, any immediate selling pressure from the current price area with a stable price below the 88.50 level could lower the price towards the 86.00 area.
Based on the current market outlook, AUDJPY is more likely to form a trend reversal aiming to grab the buy-side liquidity above the trendline resistance. However, the ongoing price action is still bearish, whereas a valid bullish recovery is needed from the intraday price.


