
Published: June 24th, 2026
One of the most notable instances of instability in the digital currency market this month is the trend in Audiera (BEAT). The token fell by about 88% in under a week after reaching a new all-time high level.
Several underlying causes that frequently precede speculative cycles have come to light as a result of the correction. There is a gap between pricing and project execution because BEAT's valuation rose considerably, outpacing any discernible fundamental expansion. The market was sensitive when sentiment changed because of a restricted circulating supply, which exacerbated the swings and allowed for strong upward movements during times of demand.
Technically, the token's value has dropped by around $9.5 from its peak of almost $11, and it is currently at about $1.8. BEAT's future now depends on its ability to build a solid foundation and draw in sustainable demand. If the collapse is successful, it might be recalled as an essential reset. If not, the marketplace will probably keep pushing down levels until pricing more closely reflects the true appetite of investors.
Let's see the complete technical analysis from the BEAT/USDT charts:
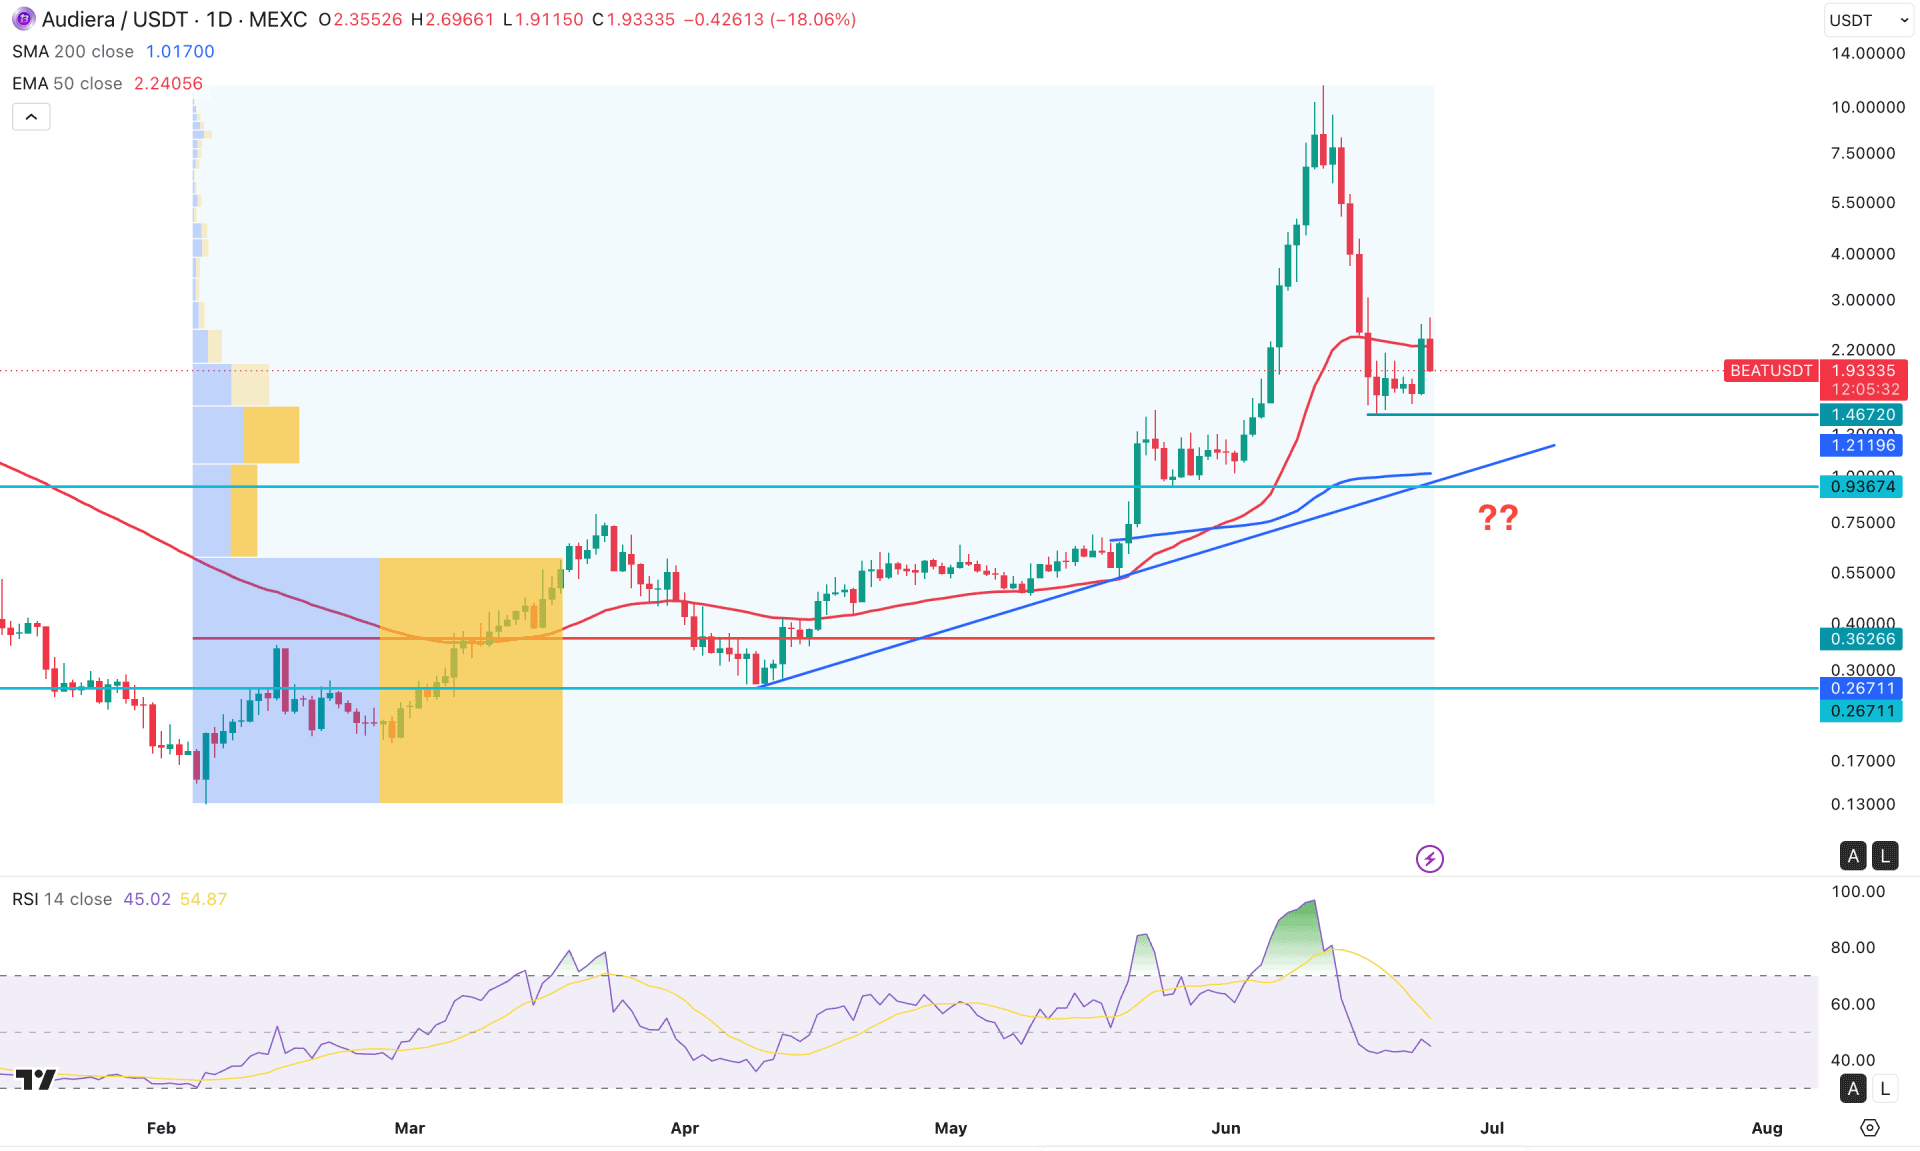
In the daily chart of BEAT/USDT, the recent price shows a massive bullish pressure followed by a valid recovery from the February 2026 bottom. However, the price failed to sustain the buying pressure and formed a pump and dump after getting a new all-time high at the 11.4001 level. As the current price is trading at the near-term bullish order block area, more confirmations are needed before confirming the possible price direction.
The monthly timeframe is signalling a bullish exhaustion as an immediate rejection is seen at the top. Moreover, the weekly price shows a strong bearish engulfing pattern, where the weekly low is still working as an immediate support.
In terms of the volume, a minor selling pressure is still visible even if the major structure is bullish. The largest activity level since February 2026 is at the 0.3626 level, which is way below the current price. Although there are multiple support areas to hold the selling pressure, the gap with the dynamic line is signalling a pending downside correction.
In the main price chart, the price moved below the 50-day EMA for the first time since 16 April 2026. Moreover, the price stayed below the 50-day EMA for more than a week before forming a liquidity sweep. On the other hand, the 200-day SMA is still below the current price but remains flat above the 0.9367 key support level.
As per the current context, the bearish pressure from the recent peak is still active and the price is likely to create a new swing low as long as it remains below the 50-day EMA.
The RSI has rebounded but is still below the 50.00 neutral line, where the ADX is at the 41.24 level, which is signalling an ongoing bearish market trend.
Based on the overall market structure, the price has a higher possibility of testing the 1.4672 support level before validating the bearish move. A price action at the mentioned support area should be monitored carefully, as a failure to hold the price from this line could test the 0.9367 static support, which is in line with the ascending trend line support.
Breaking below both lines with a daily close below the 200 SMA could initiate a broader bearish opportunity targeting the 0.2671 support level.
On the bullish side, an immediate opportunity is available from the current price area that can be validated with a bullish recovery above the 50-day EMA. Another long opportunity could come from the 1.4672 area to the 0.9367 area. Any sell-side liquidity sweep from these two lines with an immediate recovery could offer a long opportunity. The immediate resistance level to look at is the 50-day EMA, and overcoming this line could open room for testing the 8.0000 order block. Overcoming this line could open room for making a new all-time high level above the 12.0000 area.
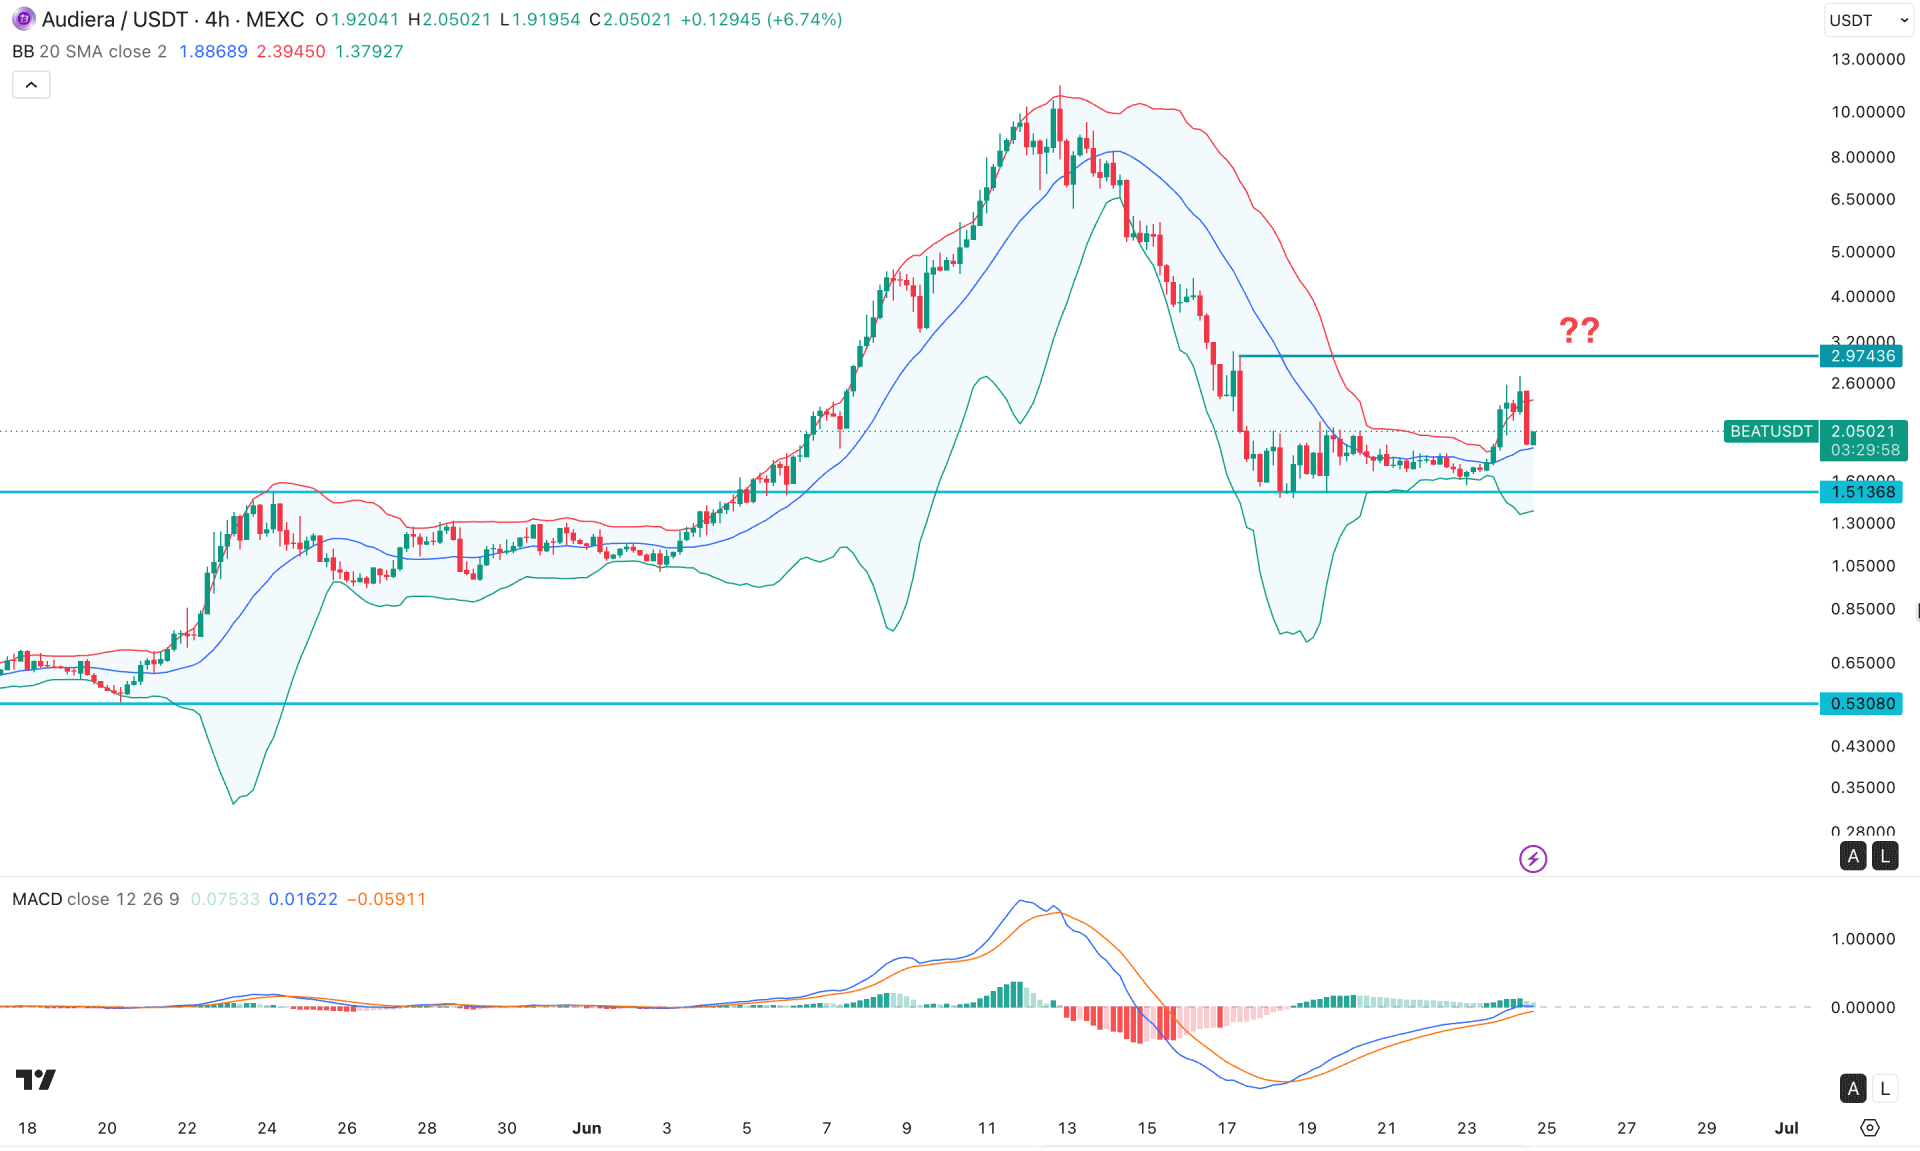
In the four-hour timeframe, BEAT/USDT is still trading within a bullish trend, where the current price is trading at a discounted price area.
After forming a bearish break from the middle Bollinger Band, the price went sideways after reaching the 1.5136 support level. A minor buying pressure is seen from a rectangle pattern breakout, but the immediate downside recovery is currently signalling a potential bearish trend continuation.
In the MACD indicator, the histogram is in a neutral area, where the signal line is having a bullish recovery. As both elements are showing opposite movement, investors might need more confirmation to validate the trend.
Based on the current market structure, a failure to hold the price above the upper Bollinger Band is signalling an immediate downside recovery that increases the possibility of testing the 1.5138 support level. Moreover, a failure to hold the momentum at the support line could increase the possibility of making a new swing low below the 1.0197 level.
On the other hand, a bullish recovery from the lower Bollinger Band is highly possible, which can extend the price higher and test the 2.9743 resistance level.
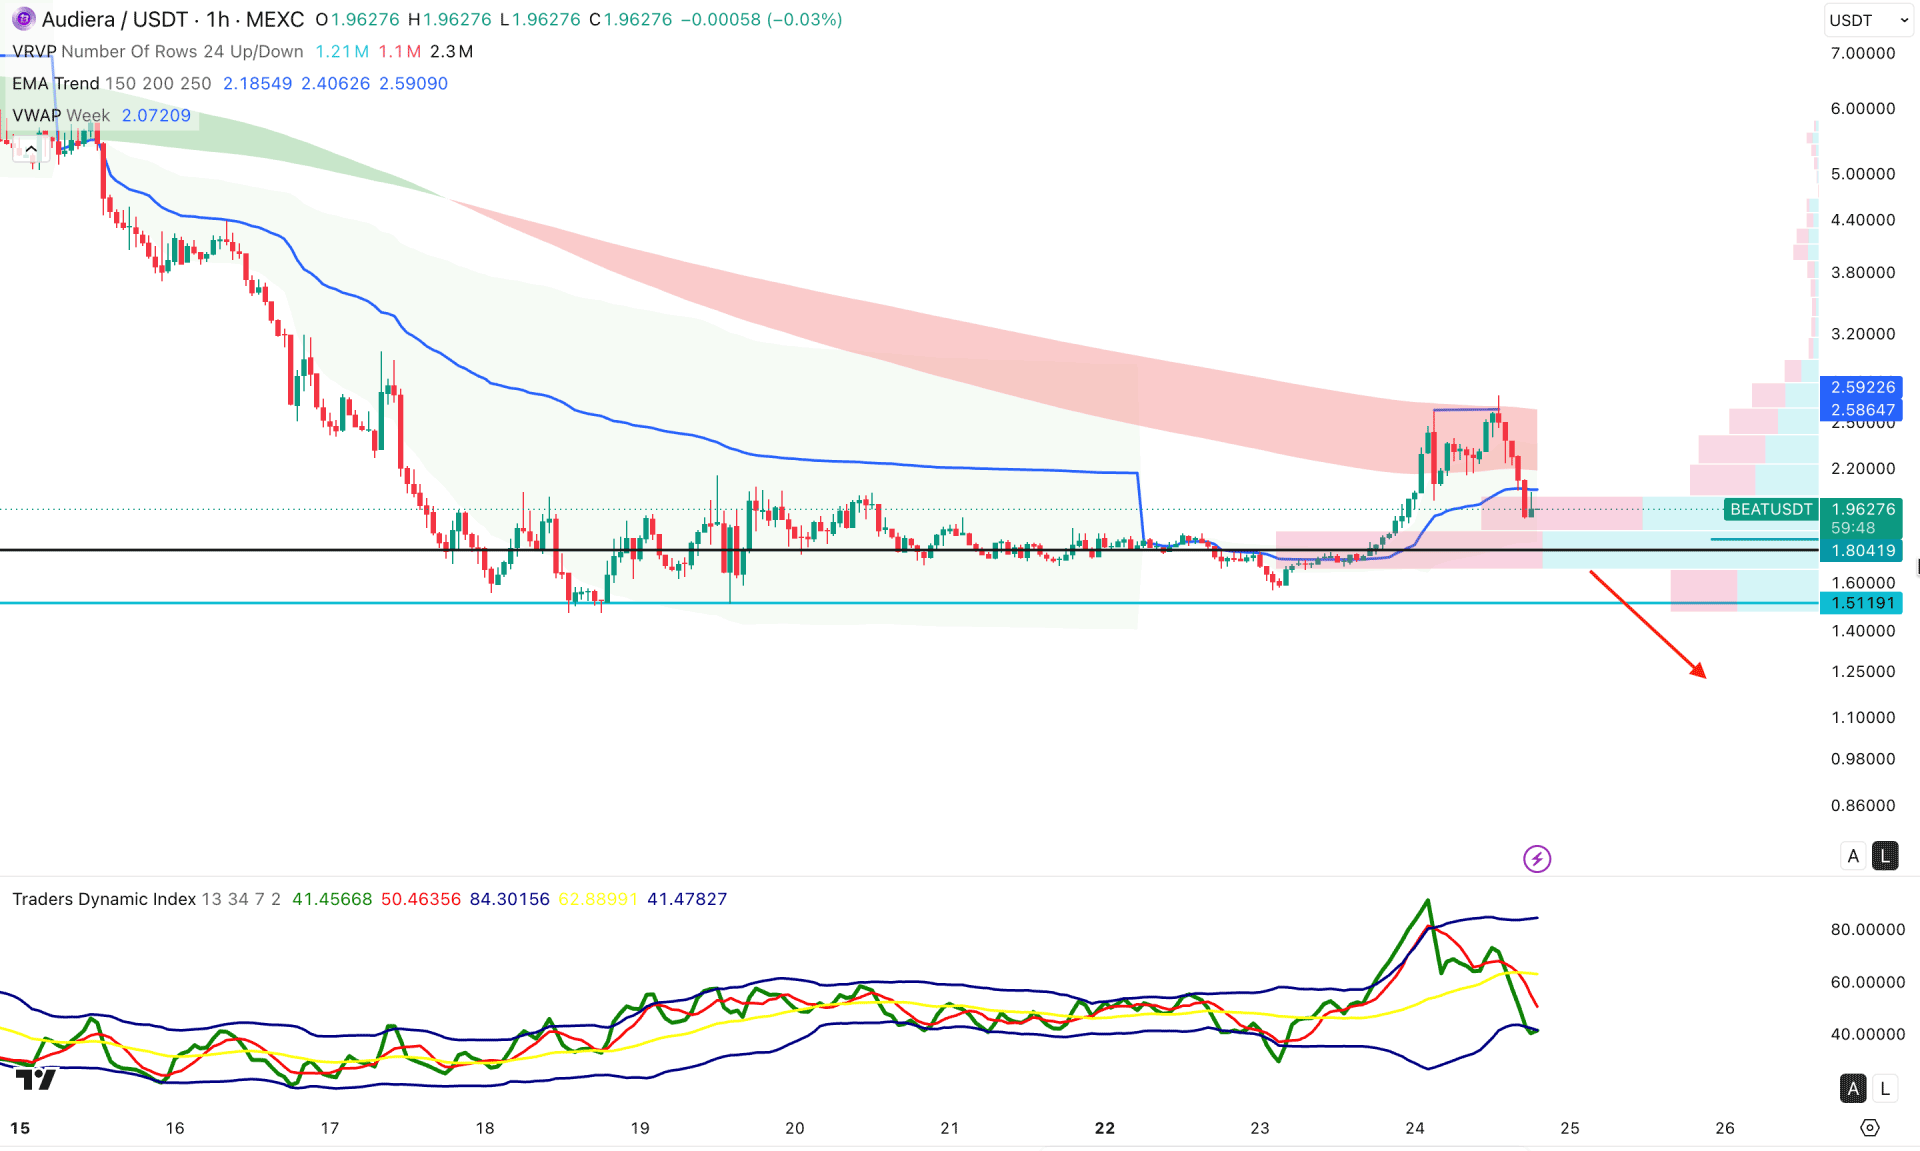
In the hourly timeframe, the recent bullish recovery from the rectangle breakout is signalling a strong bullish continuation opportunity. The hourly chart shows a close below the weekly VWAP level, where the EMA is acting as a strong resistance level. However, the intraday high volume level is still below the current price at the 1.8041 level.
In the secondary indicator, the Traders Dynamic Index has moved to the lower band area, signalling active selling pressure in the market.
Based on this outlook, failure to hold the buying pressure above the 1.8000 level could be an alarming sign to buyers, where the immediate support to look at is the 1.5119 level. A break below this line could increase the possibility of testing the 1.0000 area.
The alternative trading approach is to look for an immediate bullish recovery from the 1.800 high-volume line. In that case, recovery above the weekly VWAP line could limit the selling pressure and increase the corrective buying pressure.
Based on the overall market structure, BEAT/USDT is trading in a pump-and-dump pattern, with further downside correction pending. Also, as the price has dropped from the new all-time high area with a valid bearish weekly close, a failure to hold the momentum near the daily support level could be an alarming sign to buyers.


