
Published: May 3rd, 2023
Despite expectations of no change, the RBA startled market participants by increasing the key interest rate by 25 basis points to 3.85%. Governor Philip Lowe suggested that interest rates could continue to rise, emphasizing the Fed's commitment to bringing inflation back to its target level. On Friday, the Statement on Monetary Policy will provide additional information regarding future developments.
Before the meeting, interest rate markets forecasted a 50 percent probability of a 25 basis point increase later this year. Inflation figures were released last week, with a headline CPI of 7.0%, exceeding expectations of 6.9% year-over-year. However, the RBA's preferred measure of trimmed-mean CPI for the same period was 6.6% year-over-year, which was lower than the 6.7% expectation.
On the other hand, the Swiss Economy shows some strength due to its safe haven nature. After the upbeat data on the trade balance, investors will focus on the CPI report this week, which could remain unchanged at 0.2%.
Let’s see the upcoming price direction of AUDCHF from the multi-timeframe analysis:
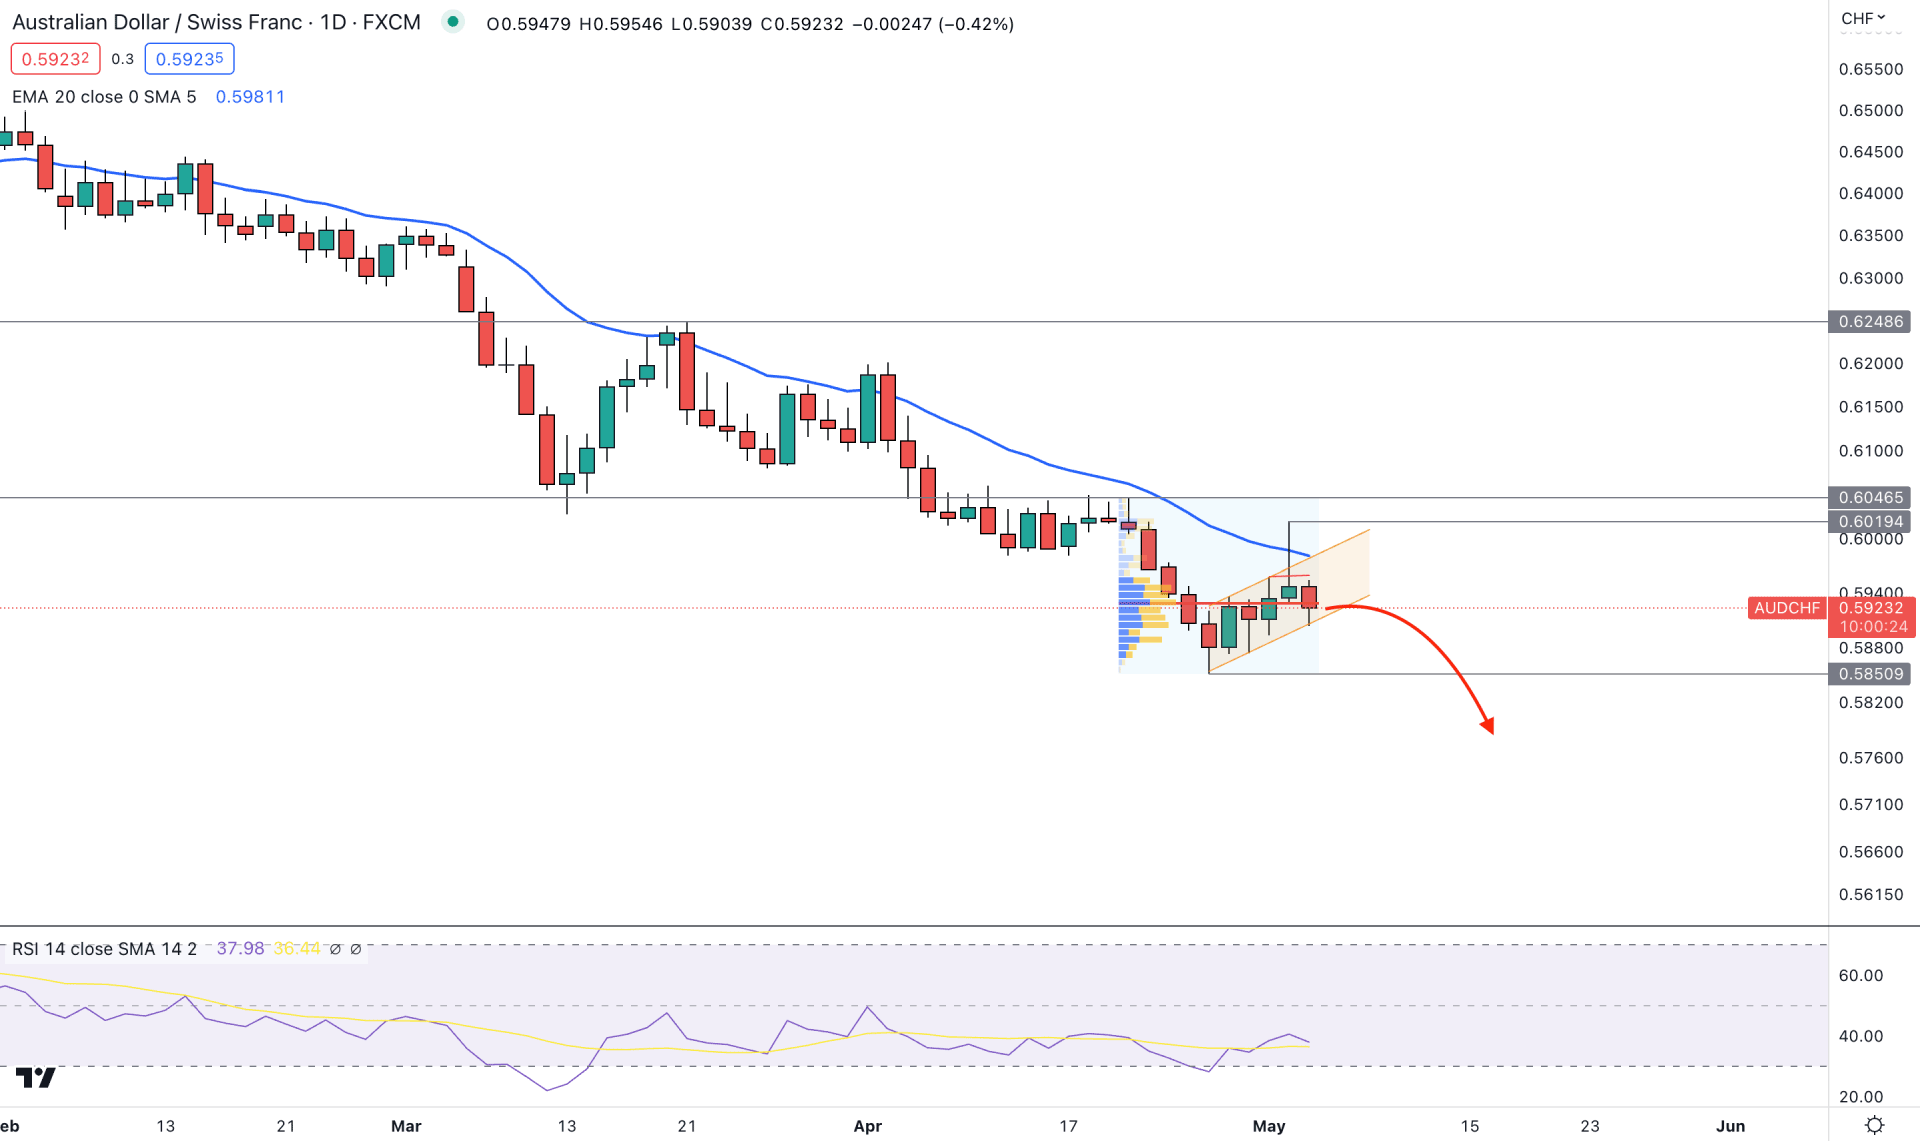
In the AUDCHF daily chart, the broader market trend is bearish, validated by several lower low formations from left to right. Also, the bearish momentum is supported by the higher timeframe price action, where the monthly chart shows three consecutive bearish candles. Therefore, a break below April 2023 low with a bearish daily close could lower the price in the coming days.
In the most recent chart, bullish pressure was seen during the RBA rate statement this week, which failed to hold the price above the Monday high. As a result, a buy-side liquidity sweep has formed in the daily price, which may result in a bearish channel breakout.
Moreover, the main price chart shows a bearish rejection from the dynamic 20-day Exponential Moving Average, while the current high volume level is closer to the price.
Although there is a potential divergence with RSI, the broader context is still bearish. As per the current reading, the RSI shows a downside pressure below the 50.00 neutral line, while the long-term trend is bearish.
Based on the daily outlook, the bearish trend continuation opportunity needs validation from the daily breakout. The conservative approach is to look for a valid ascending channel breakout with a bearish daily candle. It would open a short opportunity where the ultimate target is to test the 0.5800 psychological level.
On the other hand, bears dominated the market for three months, which increased the possibility of a bullish rebound. In that case, a bullish daily candle above the 0.6046 level could eliminate the bearish structure and increase the price toward the 0.6300 area.
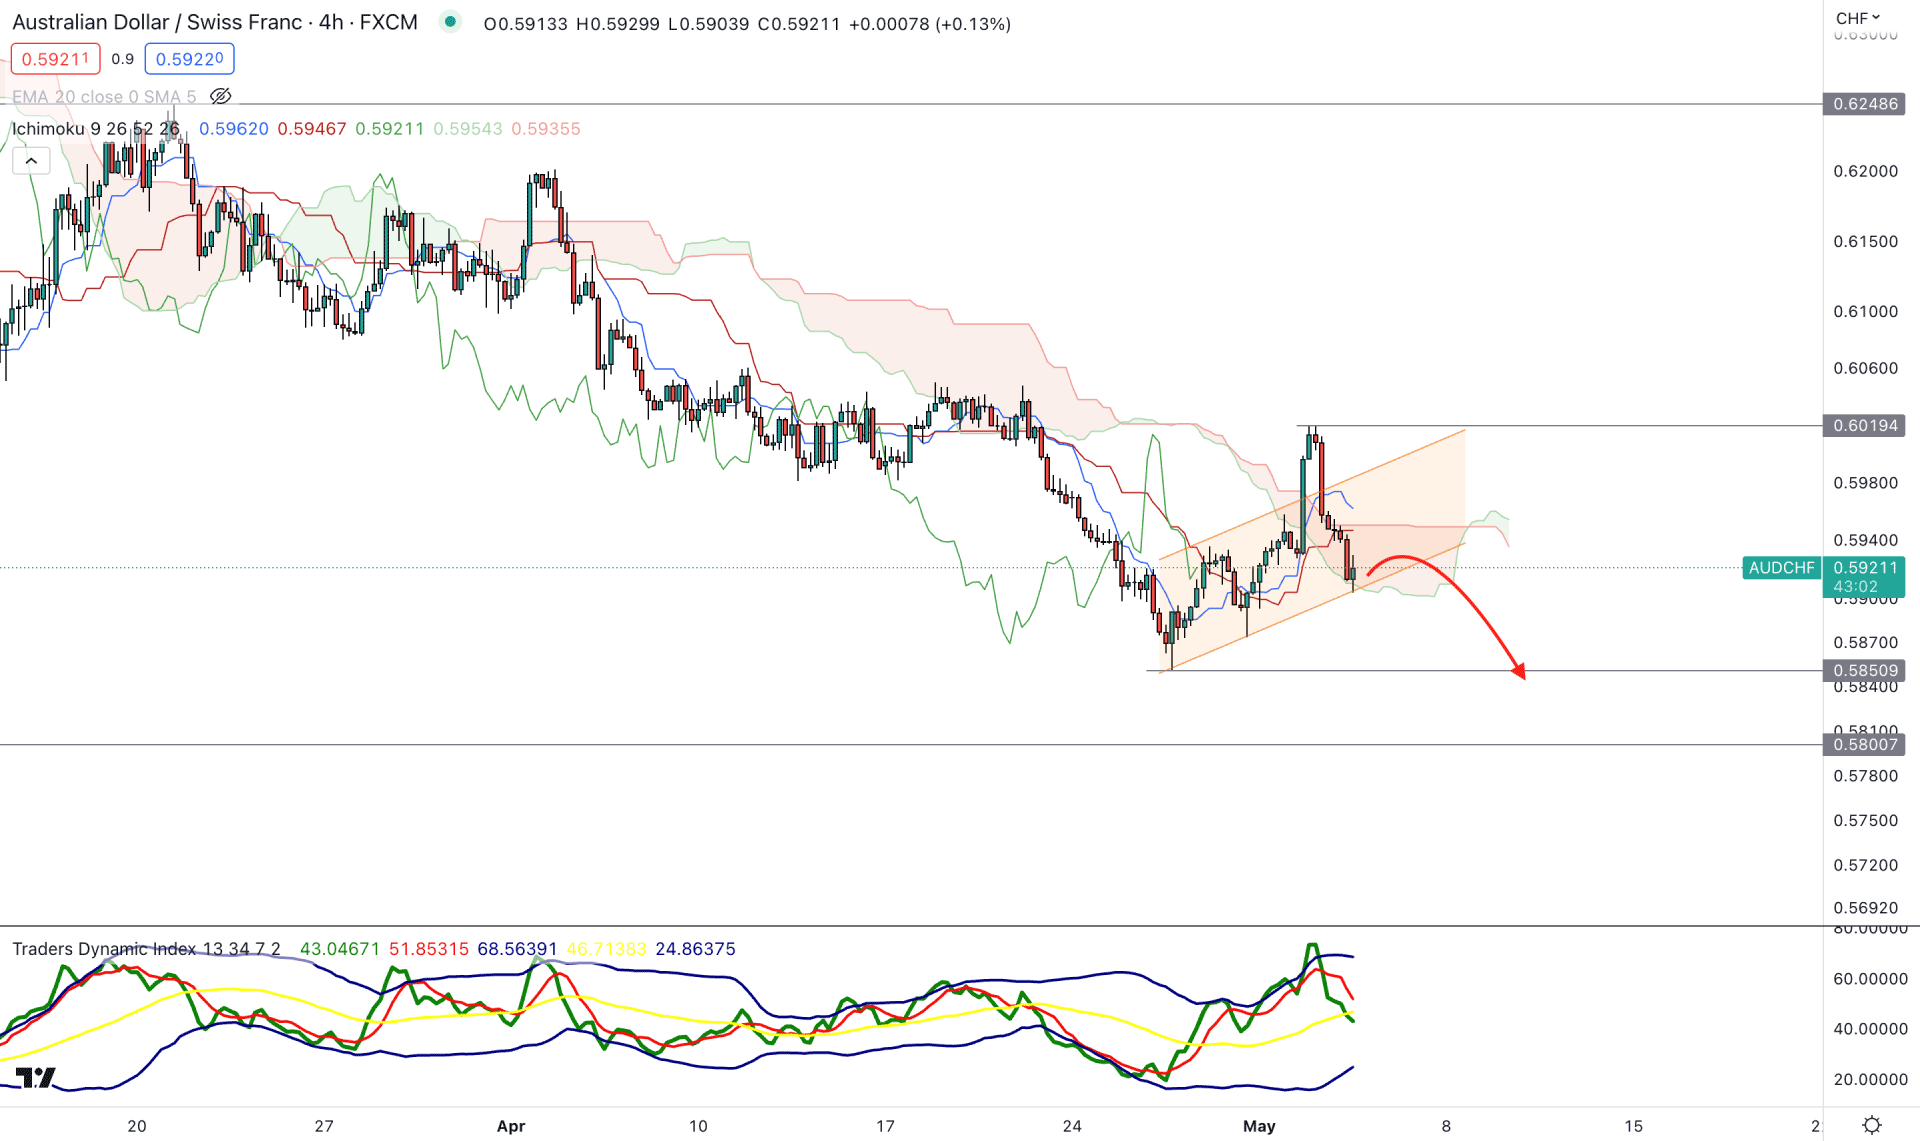
In the H4 chart, a downside possibility is potent as there is a false break above the Kumo Cloud with an immediate recovery. Although the future could have flipped the position, the broader market outlook is still bearish,
The current price is still trading within the ascending channel, where a break below the Kumo Cloud would work as a confluence to the channel breakout.
The indicator window shows the same story, where the current TDI level is aiming higher after testing the upper band area.
Based on this structure, investors might experience downside pressure in the AUDCHF intraday chart. A bearish H4 candle below the channel support would lower the price toward the 0.5800 psychological level.
The bullish approach is to wait for a new swing high above the 0.6019 level and open a long position after a considerable correction.
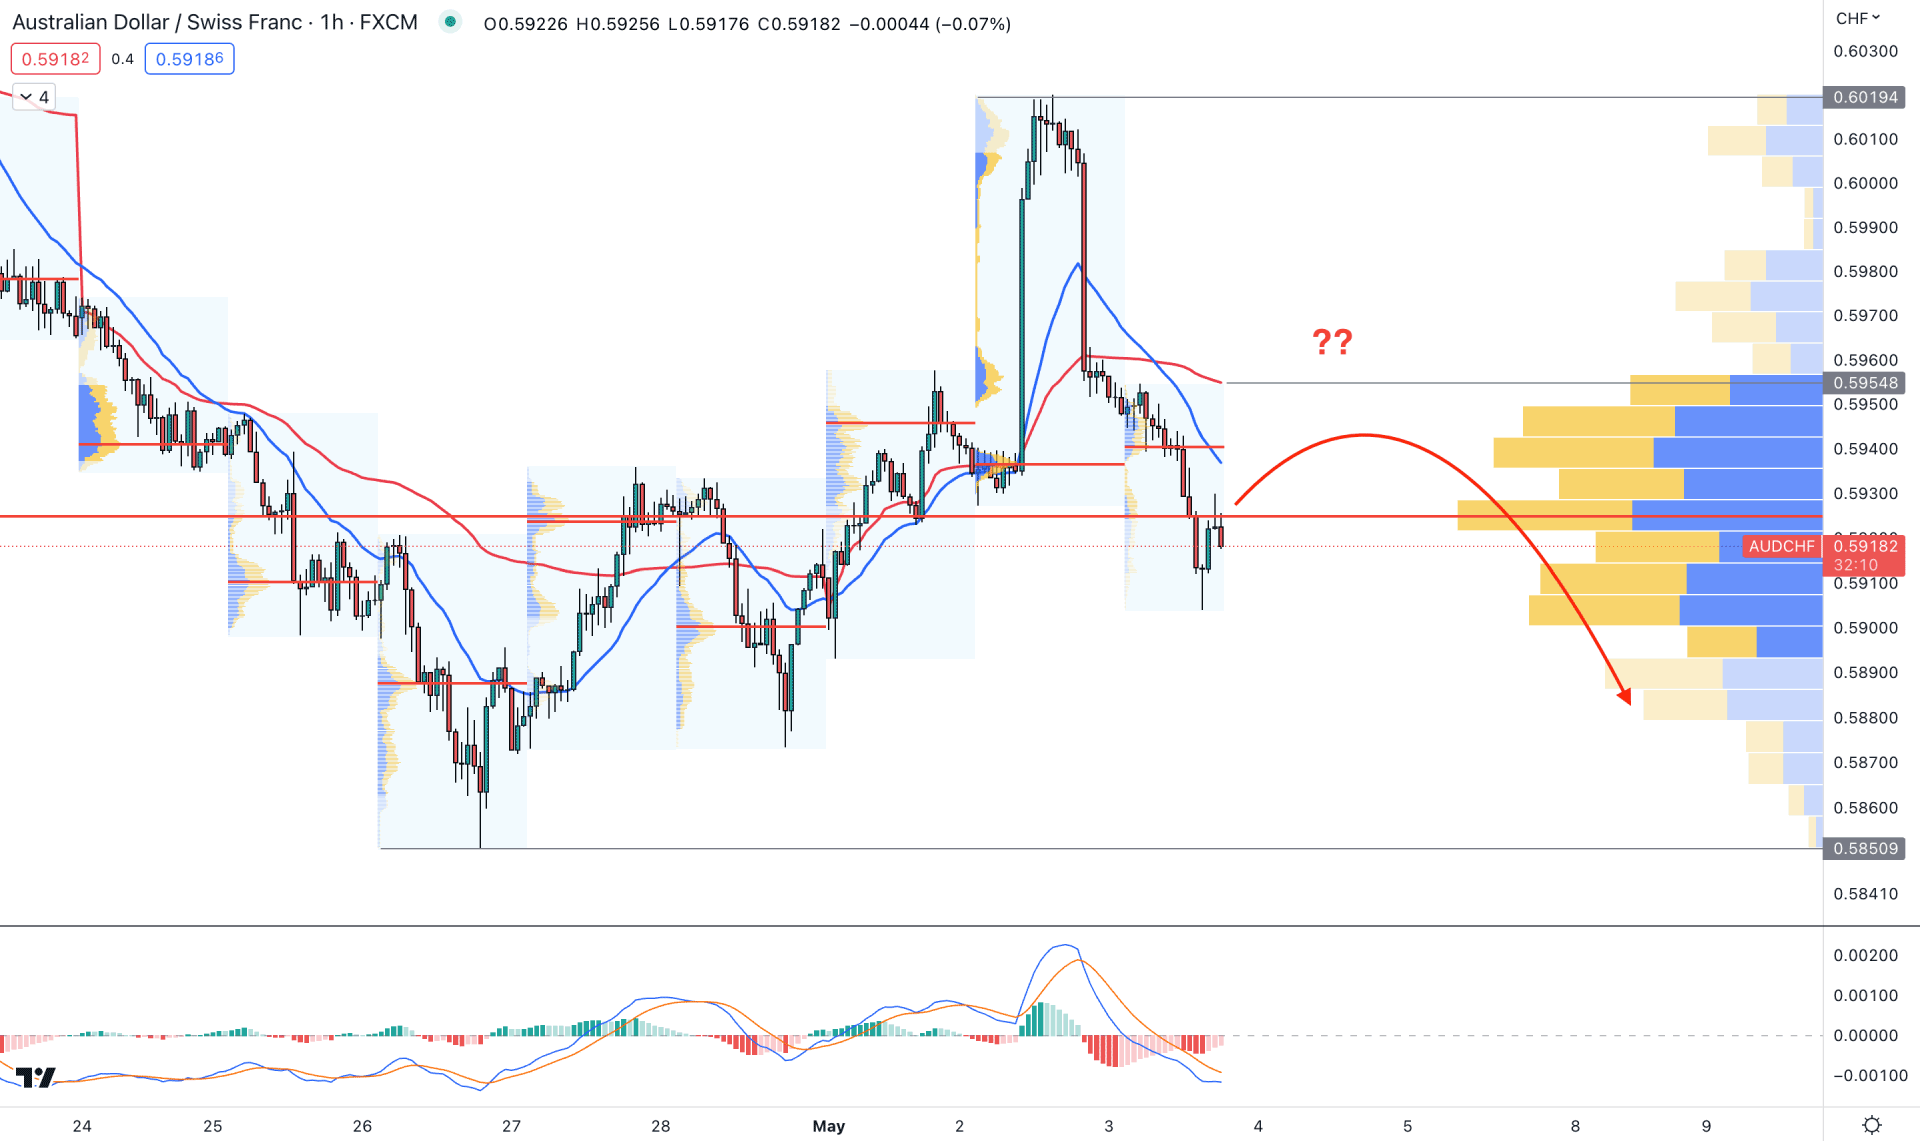
In the hourly chart, the currently visible range high volume level is above the current price, backed by an immediate bearish recovery from the 0.6019 swing high.
The main chart window shows the dynamic 20 DMA and weekly VWAP to hold the position above the current price with a bearish crossover. It is a sign of strong selling pressure, which needs to be validated by additional signs.
The indicator window limits the downside momentum as the current MACD EMA’s are below the neutral line, while the Histogram is closer to the zero level.
Based on this structure, a minor upside pressure and a bearish rejection from the 0.5930 to 0.5960 area could offer a short opportunity, targeting the 0.5850 level.
However, a strong bullish breakout with an H4 candle above the 0.5960 level could increase the price toward the 0.6050 level.
The long-term market trend is still bearish for the AUDCHF daily chart, but it is possible to begin a new bullish swing from here.
Investors should closely monitor how the price reacts on intraday sell zones, from where the long term trend might extend.


