

Published: July 15th, 2026
Given Australia's tight commercial ties with China, the Chinese Yuan surged to a one-week high, providing further support for the Australian dollar.
The Chinese GDP grew at its slowest rate in over two years, 0.9% q/q in the second quarter, down from 1.3% in Q1. GDP increased by 4.3% year over year, falling short of China's 4.5–5% growth projection for this year. Even while 2026 growth is now well within its area (4.7% YtD), this is prompting calls for more government assistance.
Consumer Inflation Predictions will be the focus of interest in Australia. The research may impact views on the Reserve Bank of Australia's policy outlook and provide new insight into how people anticipate price developments over the next year.
At the same time, demand for the Swiss franc as a safe haven has increased significantly. A shift to premium, low-beta assets has been spurred by renewed geopolitical conflicts and worries about fiscal stability in key industrialised economies. One of the greatest beneficiaries of this risk-off attitude is still the Swiss franc. Additionally, the likelihood of a quick intervention has decreased due to the Swiss National Bank's apparent move toward emphasising price security over currency devaluation, which has encouraged market participants to expand their exposure to the franc.
Let's see the complete price projection from the AUDCHF analysis:
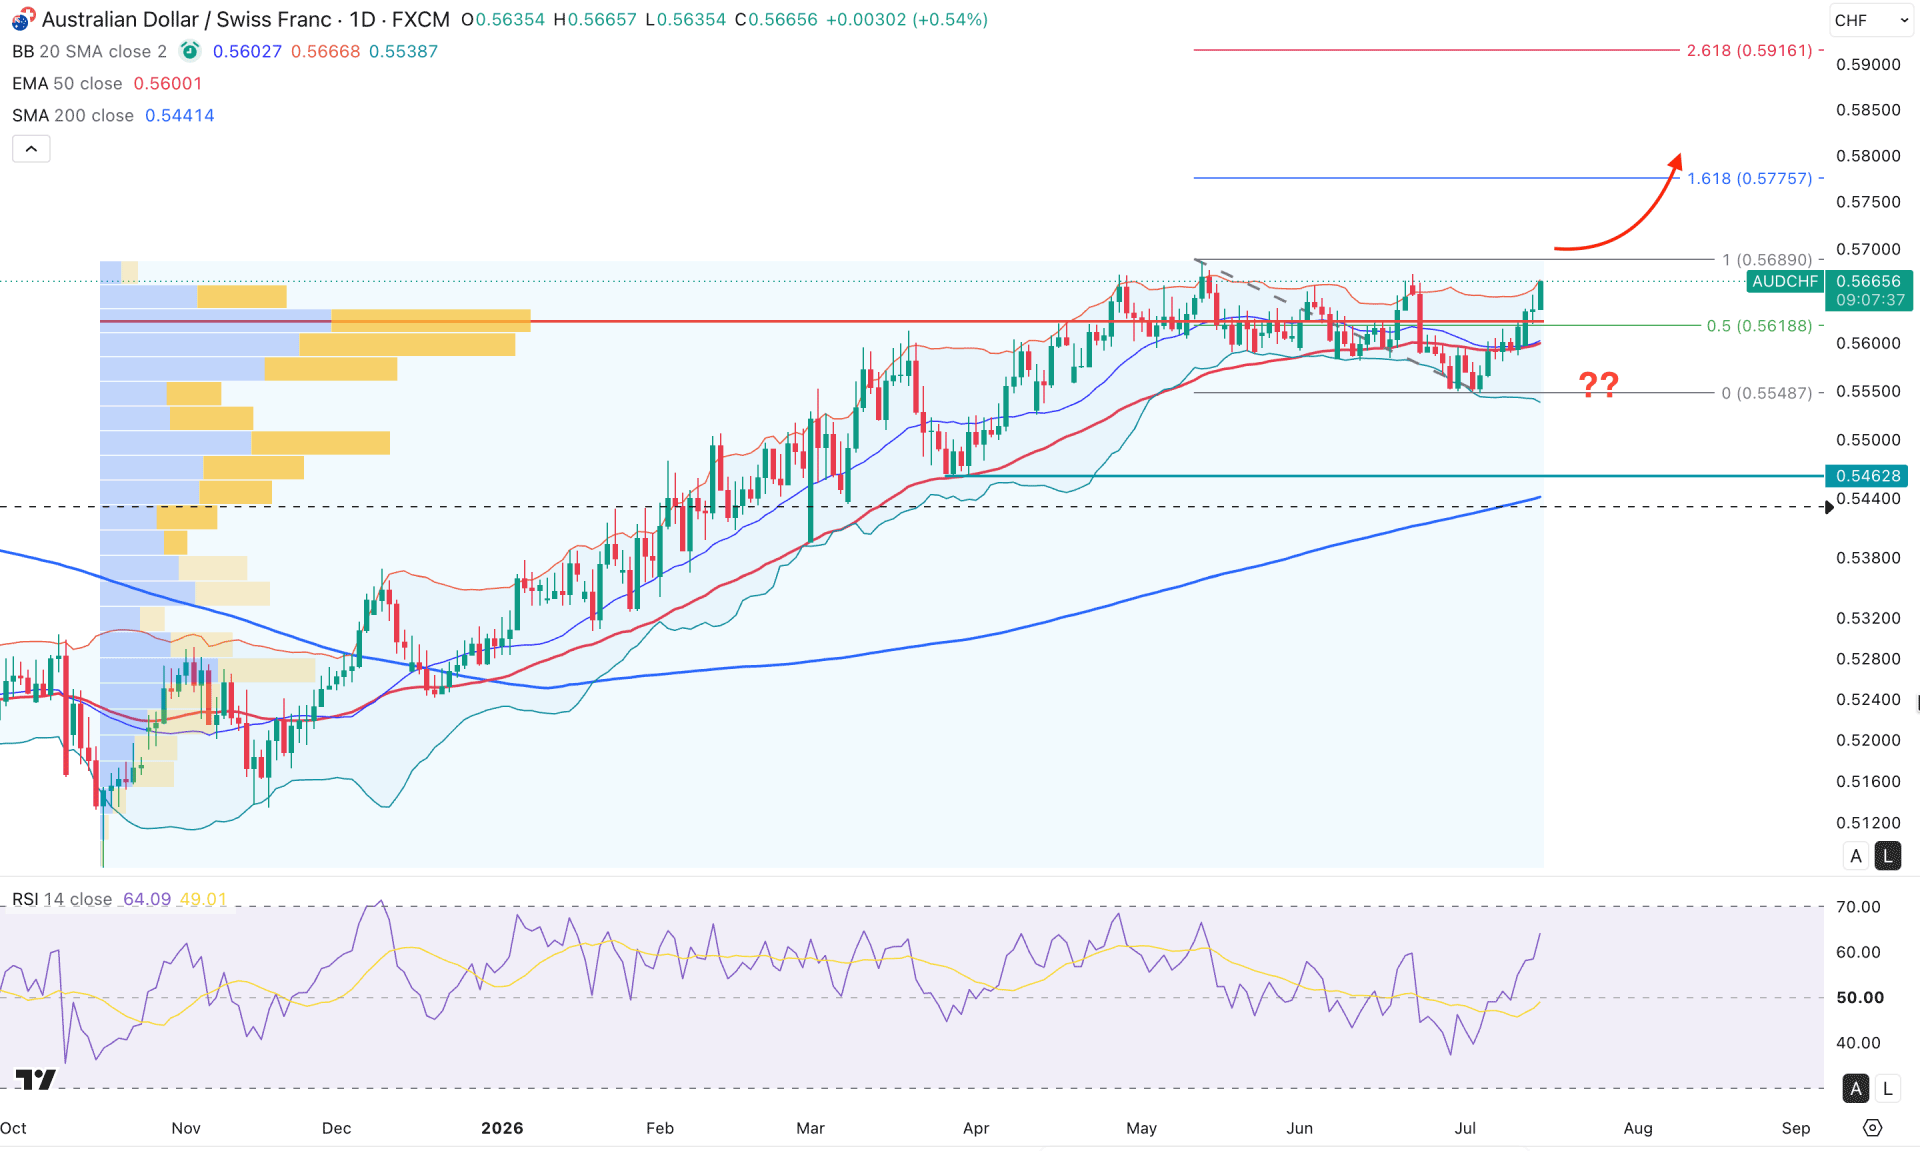
In the daily chart of AUDCHF, the ongoing market momentum is bullish, and the most recent price shows a valid breakout from a consolidation. As the current bullish momentum came as a sell-side liquidity grab, the price is likely to extend higher and create a new yearly high.
In the monthly timeframe, the existing buying pressure is visible as it came with two consecutive gravestone doji candlestick formations. The weekly price is also showing a rebound as a U-shaped pattern, from where a valid breakout is still pending to confirm the bullish continuation.
In terms of volume, buyers are still favorable, as the largest activity level since November 2025 is below the current price and within the most recent consolidation.
In the main price, the 50-day EMA is in line with the mid Bollinger Band level and working as a major support. Moreover, the current bullish rebound above the mid Bollinger line came with a solid liquidity grab from the 0.5582 existing swing low. As the price failed to hold the momentum and formed an immediate bounce, more upside pressure could come.
On the other hand, the bullish price action took the price to the upper Bollinger Band level, which is working as a strong resistance. Although the market momentum is bullish, some minor correction is pending as the price found resistance at the upper Bollinger Band area.
The RSI shows a valid rebound with stable momentum above the 50.00 neutral point. It is a sign of active buying in the market that can take the line above the 70.00 overbought level.
Based on the overall market structure, AUDCHF is trading within active bullish pressure, from where more upward pressure could come. The immediate resistance to look at is the upper Bollinger Band, which can create a minor rebound towards the 0.5618 level. However, as long as the existing buying pressure is present, the price is likely to make a new swing high above the 0.5689 level and test the 0.5775 Fibonacci extension level.
On the bear side, a failure to hold the momentum at the mid Bollinger line could increase the possibility of creating an extended correction below the 0.5548 swing low.
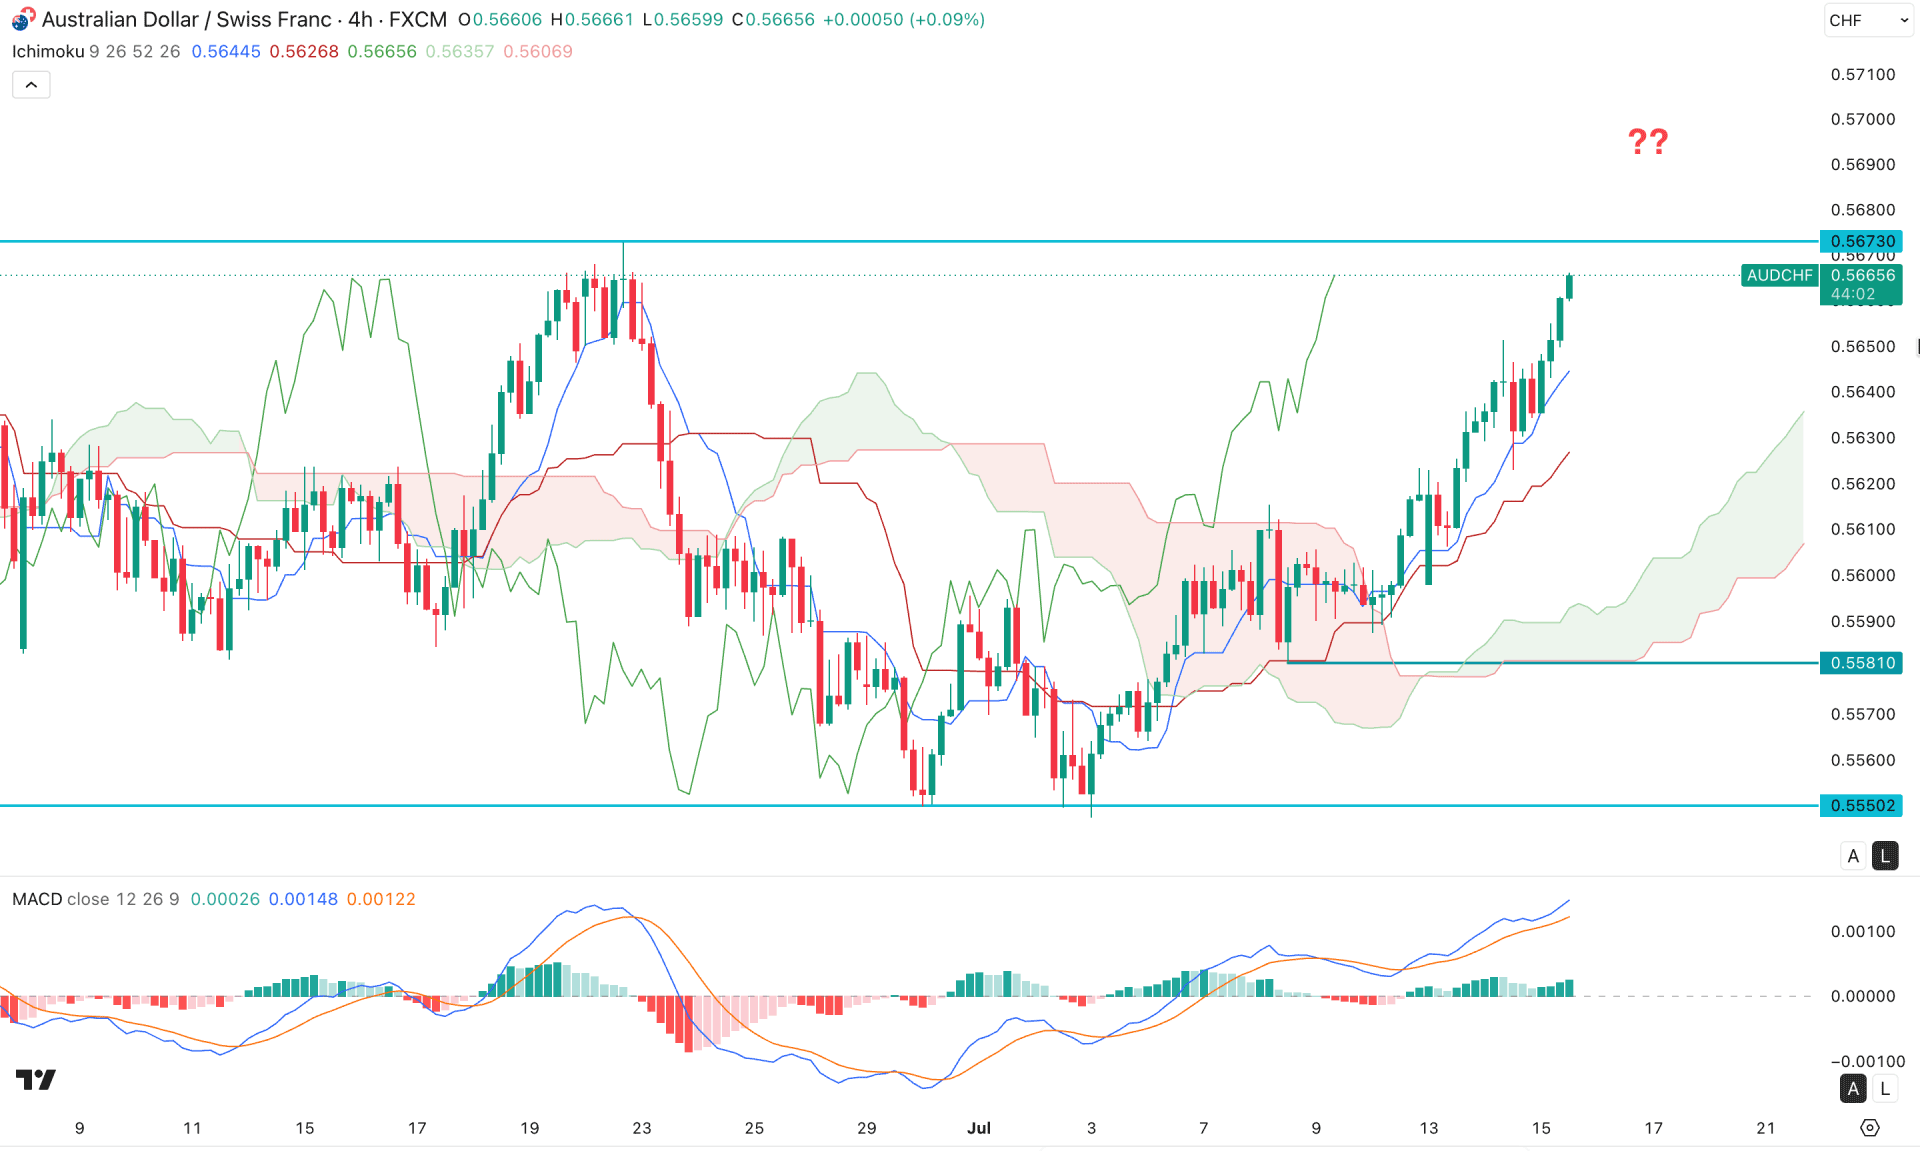
In the AUDCHF H4 chart, the ongoing market momentum is extremely bullish. The current price is trading at the intraday high level.
As the gap between the price and cloud support has expanded, the price is likely to form downside pressure as a mean reversion. Moreover, the key resistance level of 0.5673 is close to the current price, from where decent profit-taking could come.
In the secondary indicator, the MACD histogram maintains the pressure by forming multiple vertical bars above the neutral level. Moreover, the signal line is aiming higher at the highest area in a month, with no sign of a bearish crossover.
Based on the market structure, the buying pressure is valid in the AUDCHF pair, from where the crucial 0.5673 level is a price area to watch. A false break above this level with an immediate rebound could signal a valid profit-taking move that can initiate a short-term correction towards the 0.5600 area. However, the buying pressure remains valid as long as the price holds above the 0.5581 support level.
A bullish rebound from the near-term dynamic support area could offer a strong continuation signal that can take the price beyond the 0.5700 psychological level.
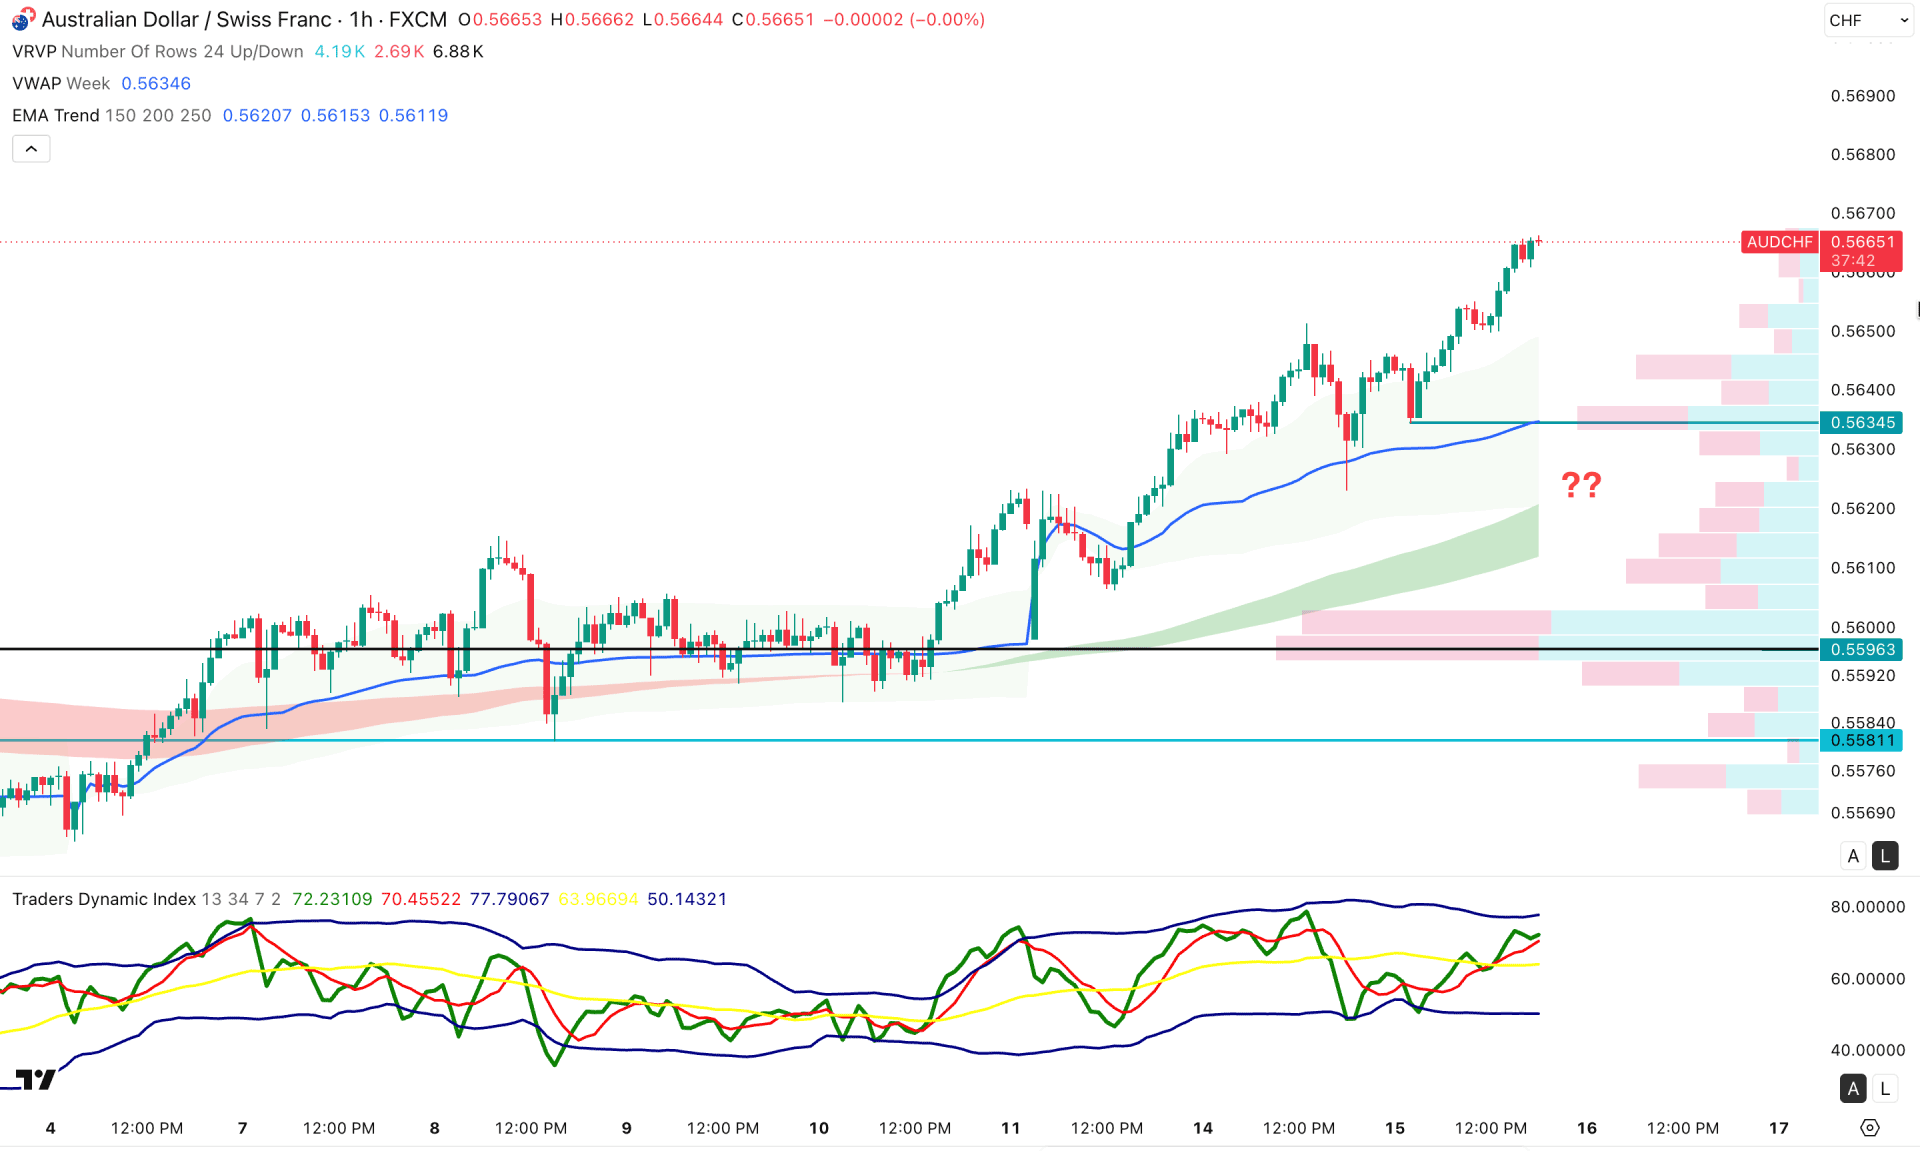
In the hourly timeframe, AUDCHF is showing extended buying pressure, taking the price to the weekly high level from a valid bullish rebound. The weekly VWAP is below the current price with a bullish slope. Moreover, the EMA wave is below the current price and working as crucial support.
In the indicator window, bullish momentum is visible, where the Traders Dynamic Index is above the neutral 50.00 level. However, the TDI line is yet to reach the bullish overextended level, signaling more upside possibility.
In this context, the buying pressure is valid in the AUDCHF pair, but a considerable downside correction could appear. The immediate support level is at 0.5634, from where a bullish rebound could occur. Investors should closely monitor how the price reacts in this area, as a valid break with a rebound from the weekly VWAP support could signal a bullish trend continuation opportunity.
Based on the overall market structure, AUDCHF is trading within a long-term bullish trend, presenting a valid trend-continuation opportunity. As the most recent price is aiming higher from a valid range breakout, the price is likely to rise and create a new yearly high.


