
Published: September 18th, 2025
In the intraday trading session, the AUDCHF pair recovers part of its initial losses and trades sideways. Early in the day, the Australian dollar plummeted when the Australian Bureau of Statistics revealed that employment in August had unexpectedly declined.
In contrast to the anticipated 22K new hires, the job market report revealed that the total labour force had shrunk by 5.4K. Additionally, the study revealed a 40.9K decrease in full-time jobs. As anticipated, the unemployment rate remained constant at 4.2%.
It is anticipated that traders would be forced to reevaluate their wagers regarding the Reserve Bank of Australia's (RBA) monetary regulations outlook if they notice signs of a slowing demand for jobs. At its policy conference later this month, the RBA is anticipated to maintain its Official Cash Rate (OCR) at 3.6%.
To determine if the Swiss National Bank (SNB) will drive interest rates into a negative range amid adverse inflation risks, traders in the Swiss economy are waiting for a significant trigger. Over the last two months, the Swiss economy's consumer inflation rate has been expanding at a low rate of 0.2% annually.
Let's examine the potential performance of the Australian Dollar against the Swiss Franc through the AUDCHF technical analysis:
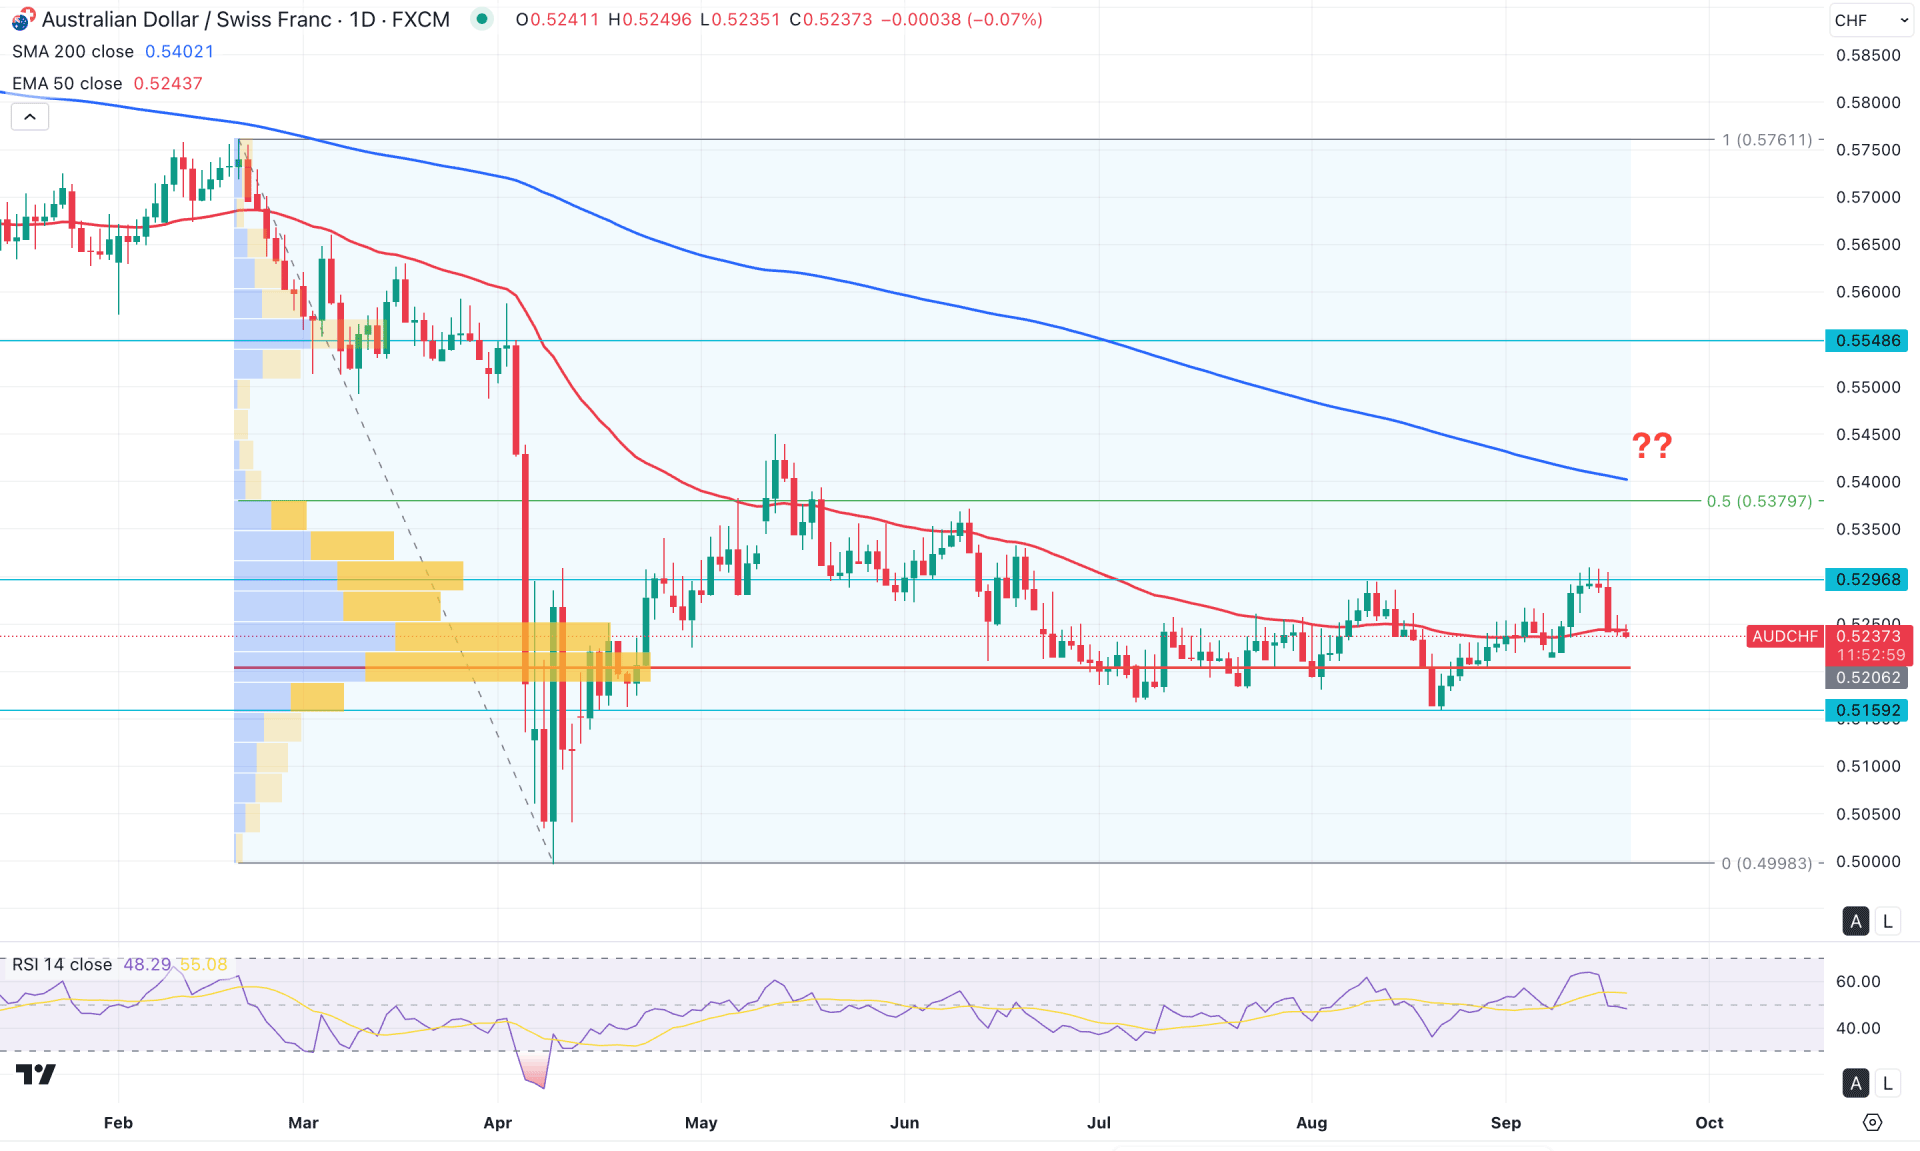
In the daily chart of AUDCHF, ongoing selling pressure is visible as the price failed to overcome the 50% Fibonacci retracement level of the March 2025 to April 2025 swing. As the current price remains bearish following a liquidity sweep from the 0.5296 level, further downside pressure could emerge.
Looking at the higher timeframe, the bearish continuation remains valid as the most recent price action stays sideways within a broader downtrend. Multiple Gravestone Doji candle formations have appeared over the last two months, signalling a potential continuation after a bearish breakout. The weekly chart tells a similar story, with a range-bound market present, supported by a strong bearish trend.
In terms of volume, the price is trading within an order-building zone, where the largest activity level is at 0.5206. Even though the overall market momentum is bearish, the fact that the high-volume line remains below the current price suggests buyers are attempting to push higher. In this case, a bearish continuation opportunity might develop if the price breaks below the high-volume line.
On the main price chart, the 200-day Simple Moving Average acts as a major resistance level, currently hovering above the 0.5370 static level. The long-term market trend remains bearish as long as the 200-day SMA stays above the current price with a downward slope. Moreover, the 50-day EMA is also above the current price, and investors should monitor how the price reacts to the ceiling pressure beneath it.
In the indicator window, the Relative Strength Index (RSI) reflects corrective pressure, with the current line holding near the neutral 50.00 area. The trend strength is not solid, as shown by the Average Directional Index (ADX), which remains below the 20.00 threshold.
Based on the overall structure, the major momentum remains on the sell side, and any bearish opportunity could provide a high-probability trading setup. A break below the high-volume level of 0.5206 could serve as an early short entry. On the bearish side, the immediate support lies at 0.5152, but a clear open space exists below this level, with the next psychological target at 0.5000.
On the bullish side, failure to sustain momentum below the 50-day EMA could signal early bullish order-building. However, a strong long opportunity requires a proper breakout and consolidation above 0.5379. In that case, a bullish move might target the 0.5761 resistance level.
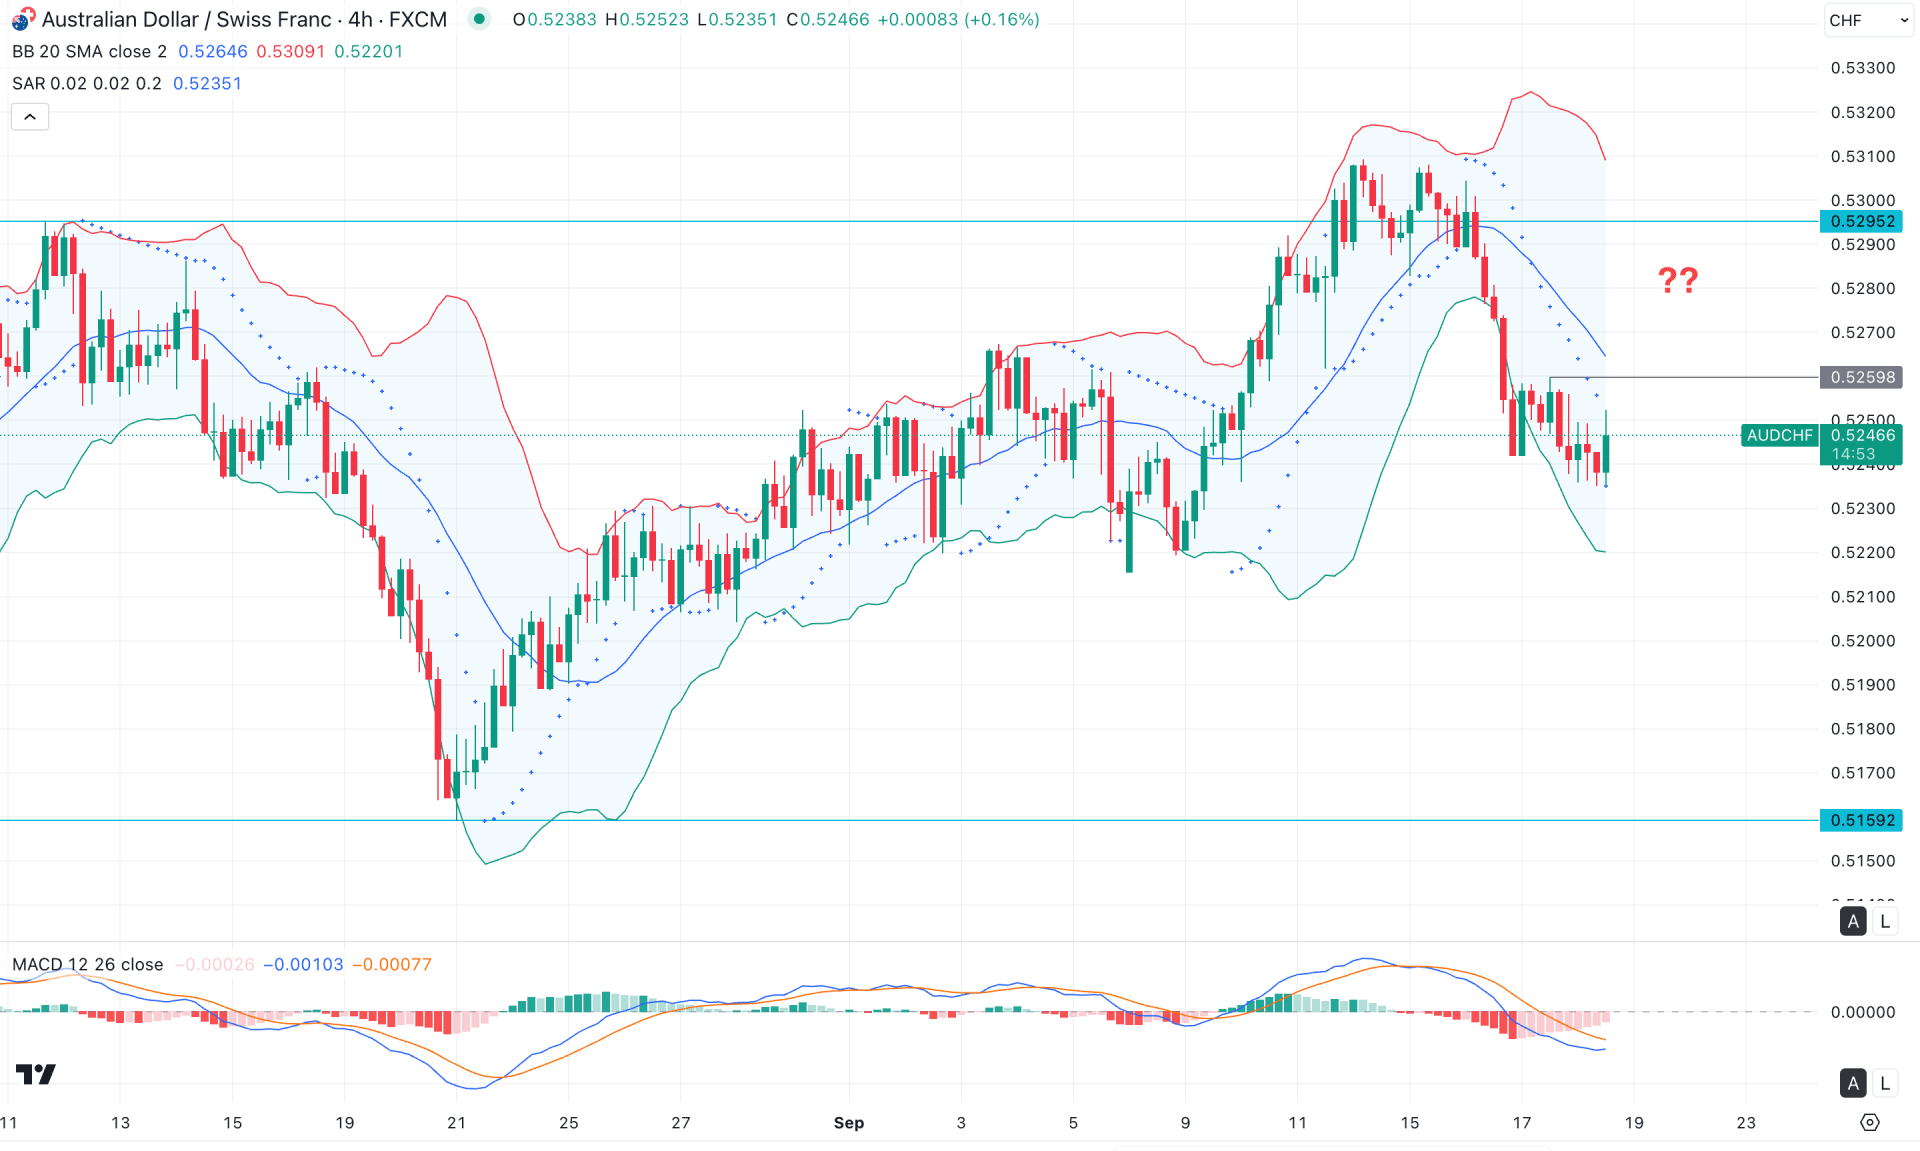
In the four-hour timeframe, corrective market momentum is present, with the most recent price trading below the mid-Bollinger Band line. However, the lower Bollinger Band level remains l, which signals a possible bearish continuation in the coming hours.
In the secondary indicator window, the MACD histogram has flipped its position and started moving toward the neutral area. Moreover, the signal line has found a bottom and is attempting to form a bullish crossover. According to these indicator readings, there is an early sign of a bullish reversal, but more confirmation is needed from the price action.
Based on this outlook, a buy-side liquidity sweep followed by an immediate recovery from the mid-Bollinger Band line could provide a potential short opportunity, targeting the 0.5200 psychological level.
On the other hand, if immediate bullish pressure emerges and the price fails to hold momentum below the 0.5220 level, a potential long opportunity could arise. In that case, a bullish recovery above the mid-Bollinger Band line, with consolidation above this level, would be required. On the bullish side, the immediate resistance is at 0.5259, while the ultimate upside target could be the 0.5301 level.
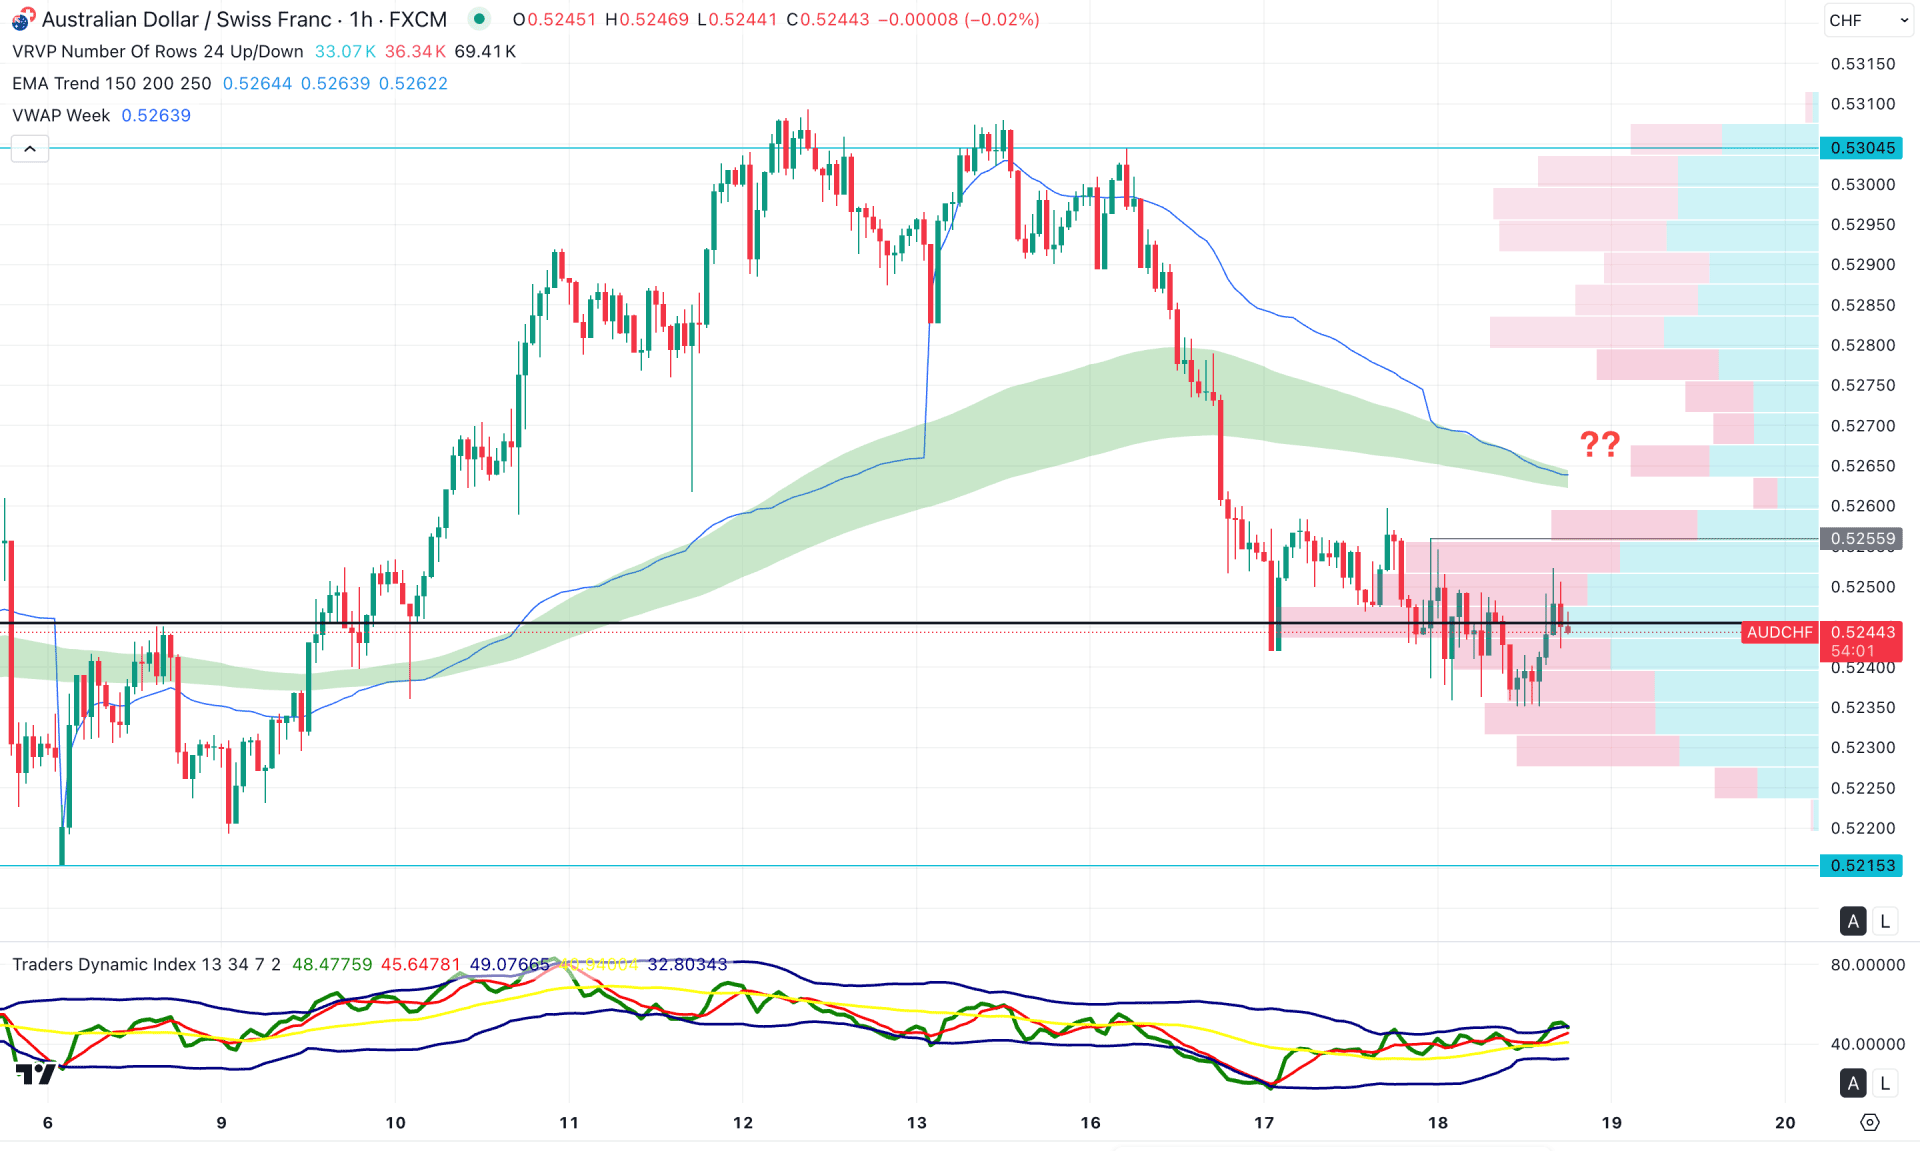
On the hourly timeframe, the price is trading bearish, as the Exponential Moving Average (EMA) wave is acting as resistance, aligning with the weekly VWAP level. Further confluence is evident as the nearby high-volume node lies close to the current price. A bearish continuation is likely, with a potential drop-base-drop formation, as no significant buying pressure is visible from the recent price zone.
On the other hand, the Traders Dynamic Index (TDI) is maintaining sideways momentum after forming a bottom. However, more confirmation signals are required before anticipating a trend-trading opportunity.
Based on the current structure, a bearish continuation is possible if the price breaks below the high-volume level with a strong bearish hourly candle. Conversely, a break above the 0.5255 resistance level could mark a significant achievement for the bulls, potentially offering an early long opportunity.
A more reliable long setup may emerge if the price consolidates above the 0.5270 level, especially after overcoming the VWAP line. On the bullish side, the ultimate resistance lies at 0.5304, and surpassing this level could pave the way for a move toward the 0.5500 area.
Based on the broader market structure, AUDCHF is currently trading within a range and is positioned near the lower boundary. While the overall market momentum remains bearish, a minor bullish correction could be expected from this area. A valid bearish reversal from higher levels may provide a trend continuation opportunity.


