
Published: March 26th, 2026
Australian families were relieved on Wednesday that the country's inflation rate remained relatively stable in February. Despite slowing from 3.8% to 3.7% year over year, the Consumer Price Index (CPI) remained above the Australian Reserve Bank's 3% objective.
After being revised lower from 3.4% to 3.3% in January, the adjusted mean CPI remained 3.3% YoY.
It's important to note that the data was gathered before the Middle East crisis, which has caused oil costs to skyrocket globally and increased the risk of inflation.
The Iran war has consolidated financial conditions, according to RBA Assistant Governor Christopher Kent, who also stated that the supply shock could lead to inflation.
The RBA lifted the interest rate to 4.1% last week, with a tight vote split. Governor Bullock of the RBA claimed that the timing was more important than the policy position.
In addition, rising oil prices have fueled concerns about the global economy, while they remain beneficial for the commodity-linked CAD.
Let's see the complete price outlook from the AUDCAD technical analysis:
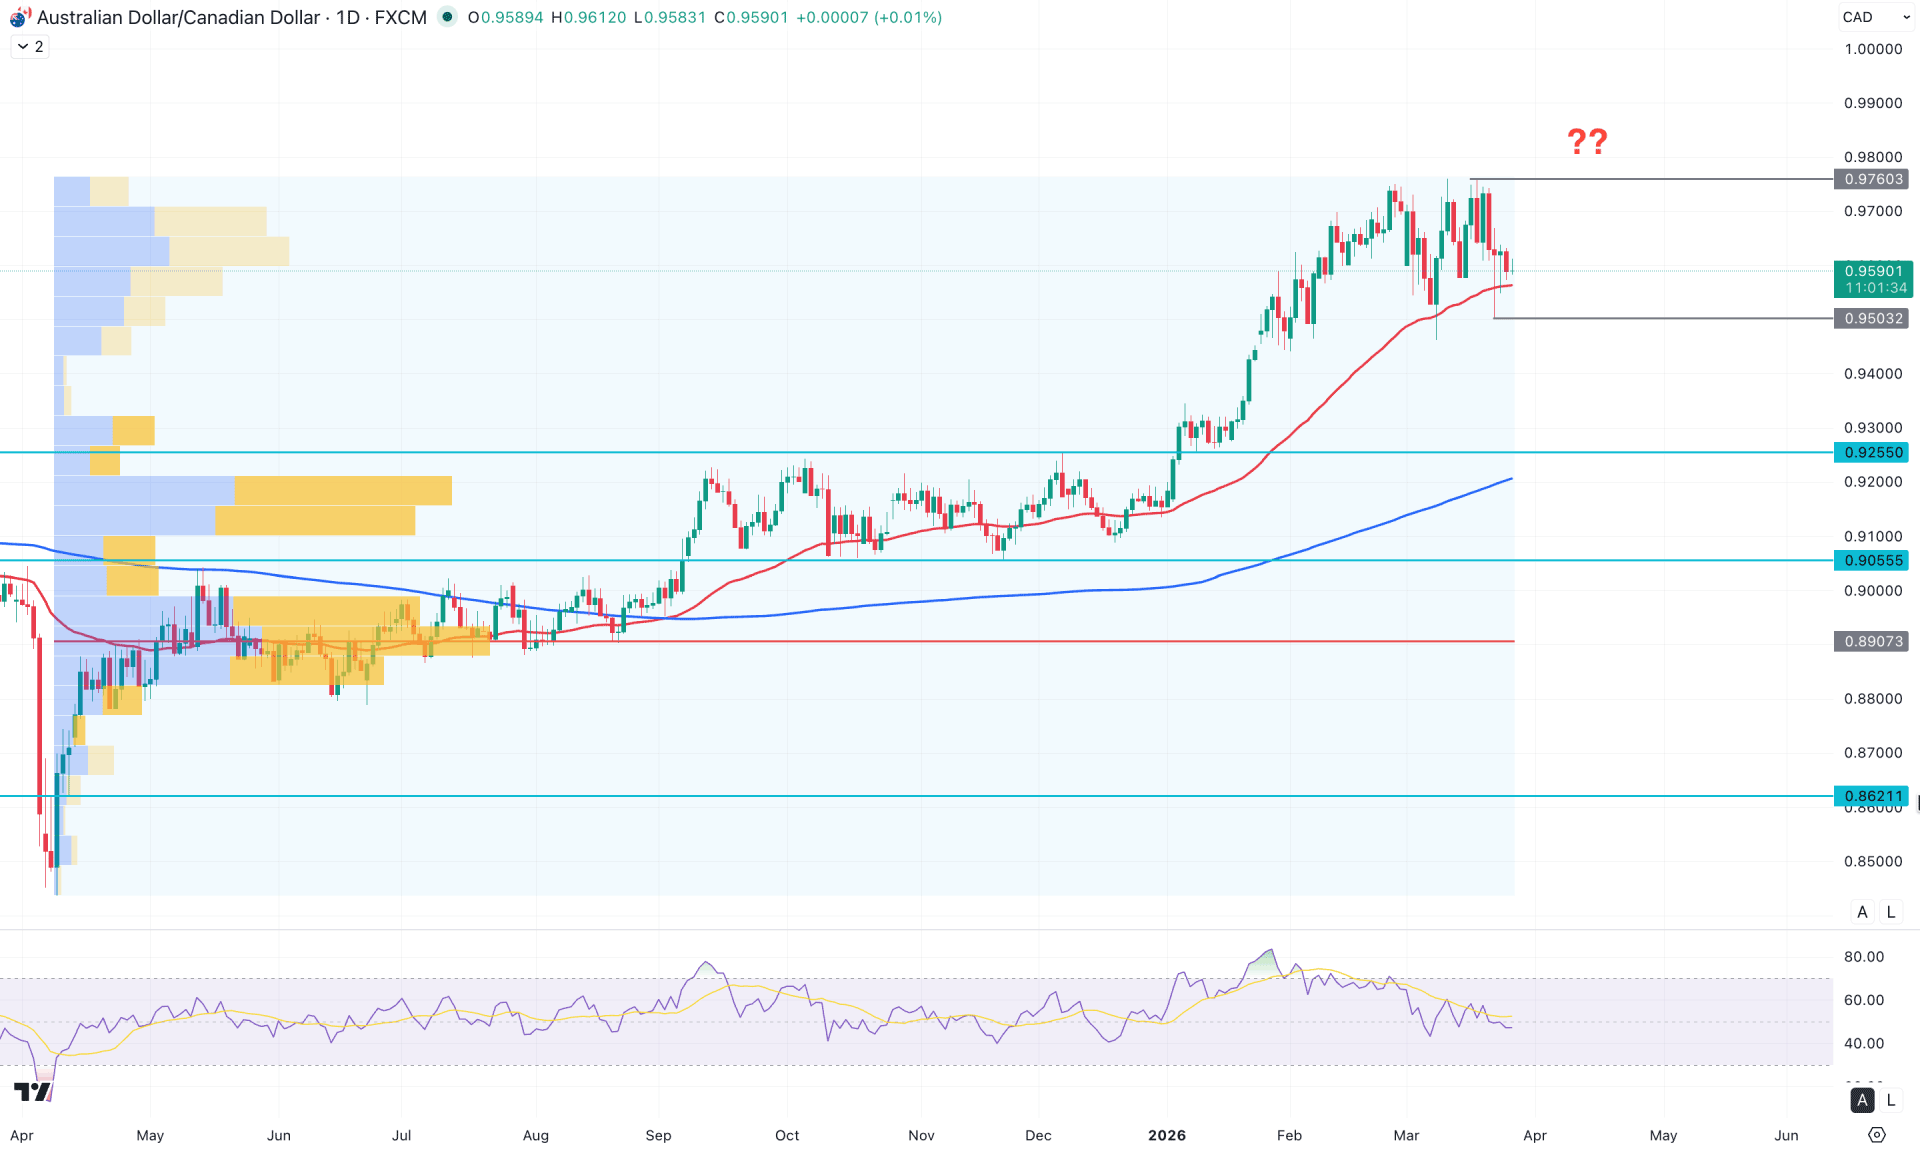
In the daily chart of AUDCAD, the market momentum is sideways, as the price has been trading within a range for a considerable period. In the chart above, we can observe a ranging market structure for almost a month following a decent bullish trend.
In the higher timeframe, the overall market momentum remains bullish, with a solid base formation evident from two consecutive bullish monthly candles. However, the price reached a multi-year high but failed to sustain buying pressure above the February 2026 peak, signalling a weaker bullish momentum. The weekly chart shows multiple indecision candles, indicating extreme volatility, which could create a potential downside correction opportunity.
In terms of volume, some minor high-volume activity has formed near the bullish peak area, which might trigger a short-term downside move, followed by a potential major reversal around the key high-volume level at 0.8908.
On the main price chart, price has tested the 50-day Exponential Moving Average twice in the past month and remains above it. Moreover, the 200-day Simple Moving Average remains well below the current price and continues to act as a strong support level. However, as the price struggles to maintain buying pressure above the 50 EMA, a solid bearish break and daily close below this level could provide a valid short opportunity.
In the indicator window, the Relative Strength Index (RSI) is hovering around 50.0, indicating a lack of clear trend direction. The RSI has moved sideways after previously reaching the overbought 70.0 level and forming a divergence. This suggests a potential bearish top formation that requires confirmation via a valid bearish rejection before anticipating a trend reversal.
Based on the overall market structure, AUDCAD is currently trading within a highly volatile range. A breakout from this range could resume the existing bullish trend. As long as the price remains above the 50-day EMA, a bullish continuation with a daily close above the 0.9700 psychological level could offer a solid long opportunity, potentially pushing the price toward the 0.9800 area.
On the bullish side, a breakout above the 0.9760 swing high could drive the price toward the 0.9937 extension level.
Alternatively, a bearish scenario would involve a daily close below the 50 EMA. A strong bearish daily candle below the 0.9503 level could push the price down toward the 0.9255 level before forming another potential long opportunity.
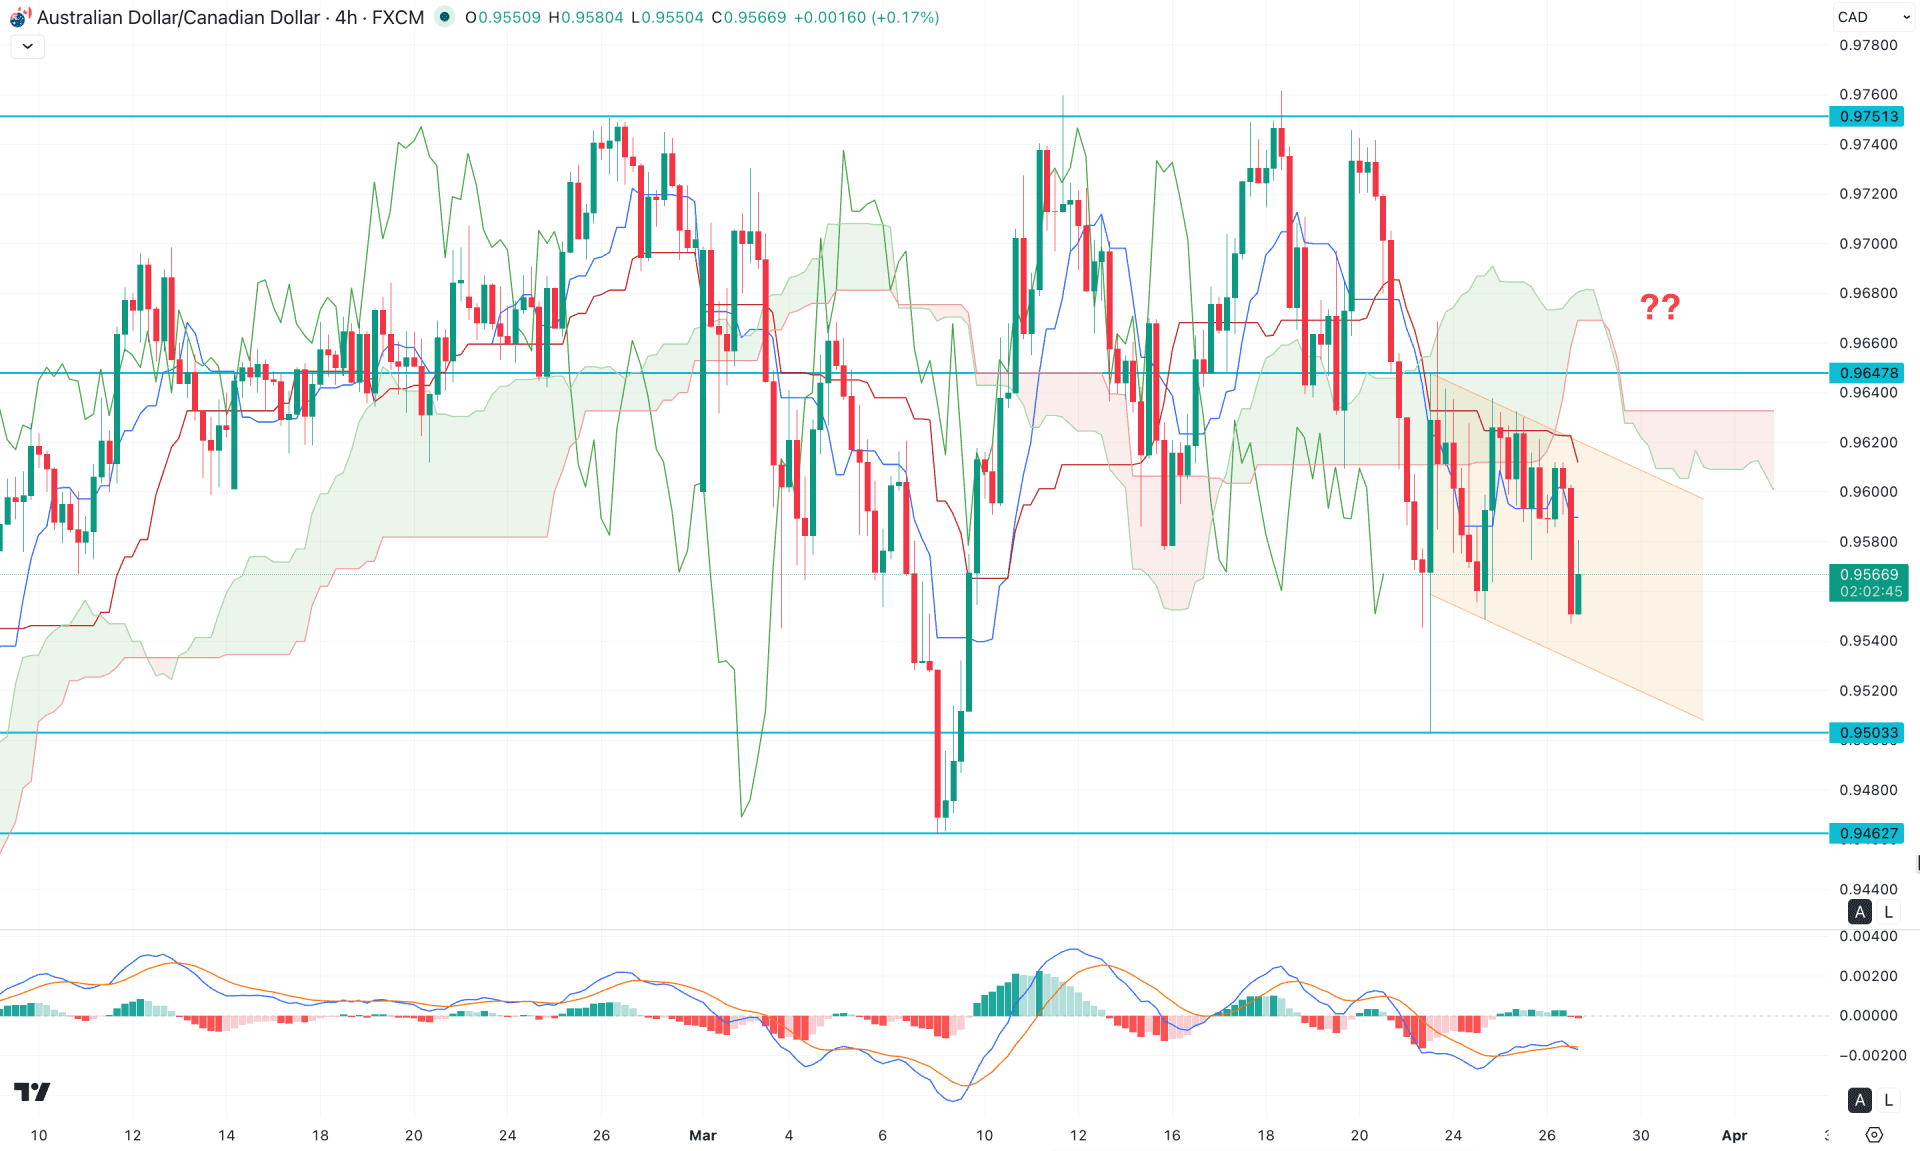
In the four-hour timeframe, the price is trading in extremely volatile conditions. The most recent price action shows selling pressure below the Kumo cloud area. Moreover, the future cloud is bearish, with both leading spans trending downward, signaling continued bearish momentum.
In the indicator window, momentum remains sideways, as the histogram has stayed near the neutral line for a considerable period. Additionally, the signal line is below the neutral level, with no clear sign of a valid bullish recovery.
Based on the current market structure, further downside corrective pressure is likely in the AUDCAD chart. The immediate support level is located at 0.9503, which serves as the primary target. However, investors should closely monitor how the price behaves around the channel support. A strong bullish reaction from the 0.9503 to 0.9440 area could open up a corrective bullish opportunity, targeting the 0.9700 level.
Before anticipating a long-term bullish move, a stable price above the 0.9751 level, supported by consolidation, is required.
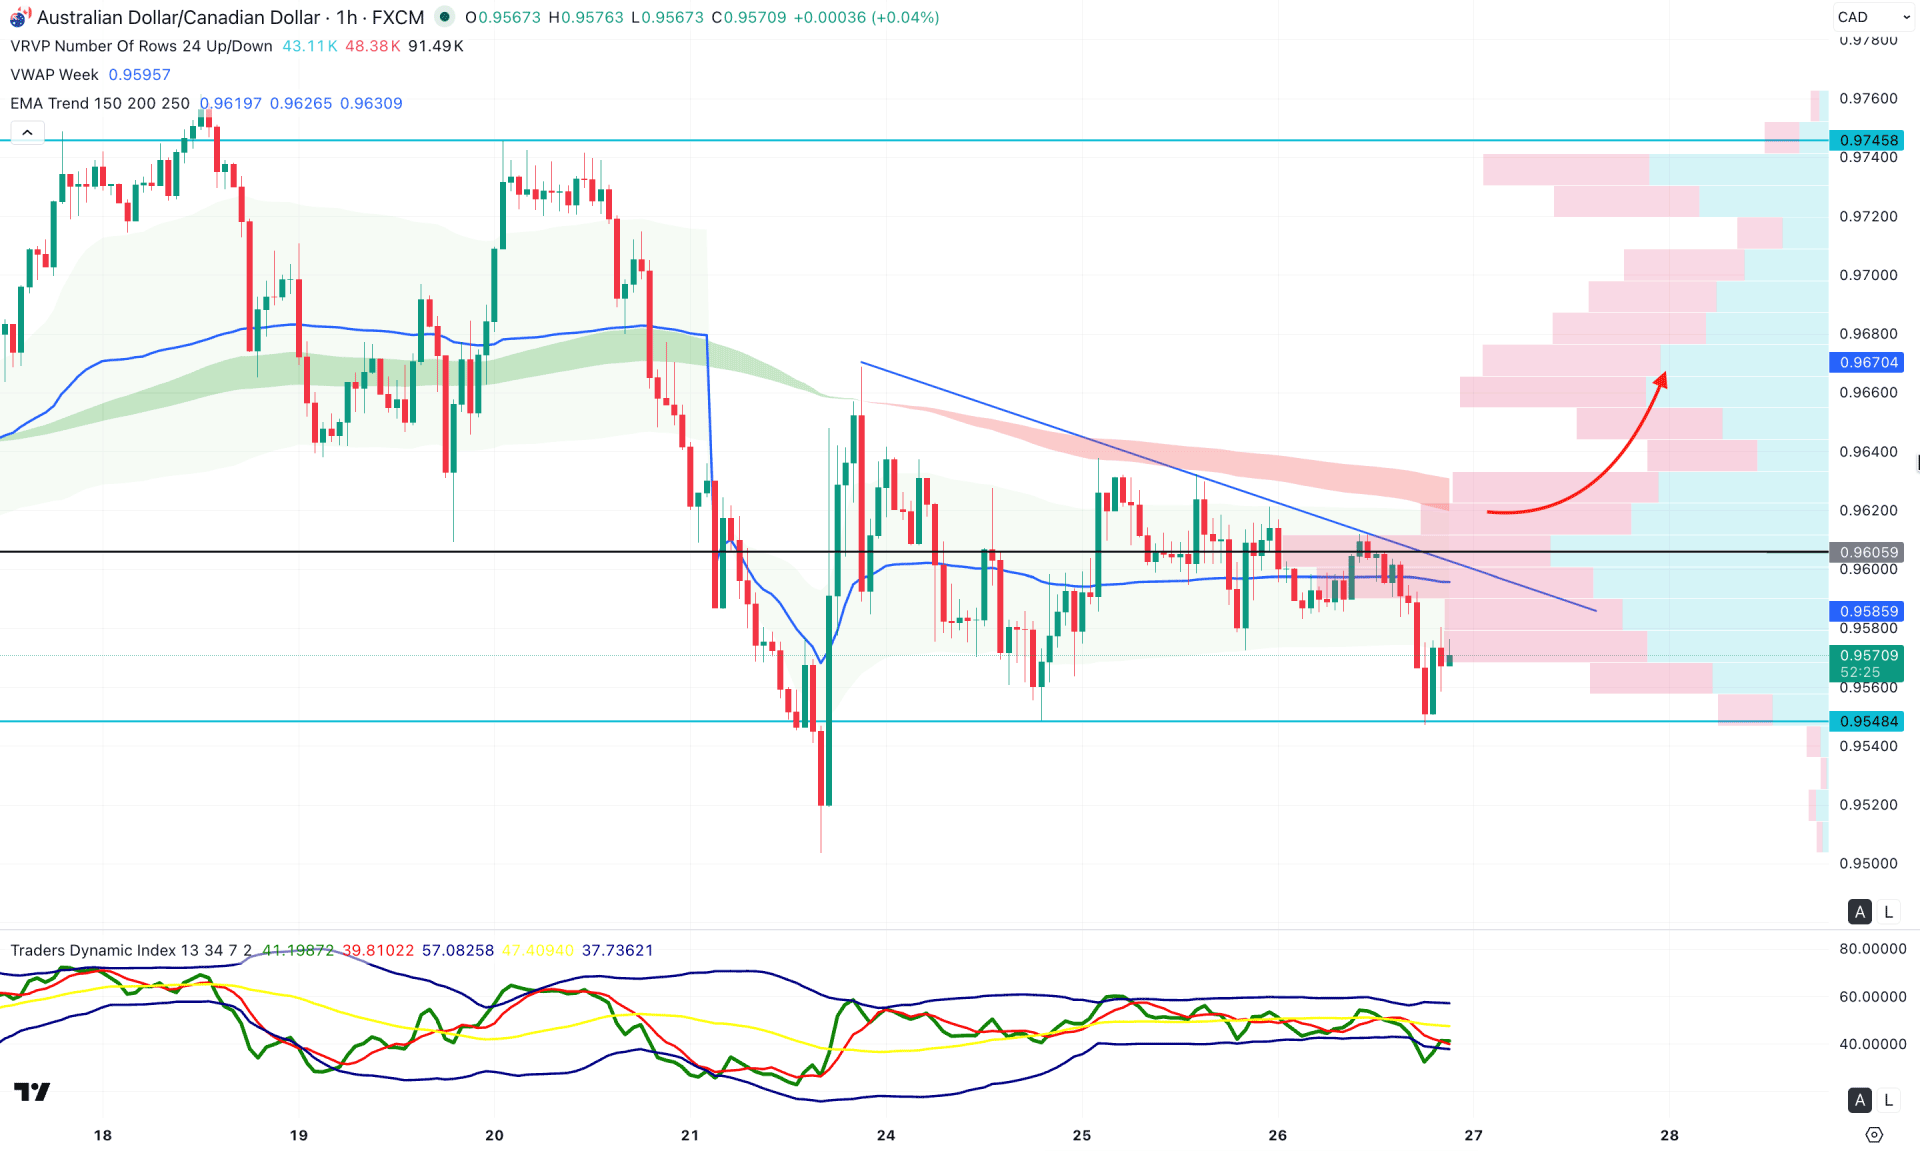
In the hourly timeframe, the AUDCAD intraday price shows corrective bearish pressure, driven by resistance from a falling trend line. As a result, the price dipped lower and tested the weekly support at the 0.9548 level. However, the most recent price is showing a minor bullish recovery, and additional confirmations are needed before targeting an intraday bullish opportunity.
In technical indicators, the weekly VWAP and EMA waves are above the current price and bearish. However, an early buying signal is present in the Traders Dynamic Index (TDI), where the current TDI line is moving upward from the extreme bearish condition.
Based on this outlook, the ongoing market pressure remains bearish, with the high-volume resistance at the 0.9605 level as a crucial barrier. Breaking through this line could open the way to the 0.9700 level.
On the other hand, a minor upward pressure and failure to overcome the EMA Wave might limit the gain and increase the possibility of testing the 0.9462 support level.
As per the current findings, AUDCAD is trading within a volatile structure, from where a solid bearish break could validate the Pump and Dump. As the intraday price is still bullish, some upward correction might occur shortly.


