
Published: April 24th, 2025
Wednesday saw an increase in the AUDCAD pair while the Canadian dollar (CAD) continued to face pressure. This followed remarks made by US President Donald Trump that a 25 percent tariff on Canadian vehicle imports to the US might be raised. According to Reuters, Trump highlighted attempts to reach an agreement with Canada to increase US automobile production and lessen dependency on foreign automobiles.
A further factor hurting the Canadian dollar (CAD) is the International Monetary Fund's (IMF) reduced revision of Canada's 2025 GDP growth prediction to 1.4%, which has sparked fresh worries about declining domestic demand. The Bank of Canada's (BoC) cautious approach, partly prompted by the continued uncertainty around possible US tariffs, is further demonstrated by its decision to maintain its standard interest rate at 2.75%.
On the other hand, the Australian economy depends on exports to China, and reducing conflicts between Washington and China would benefit the AUD.
At home, the Australian dollar may be impacted by the growing likelihood that the Reserve Bank of Australia (RBA) will lower interest rates during its May policy conference. Westpac analysts predict that in May, the RBA will lower its Official Cash Rate (OCR) by twenty-five bps to 3.85% in response to mounting concerns about inflation and worldwide economic expansion.
Let's see the further aspect of this pair from the AUDCAD technical analysis:
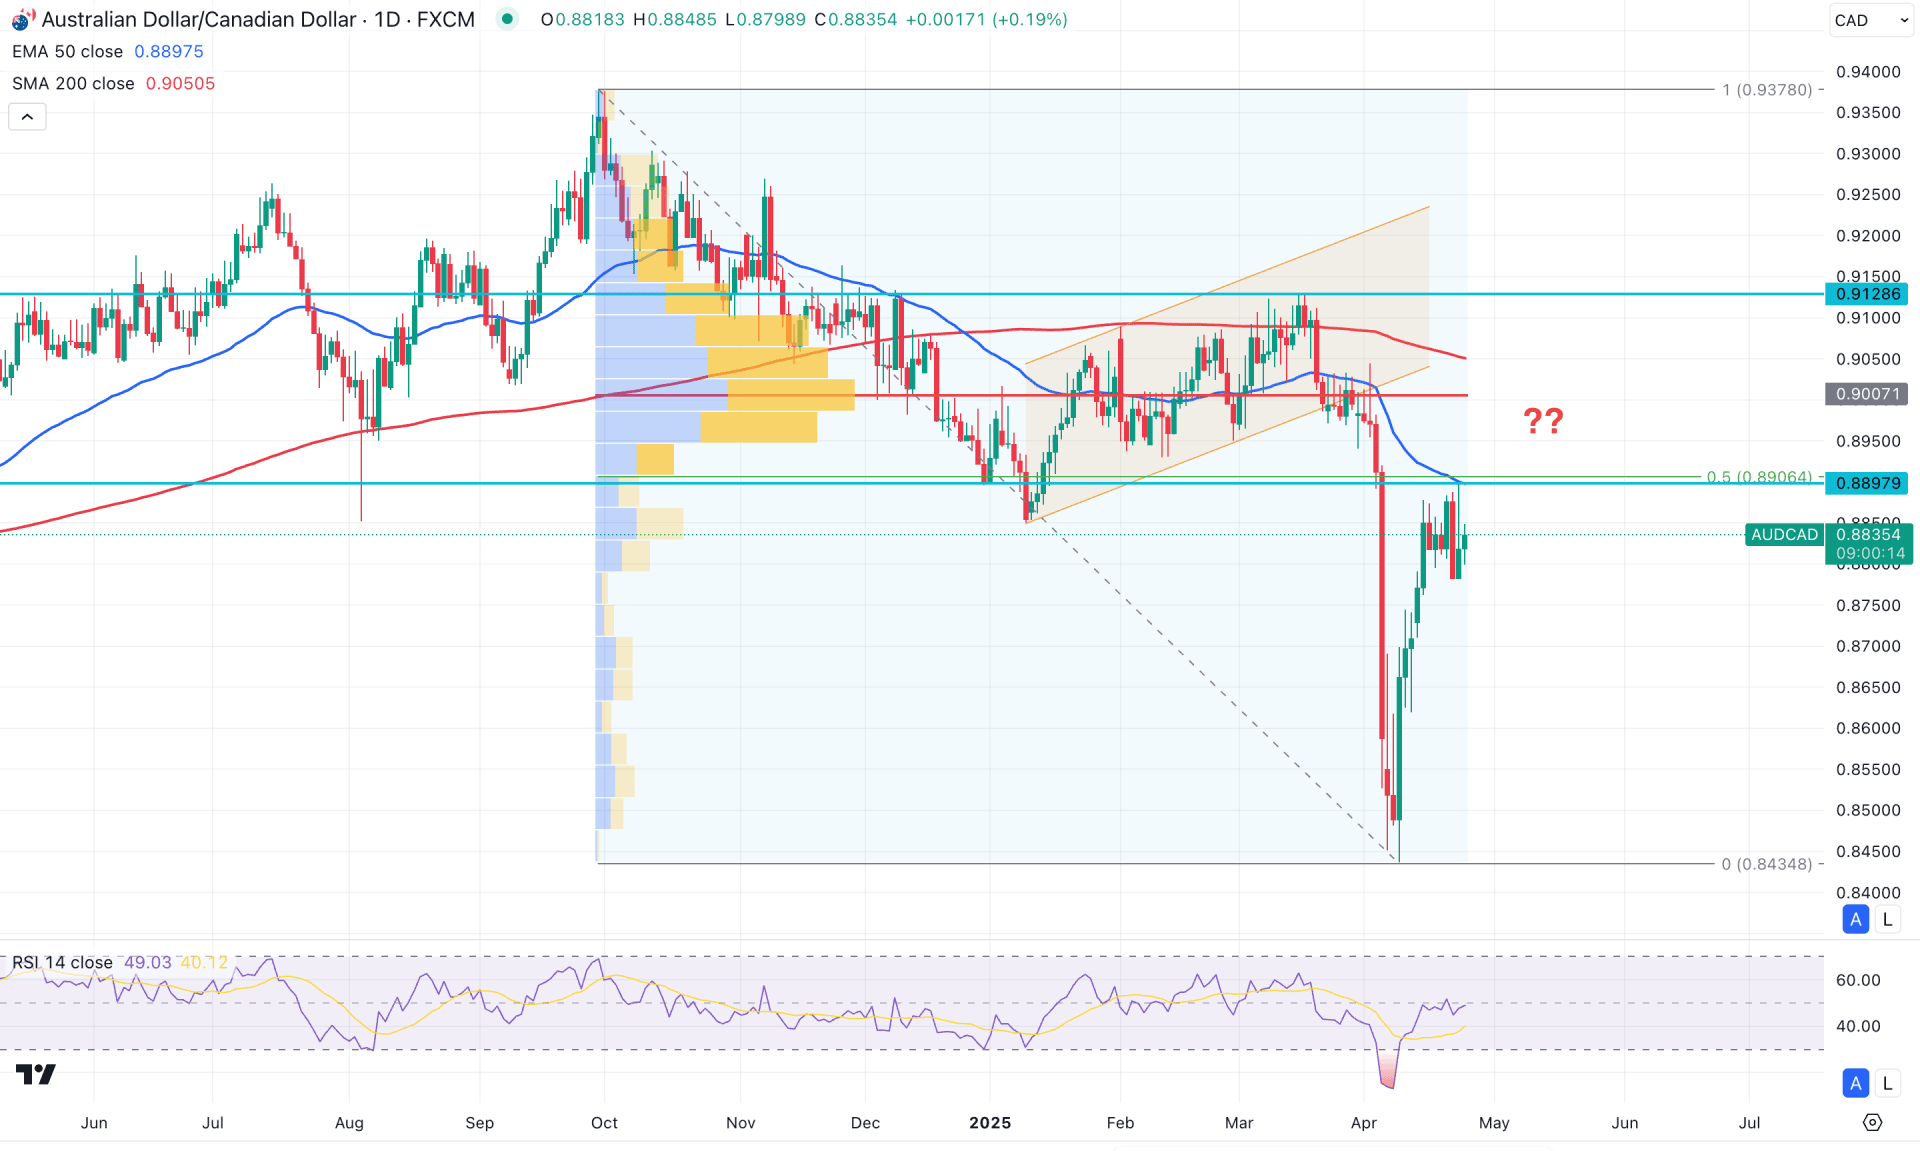
In the daily chart of AUDCAD, ongoing bearish momentum is visible, with the current price hovering below a crucial supply zone. Investors might expect the downside pressure to extend as long as the market trend remains intact.
In the higher timeframe, the ongoing market trend is bearish with a corrective momentum in the monthly time frame. However, the downward pressure is clear in the weekly chart, where the recent candles are aiming higher as a minor correction.
In the volume structure, the most active level since September 2024 is above the current price, working as a confluence bearish signal. Larger institutions primarily support the ongoing market momentum, which might lead to a potential bearish continuation.
In the main price chart, the 200-day Simple Moving Average is the major resistance, remaining above the current price with a bearish slope. Moreover, the 50-day Exponential Moving Average is closer to the current price, working as an immediate resistance.
On the other hand, the RSI line clearly shows a bullish recovery, showing a rebound from the 30.00 oversold level. Moreover, the ADX has a downward slope, and the current line is still above the 20.00 satisfactory line.
Based on the current market outlook, the broader market direction will remain bearish for the AUDCAD price. However, the recent bullish V-shape recovery with a consolidation at the 50-day EMA signals a pending buy-side liquidity sweep before validating the downside continuation. In that case, any bearish opportunity from the 0.8897 to 0.9100 area could be a high-probability short opportunity aiming for the 0.8500 level.
On the other hand, an extended bullish pressure with a stable price above the 0.9000 high volume line could increase the bullish possibility. In that case, overcoming the 0.9128 level with a bullish daily candle could extend the buying pressure above the 0.9378 level.
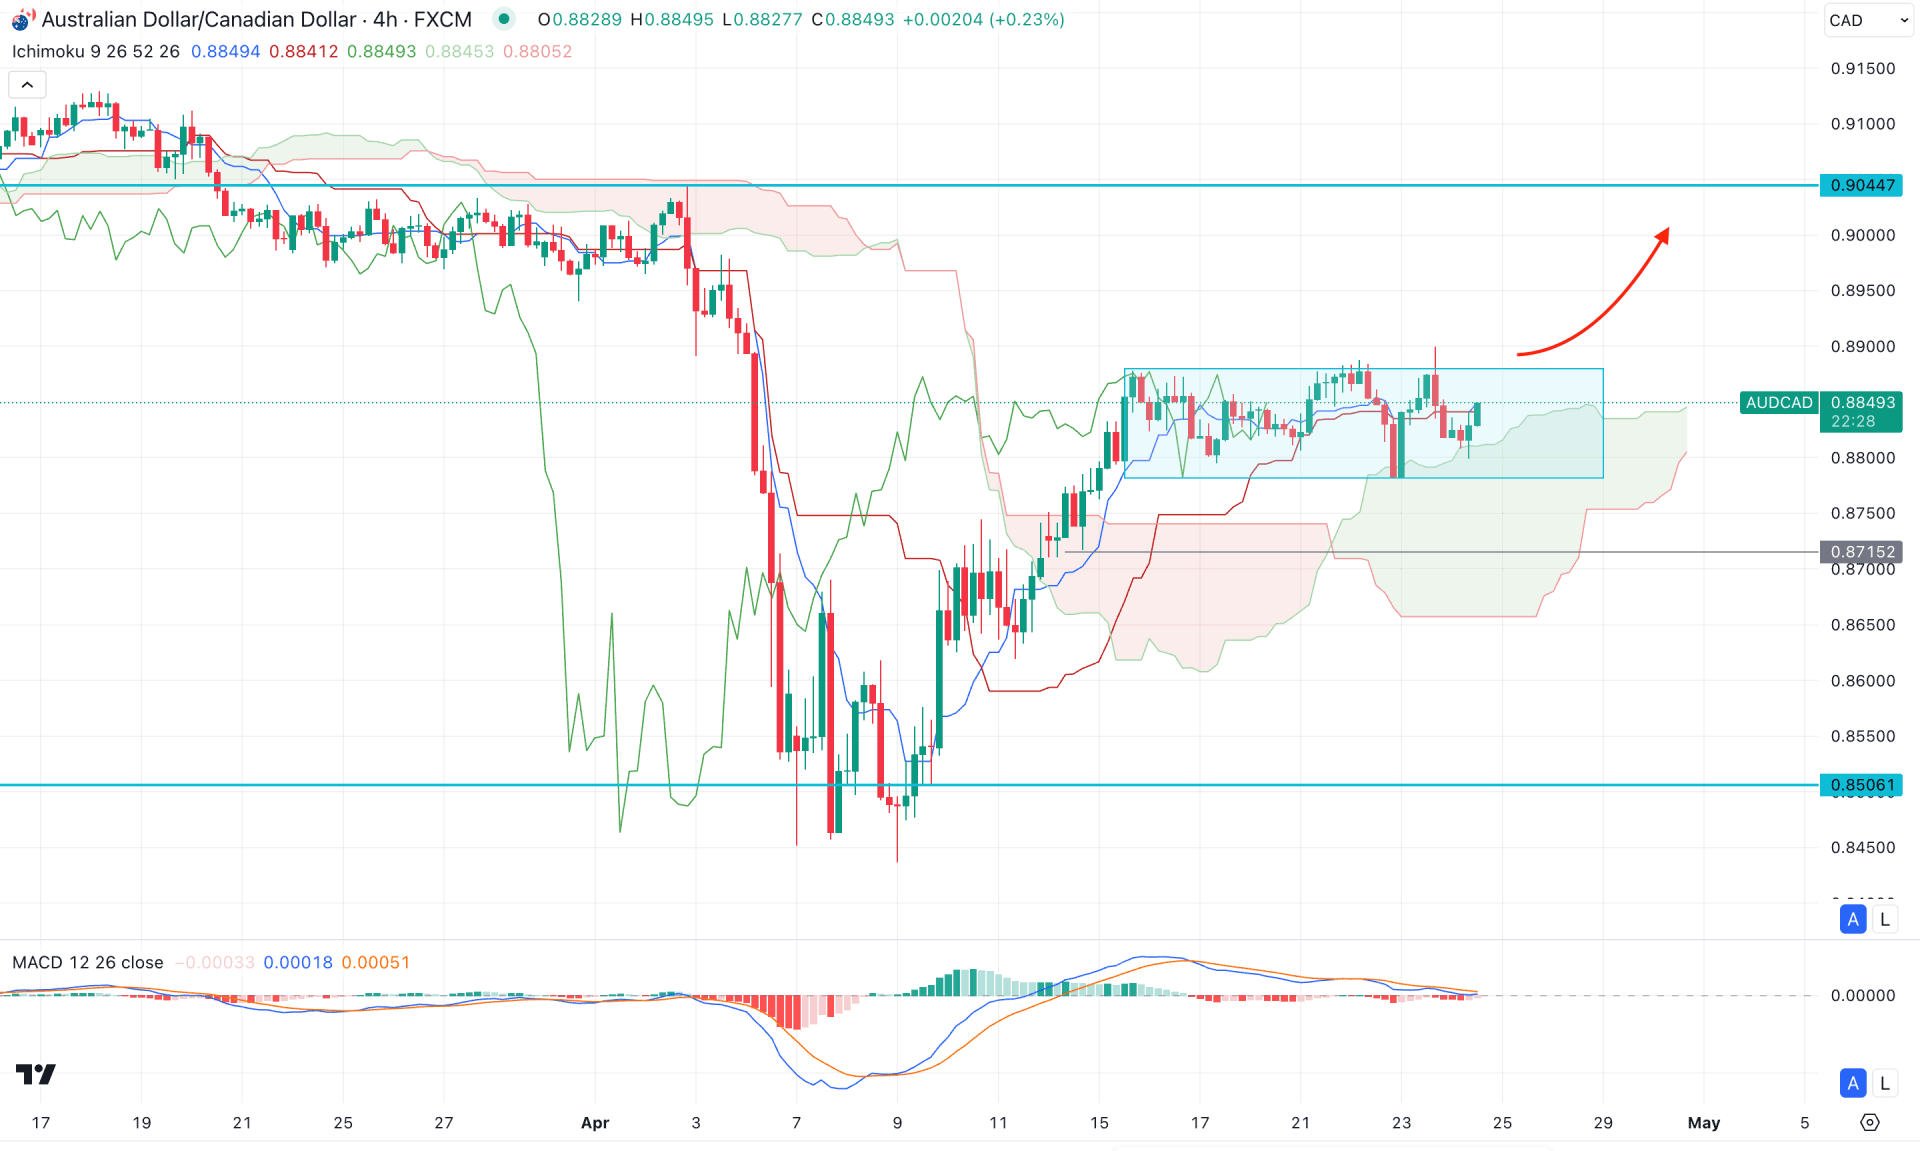
In the H4 timeframe, the most recent price is trading within a rectangle pattern from which a clear direction is pending. However, the Ichimoku Kumo Cloud is below the current price and working as support for bulls.
In the futures cloud, the Senkou Span A remains above the B, with a bullish slope. It is a sign that the medium-term and short-term market momentum is bullish, from which a continuation is possible.
In the indicator window, the MACD Histogram reaches the neutral point, while the signal line is hovering in the bullish area.
Based on the current market structure, a bullish rectangle breakout could be a potential long opportunity, aiming for the 0.9044 level.
On the other hand, a bearish liquidity sweep from the 0.8782 low with an immediate rebound above the Kijun Sen level could be another long opportunity. However, a failure to hold the price above the 0.8715 level could invalidate the bullish opportunity and lower the price towards the 0.8500 area.
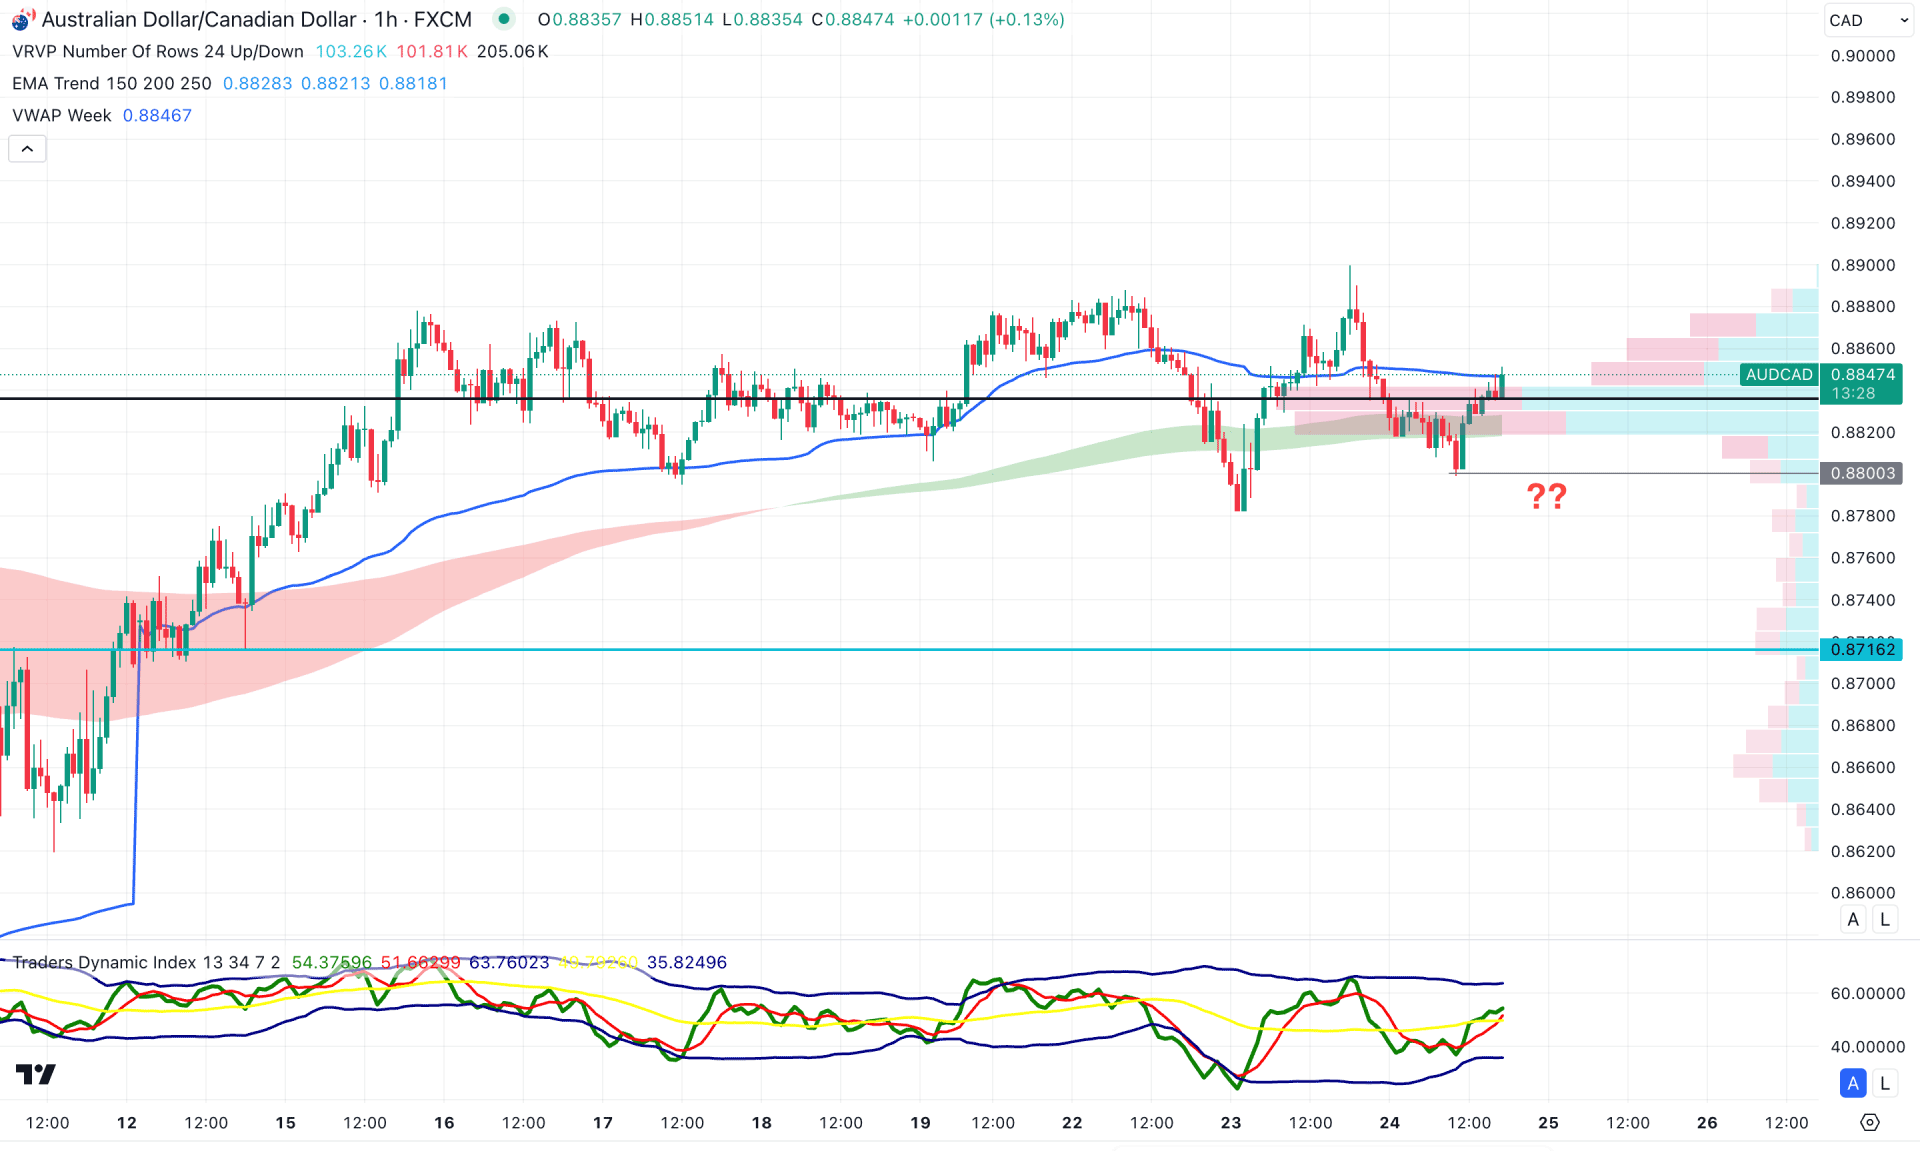
In the hourly time frame, the sideways momentum is clear as the current price is hovering at the visible range high volume line. Moreover, the EMA wave is closer to the current price with a flat pattern, which signals indecision.
In the indicator window, the Traders Dynamic Index (TDI) rebounded above the 50.00 neutral point, suggesting a rebound to bulls.
Based on the current, the sideways pressure is limited as the price is struggling to move higher after the existing upward wave. In that case, a failure to hold the price above the high volume line could be a bearish factor. In that case, an H4 candle below the 0.8800 level could lower the price in the coming hours.
Based on the overall structure, the AUDCAD is facing a strong selling pressure, which might continue after the intraday confirmation. As of now, the intraday bullish pressure is solid from where a failure to move upwards could be an early short opportunity.


