
Published: December 20th, 2023
The RBA emphasized the importance of anticipating supplementary data in order to evaluate the risk balance. This factor takes into account the possibility of an extended period of inflationary pressure. In addition, the board emphasized that the RBA staff forecasts that inflation will surpass the midpoint of the range by the conclusion of 2025, as opposed to the upper limit.
For the coming days, the utilization of a rate cut by the Reserve Bank of Australia during its policy meeting in February is improbable. Nevertheless, the likelihood of the central bank alleviating monetary tightening during the meetings planned for May and June is greater.
Moreover, in its Interest Rate Decision released on Wednesday, the People's Bank of China (PBoC) maintained the benchmark rate at 3.45%, as reported by the Monetary Policy Committee (MPC).
In Canada, the annual consumer inflation rate remained unchanged, according to data released on Tuesday. This prompted traders to modify their forecasts concerning the potential initiation of interest rate reductions by the Bank of Canada (BoC). In conjunction with the recent upswing in crude oil prices following their earlier lows this month, this could sustain the support for the Canadian dollar (Loonie), which is pegged to commodities.
Let’s see the upcoming price direction from the AUDCAD technical analysis:
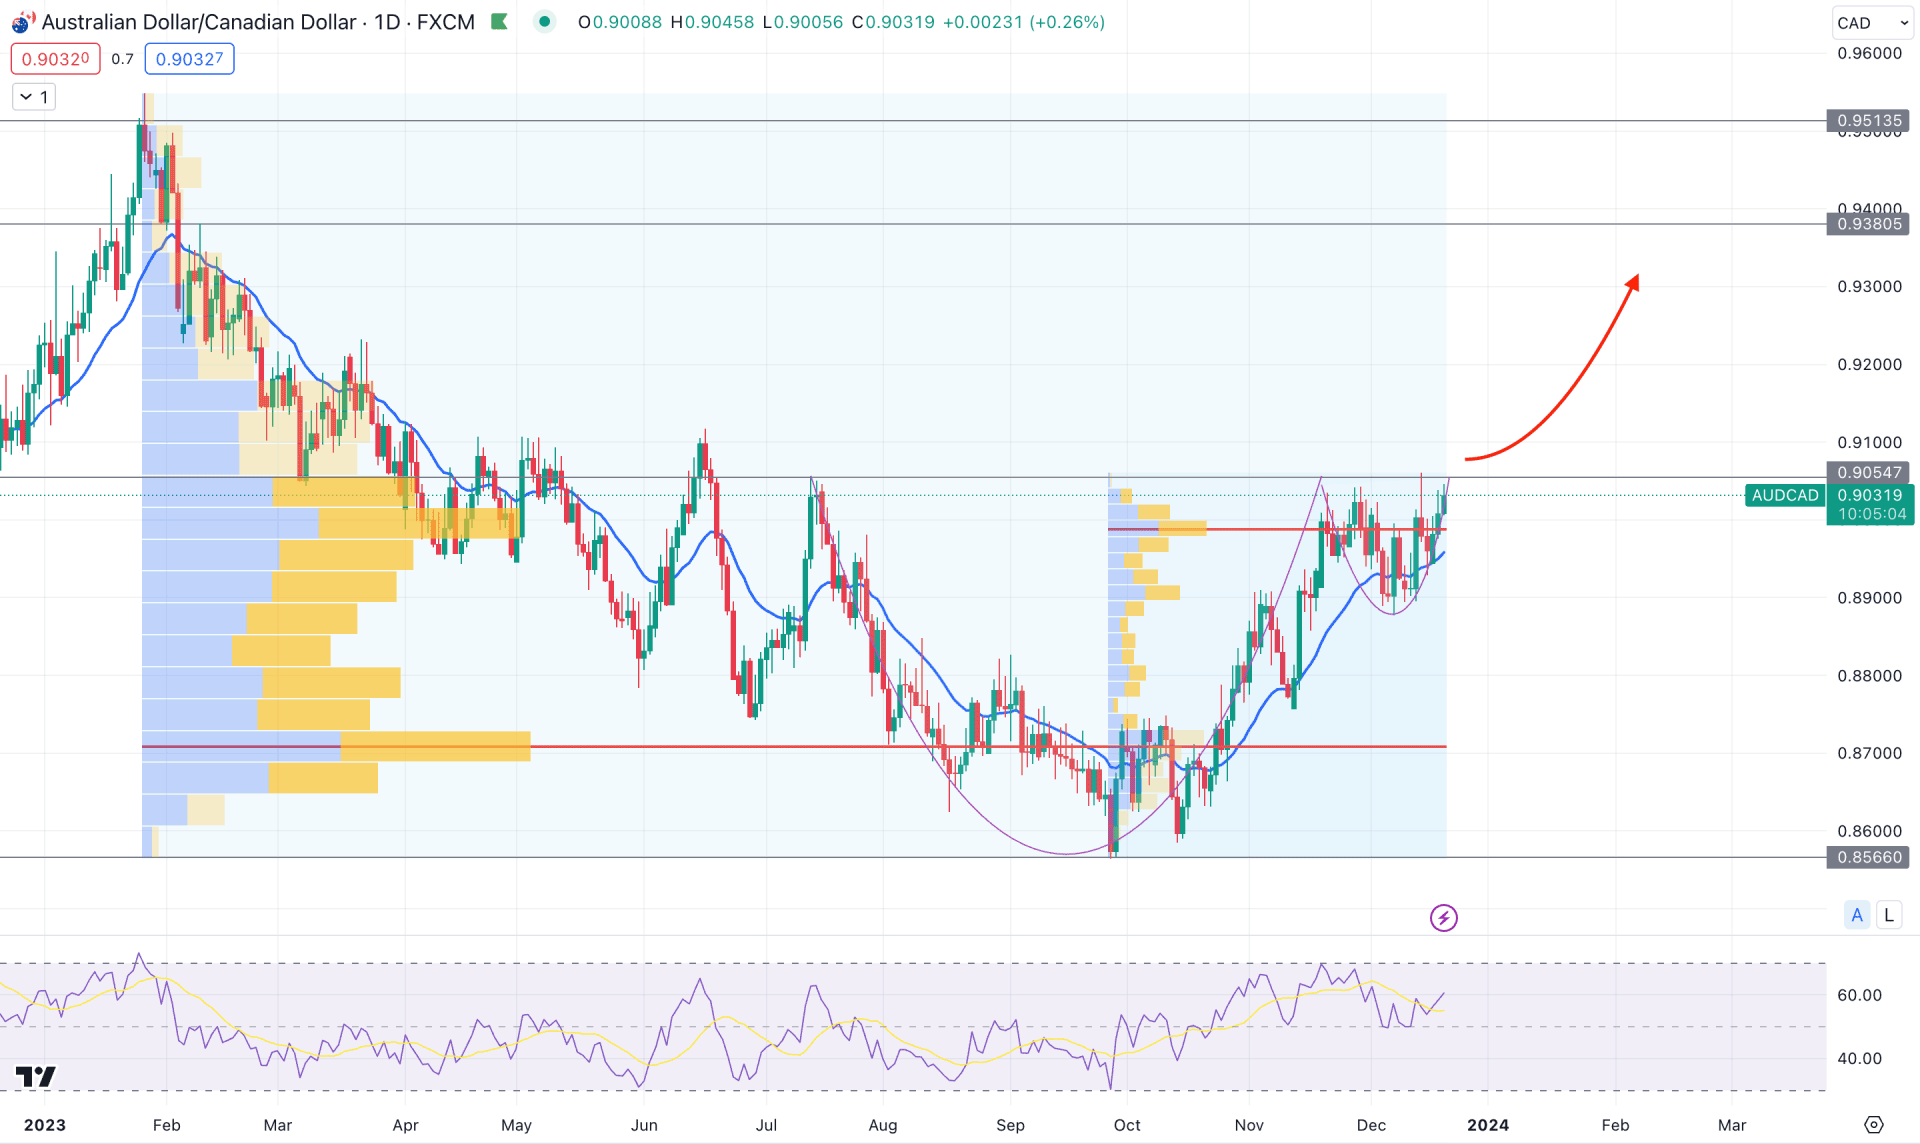
In the daily chart of AUDCAD, the overall market momentum is bearish, where the most recent consolidation at the crucial resistance suggests a possible bullish breakout.
Looking at the volume structure, the most active level since February 2023 is at the 0.8707 level, which is below the current price. As the current price trades above this crucial level, we may anticipate a long opportunity over shorts. Another high volume level since the September low supports the bullish continuation as it remains within the near-term re-accumulation area.
Based on the volume structure, bullish re-accumulation could result in a trend continuation for this pair in the coming days.
In the higher timeframe, we can see that the year's decrease period has come to the point where the current monthly chart suggests a bullish channel breakout. Moreover, the latest weekly candle closed bullish but remained within the previous bearish candle’s body. In that case, a bullish continuation might come after overcoming the 0.9057 static resistance level.
Coming to the daily chart. A 20-day EMA carry is seen, with a bullish pre-breakout structure, where the weekly resistance of 0.9057 is the major barrier to the trend continuation. Moreover, the 14-day RSI shows a bullish momentum by holding the level above the 50.00 line.
Based on the daily market outlook of AUDCAD, a bullish Cup & Handle breakout with a daily candle above the 0.9057 level could be the primary sign of a bullish trend continuation. In that case, the next target level would be at the 0.9380 level.
On the other hand, a failure to hold the price above the dynamic 20-day EMA and a bearish D1 candle below the 0.8900 psychological level could lower the price towards the 0.8556 support level.
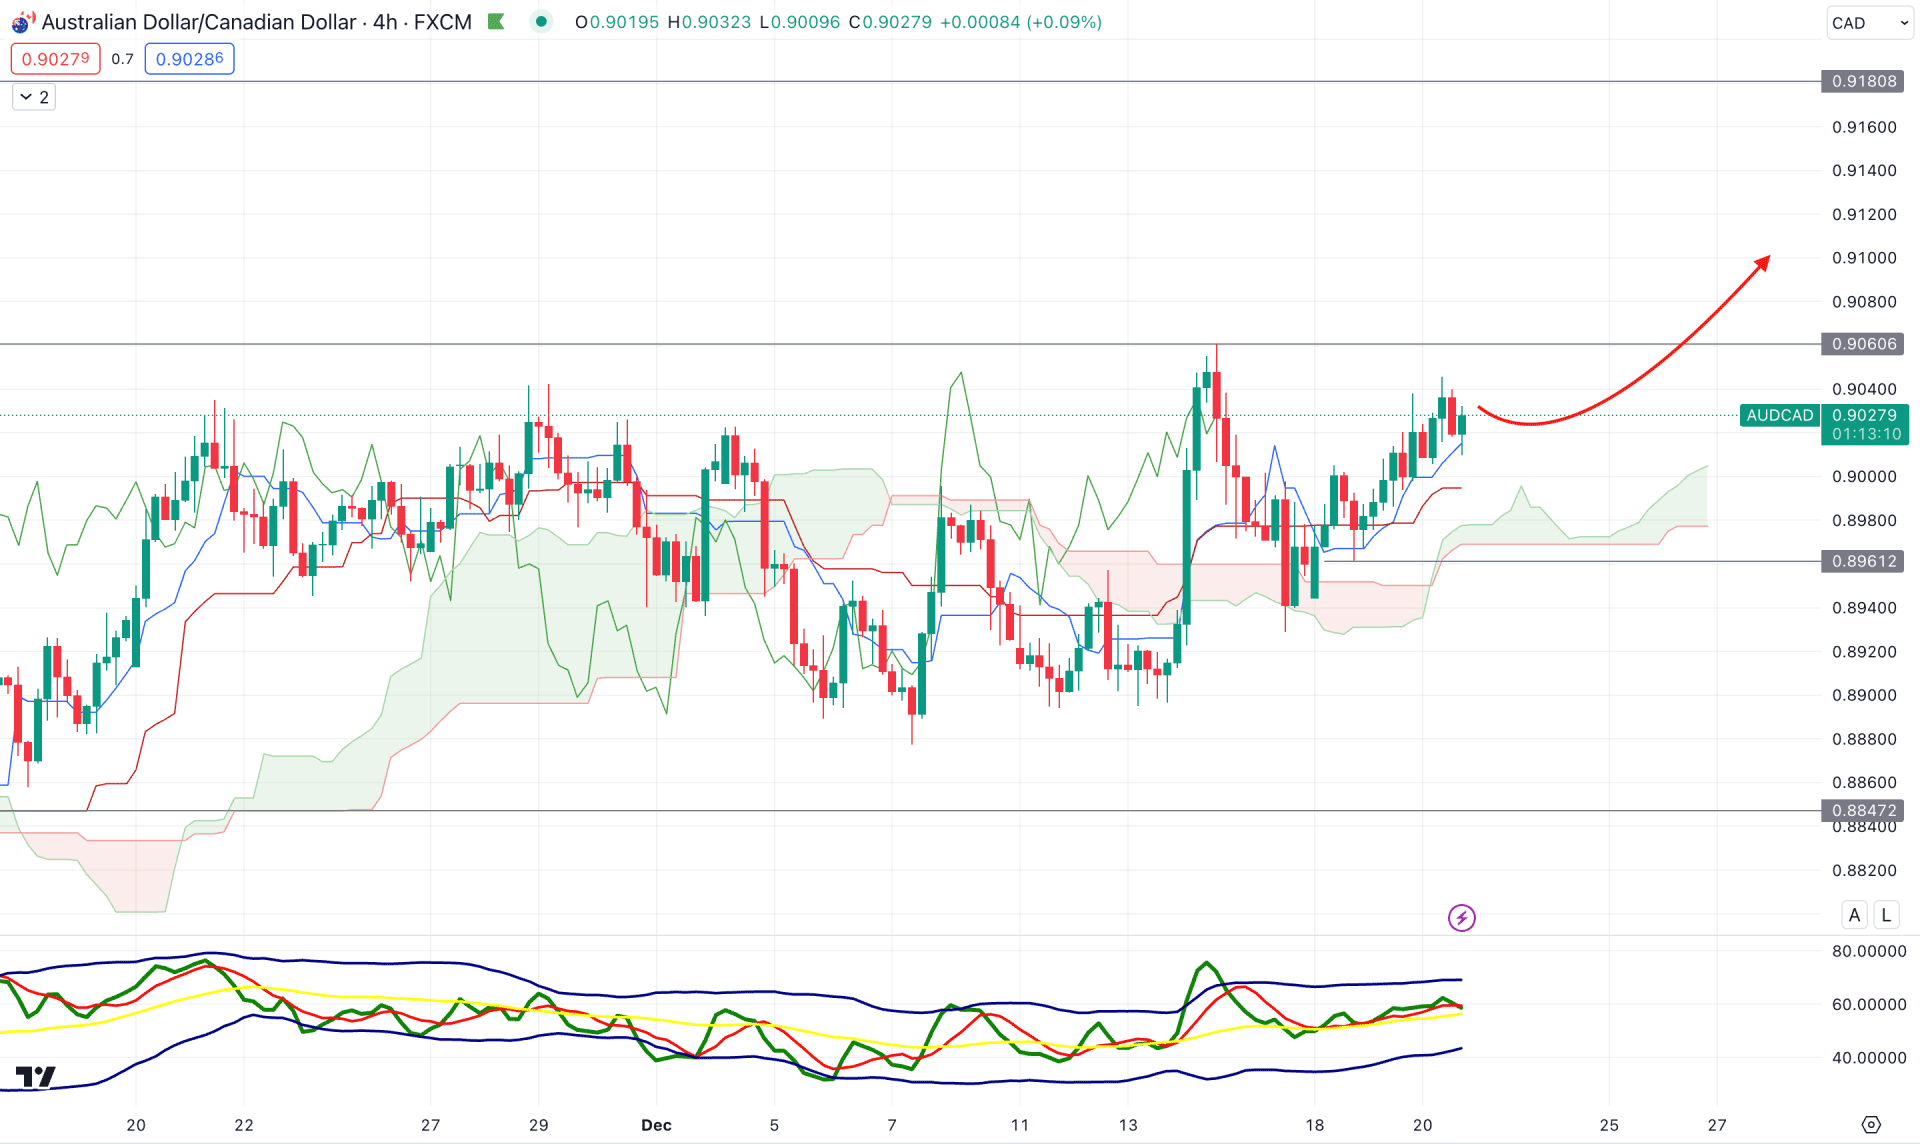
In the H4 chart, the future cloud is bullish as the Senkou Span A is above the Senkou Span B with bullish traction. Moreover, the dynamic Tenkan Sen and Kijun Sen are working as immediate support, from where another buying pressure could come.
In the secondary window, the Traders Dynamic Index (TDI) remains at the neutral 50.00 line, which indicates less trading activity in the market. However, the upward continuation is potent as long as the TDI level is above the 50.00 line.
Based on the current market outlook, a bearish correction and a bullish rejection from the dynamic Kijun Sen level could be long opportunities in this pair. In that case, a daily candle above the 0.9060 high could extend the gain towards the 0.9180 level.
On the other hand, the dynamic Cloud support could be a crucial barrier for sellers. Therefore, a bearish H4 candle below the 0.8961 level could lower the price towards the 0.8847 level.
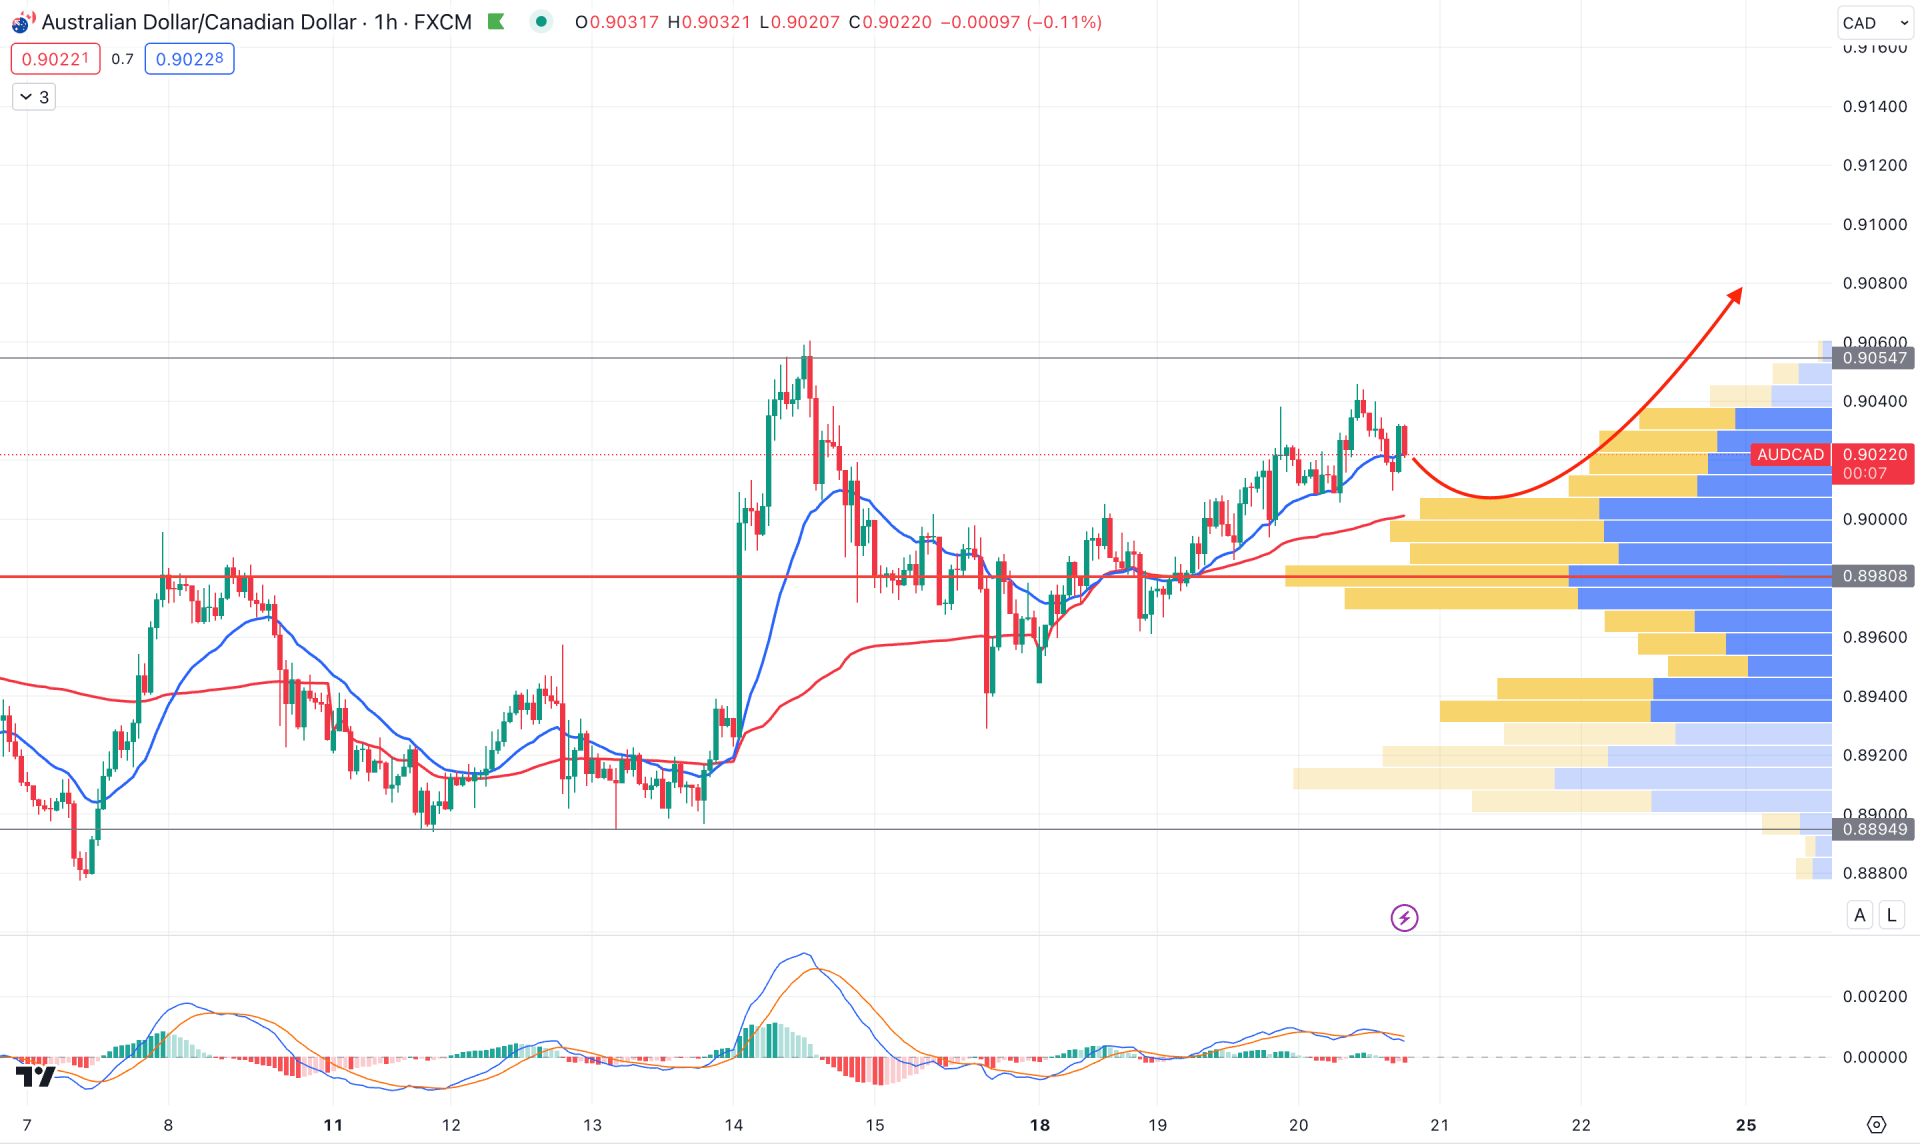
In the H1 chart, the current market momentum is bullish as the visible range high volume level is below the current price, working as a support. Moreover, the dynamic 20-day EMA and VWAP are working as a support with a bullish slope.
The secondary window suggests a corrective price action as the MACD Histogram hovers at the neutral line.
In that case, investors might expect a bearish correction, from which a bullish rejection from the VWAP support could be a long opportunity. However, a bearish H1 candle below the 0.8980 support level could lower the price towards the 0.8894 level.
Based on the current multi-timeframe analysis, bulls might find a strong, long opportunity in this AUDCAD price after forming a valid bullish breakout above the 0.9057 weekly resistance. Moreover, a valid buying pressure from the intraday chart could provide an early buying opportunity in this pair.


