
Published: November 13th, 2020
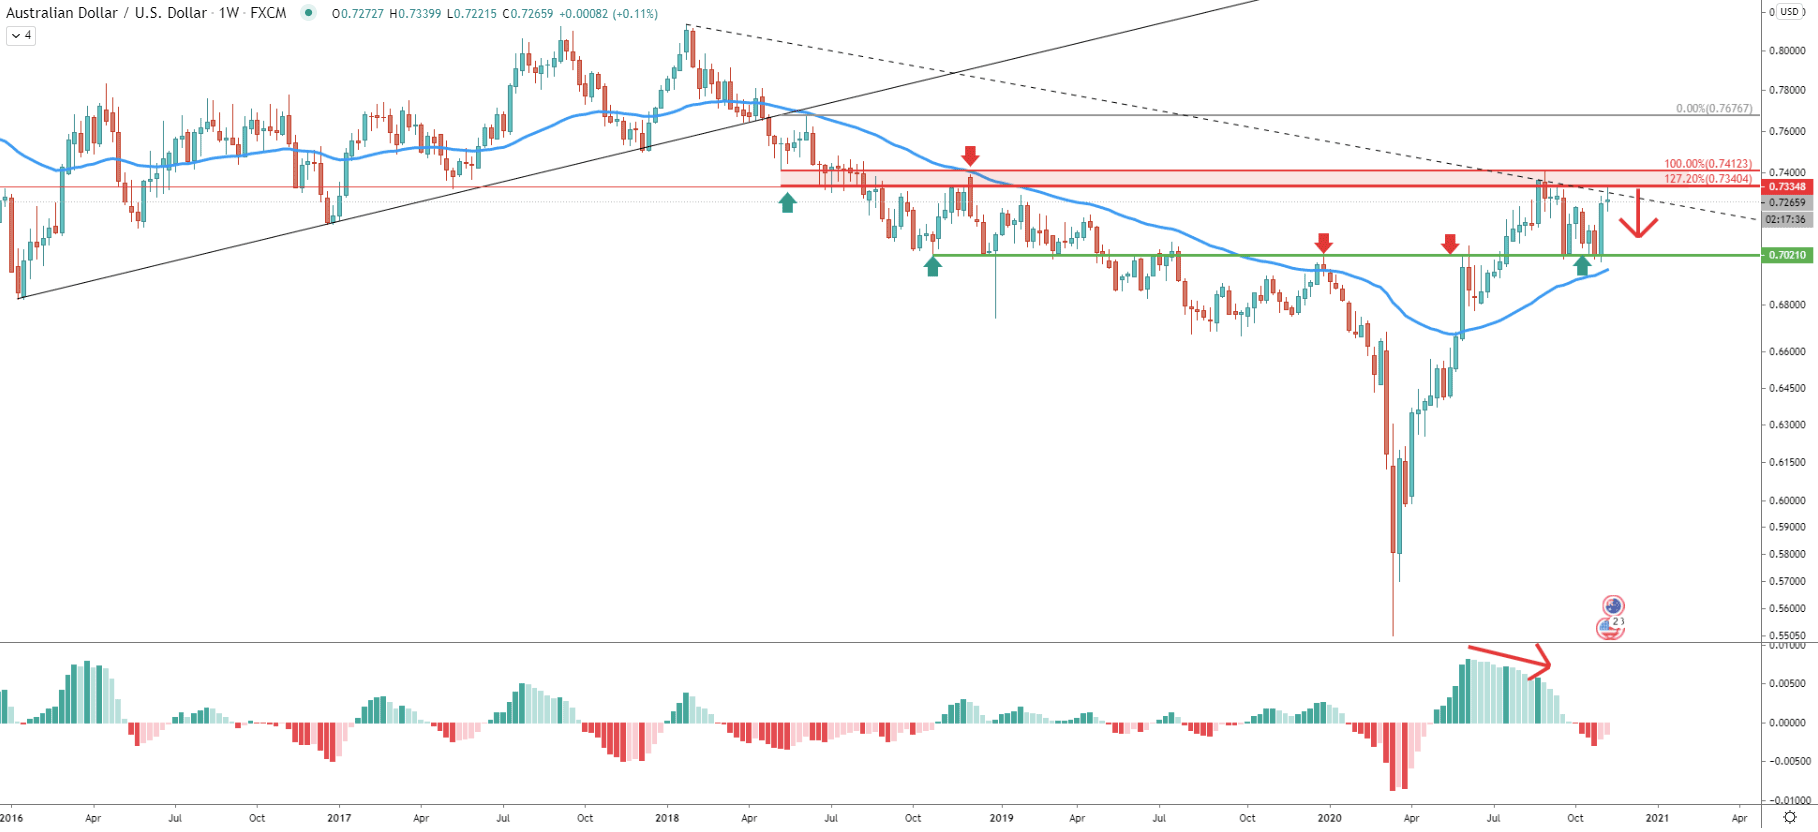
The overall trend of the AUD/USD remains bearish on the weekly chart. In July, the price has tested 0.7412 high, where MACD formed a bearish divergence. This could be the signal that the long-term bearish trend is still valid and the price could be heading down, potentially to test 50 Exponential Moving Average as the nearest support. The EMA support area corresponds to the supply/demand zone formed during the past 3 years, which is located at 0.7020.
This week, AUD/USD cleanly rejected 0.7334, which is 127.2% Fibs applied to the corrective move up after the pair broke below the 50 EMA as well as the uptrend trendline. At the same time, the downtrend trendline has been rejected, potentially suggesting bearish dominance. Therefore, as long as the price remains below the 0.7334 resistance level, AUD/USD should be expected to decline by as much as 300 pips.
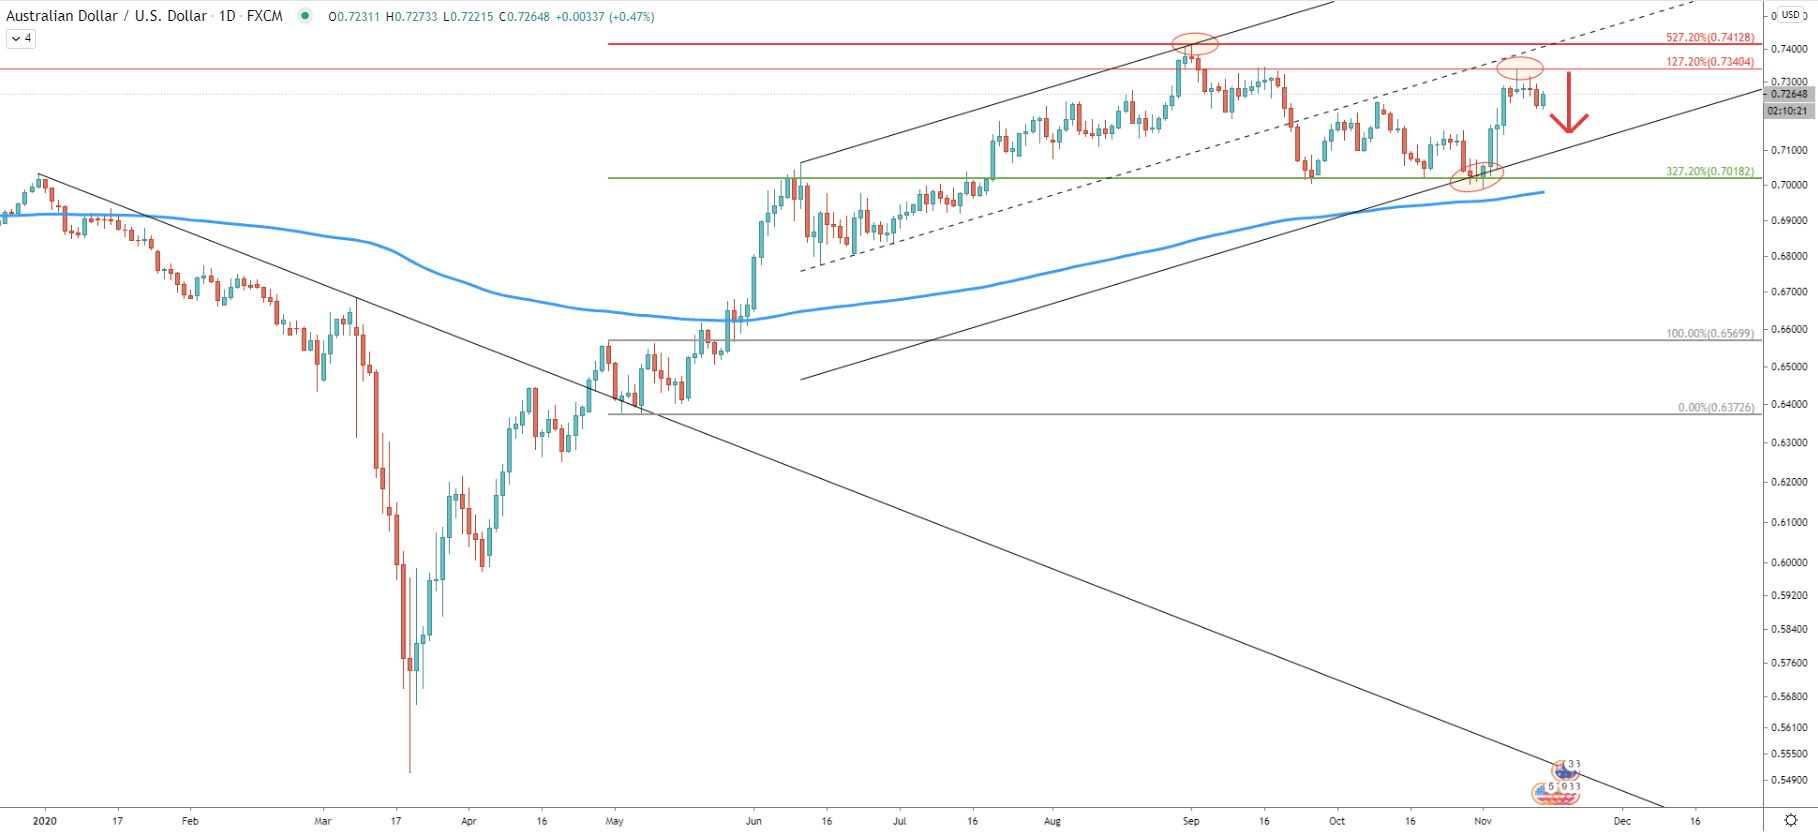
On the daily timeframe, AUD/USD has certainly rejected the 527.2% Fibonacci retracement level at 0.7412. After that price went down sharply and broke below the ascending channel, reaching 327.2% Fibonacci support at 0.7018. However, the price didn’t touch the 200 EMA, which is likely to act as the support in the medium to long term.
It seems like the price is now stuck between the 0.7412 resistance and 0.7018 support area. Considering the recent clean rejection of the 0.7340 resistance, the probability remains in favor of the downside move, where AUD/USD could be aiming for the 200 EMA. But at the same time, there is one other support level to watch, and we’ll observe it in the following charts.
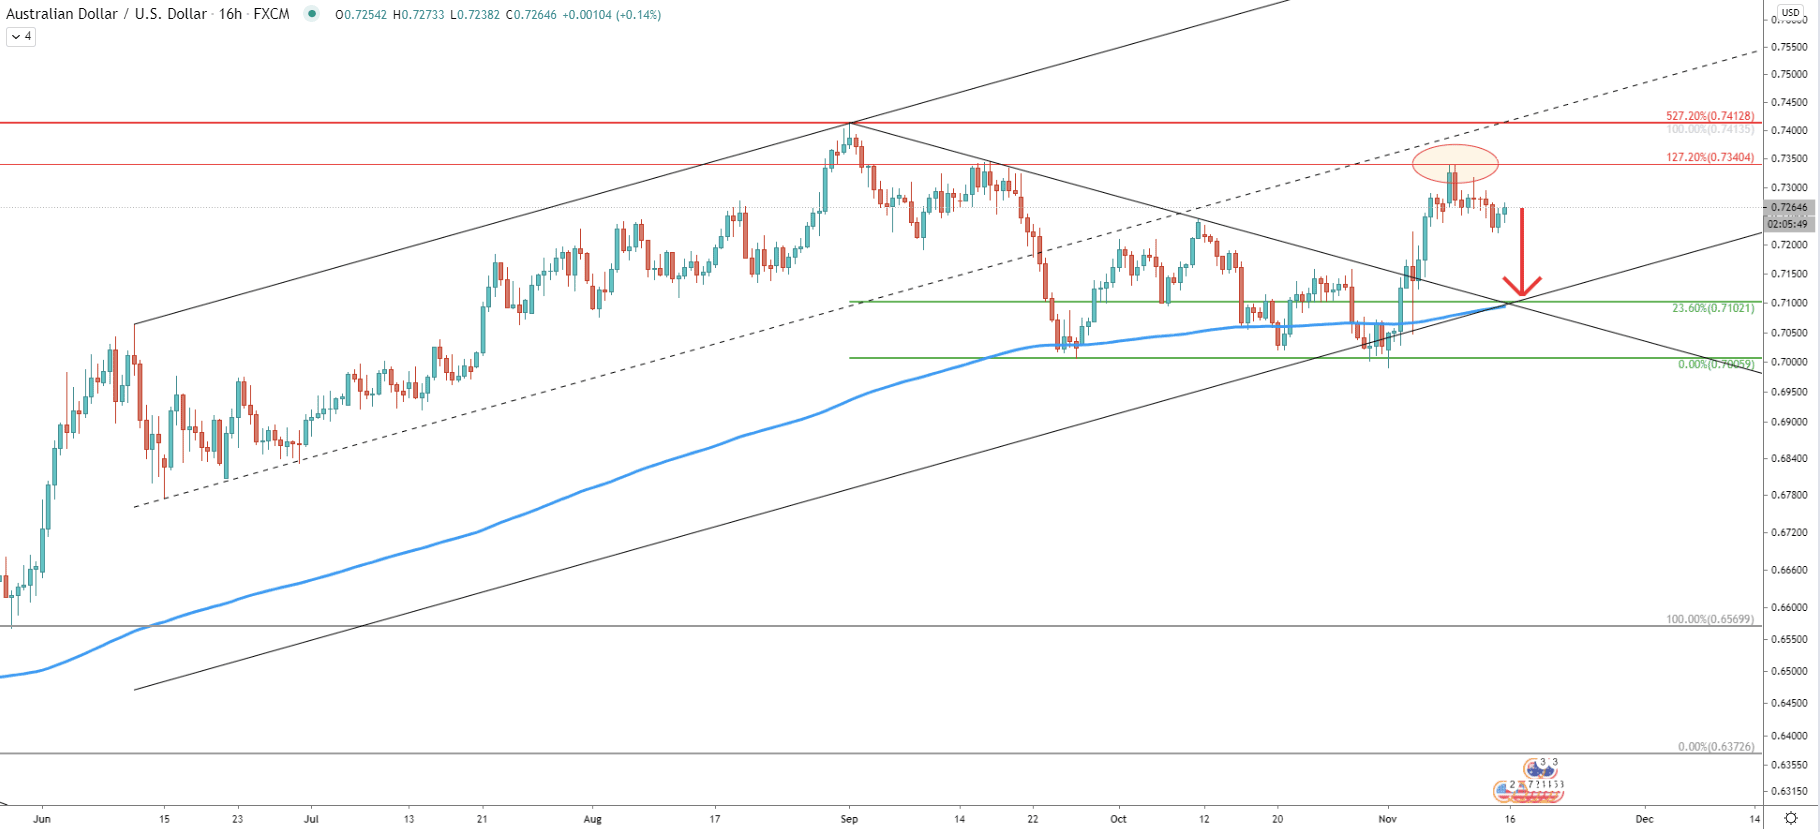
On the 16-hour chart, the nearest support is located right at 0.7100, which is a technical as well as the psychological support level. This support is confirmed by 23.6% Fibs applied to the September - October corrective move down. It is also confirmed by the 200 EMA as well as the downtrend trendline, which might and should act as the support if/when reached. This makes the nearest strong support over 250 pips away from the current price. Nonetheless, prior to the downside move, the price might consolidate at the beginning of the next week. In this case, the downtrend is likely to start by the mid next week and might list for two or more weeks.
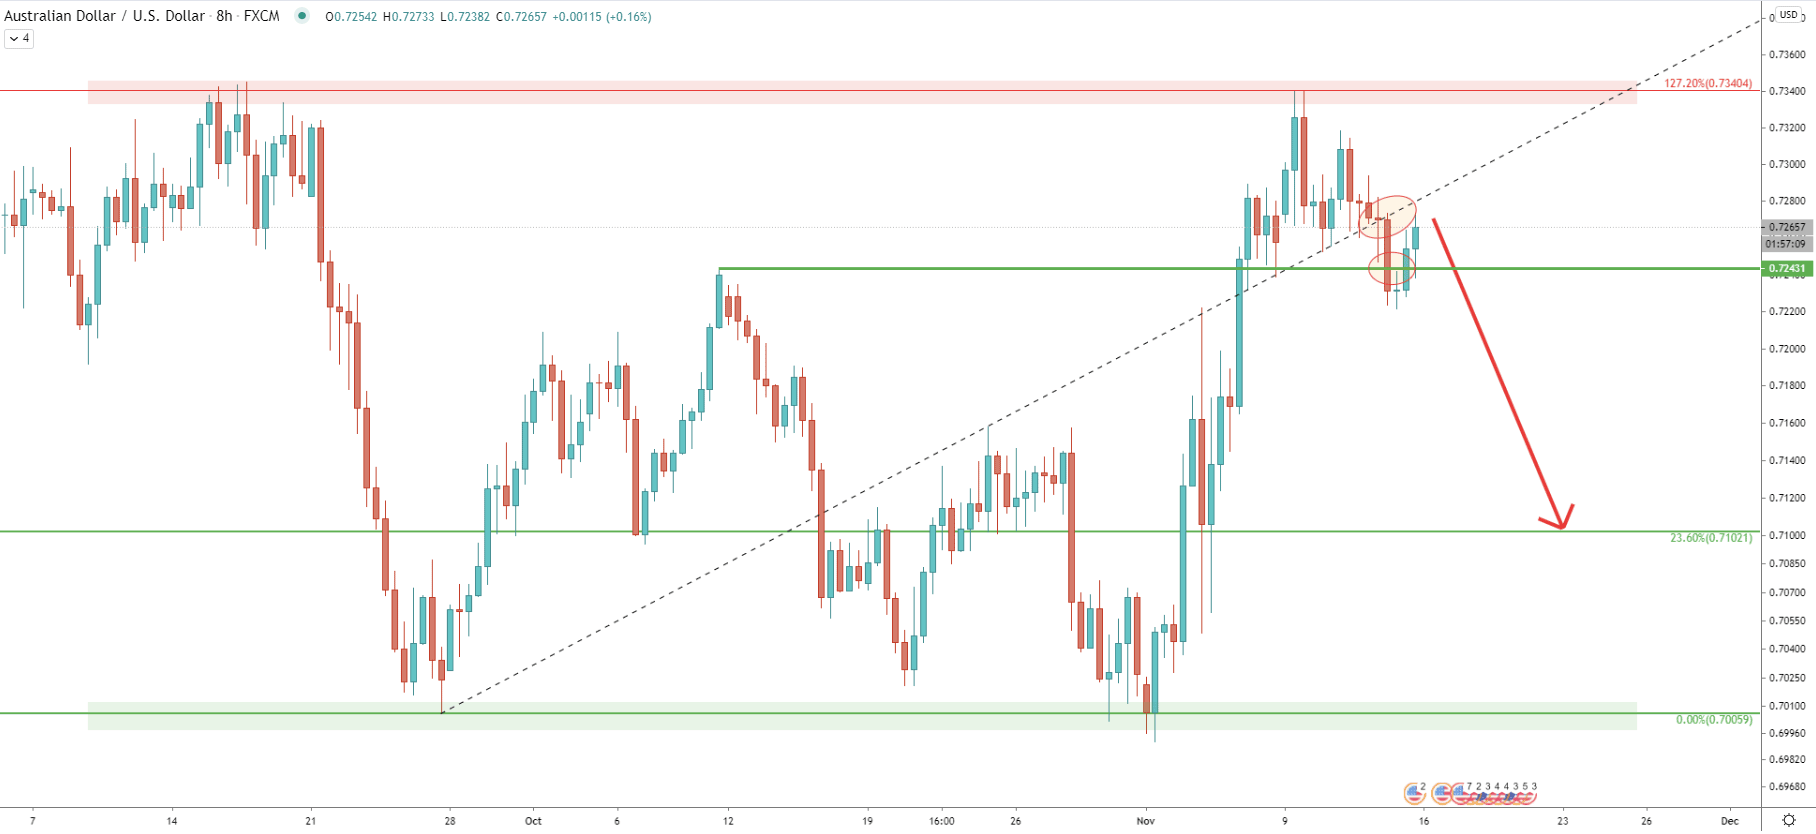
On the 8-hour chart, the average-price uptrend trendline has been penetrated. Also, the previously formed resistance at 0.7243 was also broken. This yet again validates the potential downside move scenario. Perhaps next week AUD/USD will be re-testing the average-price uptrend timeline and price might get choppy. Although as long as it remains below the 0.7340 resistance, sellers will continue to dominate.
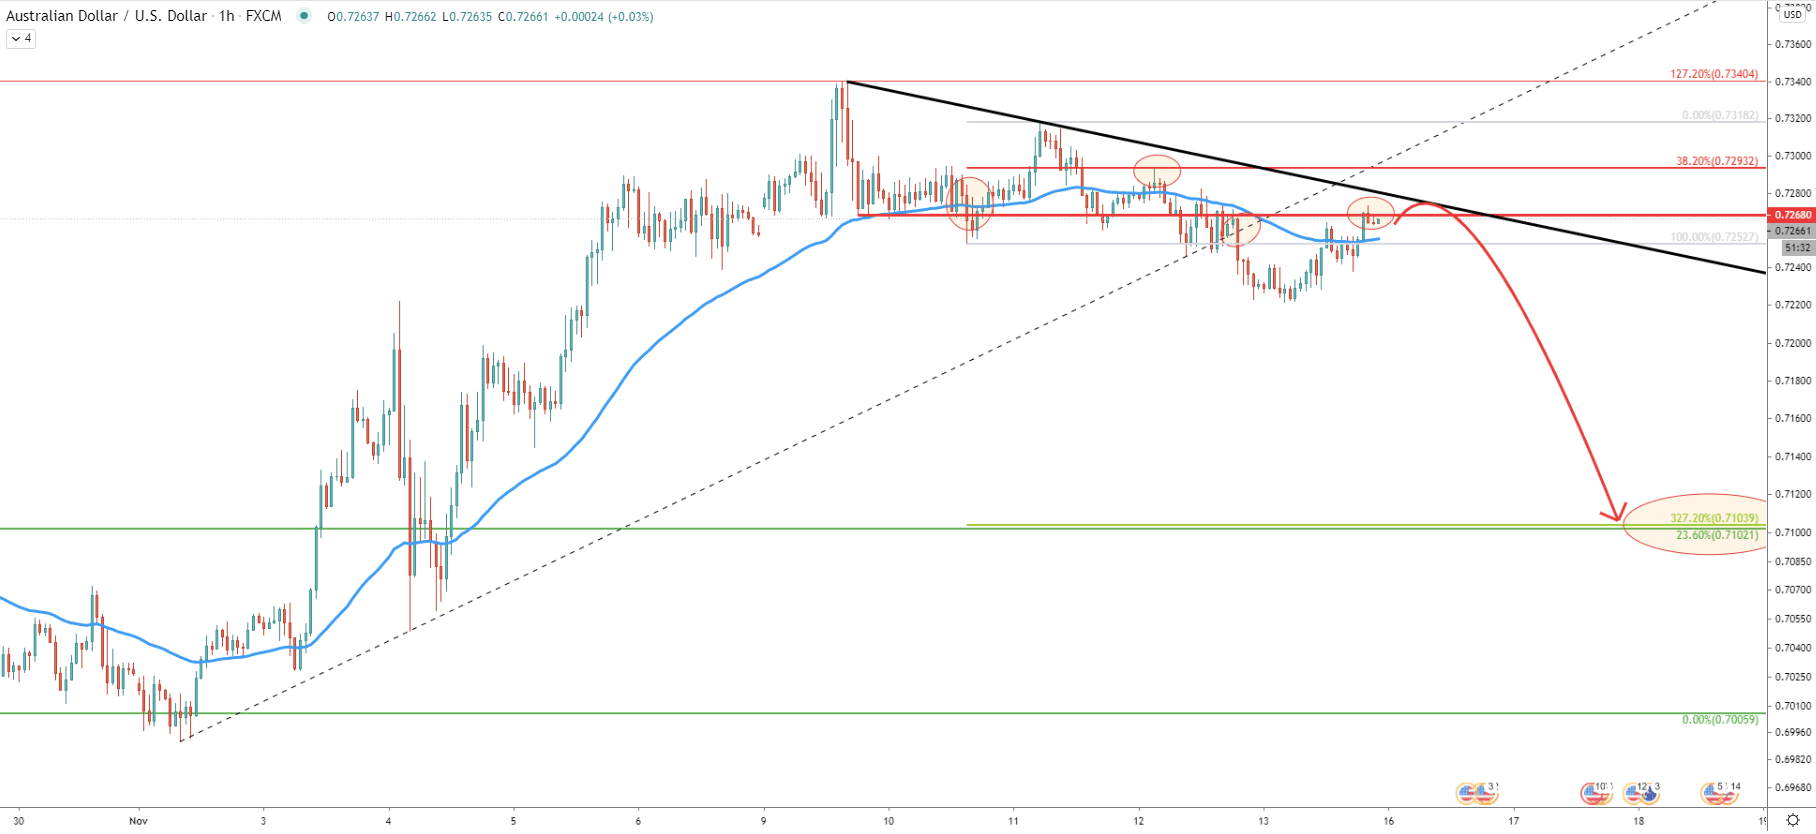
Finally, the hourly chart shows, that AUD/USD remains below the simple downtrend trendline and currently trading near the 0.7268 resistance area. It is highly likely that the downtrend trendline will be tested and spikes above can also be expected. As can be seen, the previously established resistance, confirmed by 38.2% Fibonacci retracement level, is located at 0.7293. Perhaps next week AUD/USD might be attempting to break above, potentially aiming for a 0.7300 psychological level. It is highly probable that this could be a strong supply zone, from which AUD/USD will start moving south.
Fibonacci applied to the corrective wave up after price broke below the 0.7268 support and the 50 EMA, shows that 327.2% Fibs almost exactly corresponds to the previously discussed downside target at 0.7100 psychological level. Therefore, if sellers to enter short positions near 0.7300, it would make it a 200 pips potential decline, which is expected to last for around two weeks.
AUD/USD started to show signs of weakness while rejecting several resistance levels and breaking below the uptrend trendline along with the ascending channel. The key supply zone could be located near the 0.7300 psychological level, which is confirmed by 38.2% Fibs as per the hourly chart. Perhaps if this level is tested, selling pressure will increase even further.
On the downside potential, the key demand zone could be located at a 0.7100 psychological level, which is confirmed by two Fibonacci retracement levels as per the 16-hour and 1-hour charts. This might present a selling opportunity for a 200 pip move.
As long as the price remains below the 0.7340 resistance, AUD/USD trend will remain strongly bearish. But break above will immediately invalidate the bearish outlook and the long-term trend might turn from bearish to bullish.
Support: 0.7100, 0.7018
Resistance: 0.7268, 0.7300, 0.7340


