
Published: December 10th, 2020
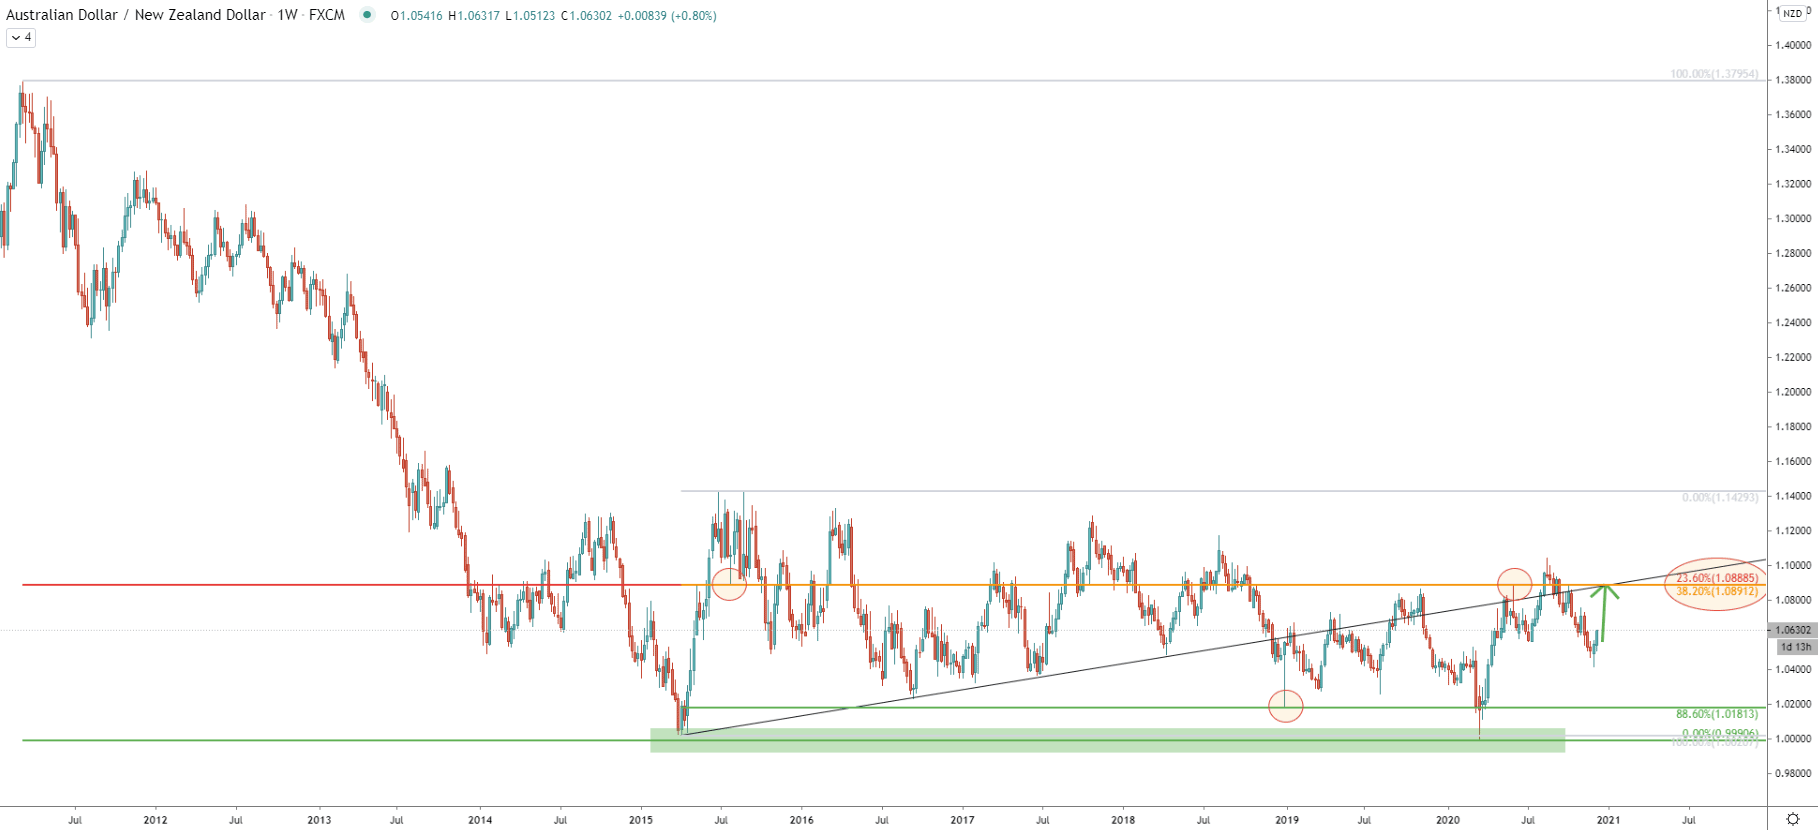
On the weekly chart, a very wide consolidation phase can be spotted. Since 2015 price has been trapped between 0.9990 support and 1.1430 resistance. This means that there is no clear direction in the long run. However, considering that the range trading is ongoing, and recently price went down quite a bit, it would be reasonable to assume that AUD/NZD will return to some sort of the mean price. This could be the 1.0890 resistance area, which is confirmed by 38.2% and 23.6% Fibonacci retracement levels as can be seen on the chart.
This resistance corresponds to the average-price uptrend trendline, implying that AUD/NZD might test this resistance area in just one or two weeks from today. Lets’ move to lower timeframes to see more details on the current price action.
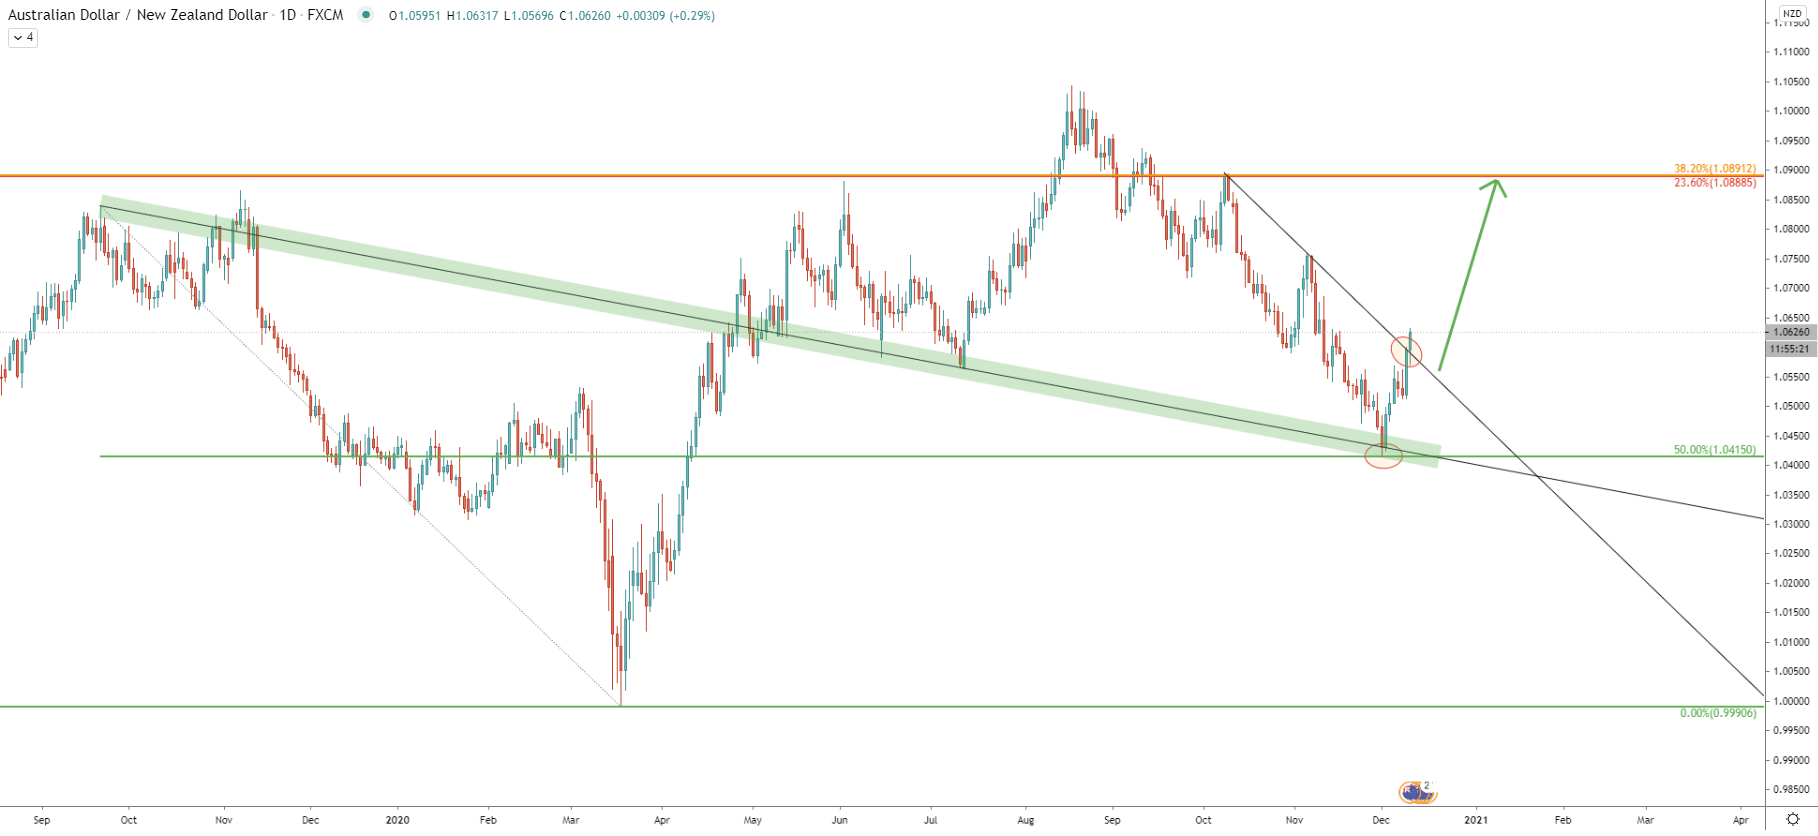
Eight trading days ago, AUD/NZD has cleanly rejected the 50% Fibonacci retracement level at 1.0415, which was applied to the last strong downside move that occurred between October 2020 and March 2021. At the same time, the average price or the support downtrend trendline also was rejected, suggesting that this could have been the bottom.
Today AUD/NZD is beaking above the simple downtrend trendline which could be the confirmation of the bullish trend. Nonetheless, it is yet to be seen whether daily close will be above the trendline. If that will be the case, buyers are likely to take control of the AUD/NZD price in the medium term.
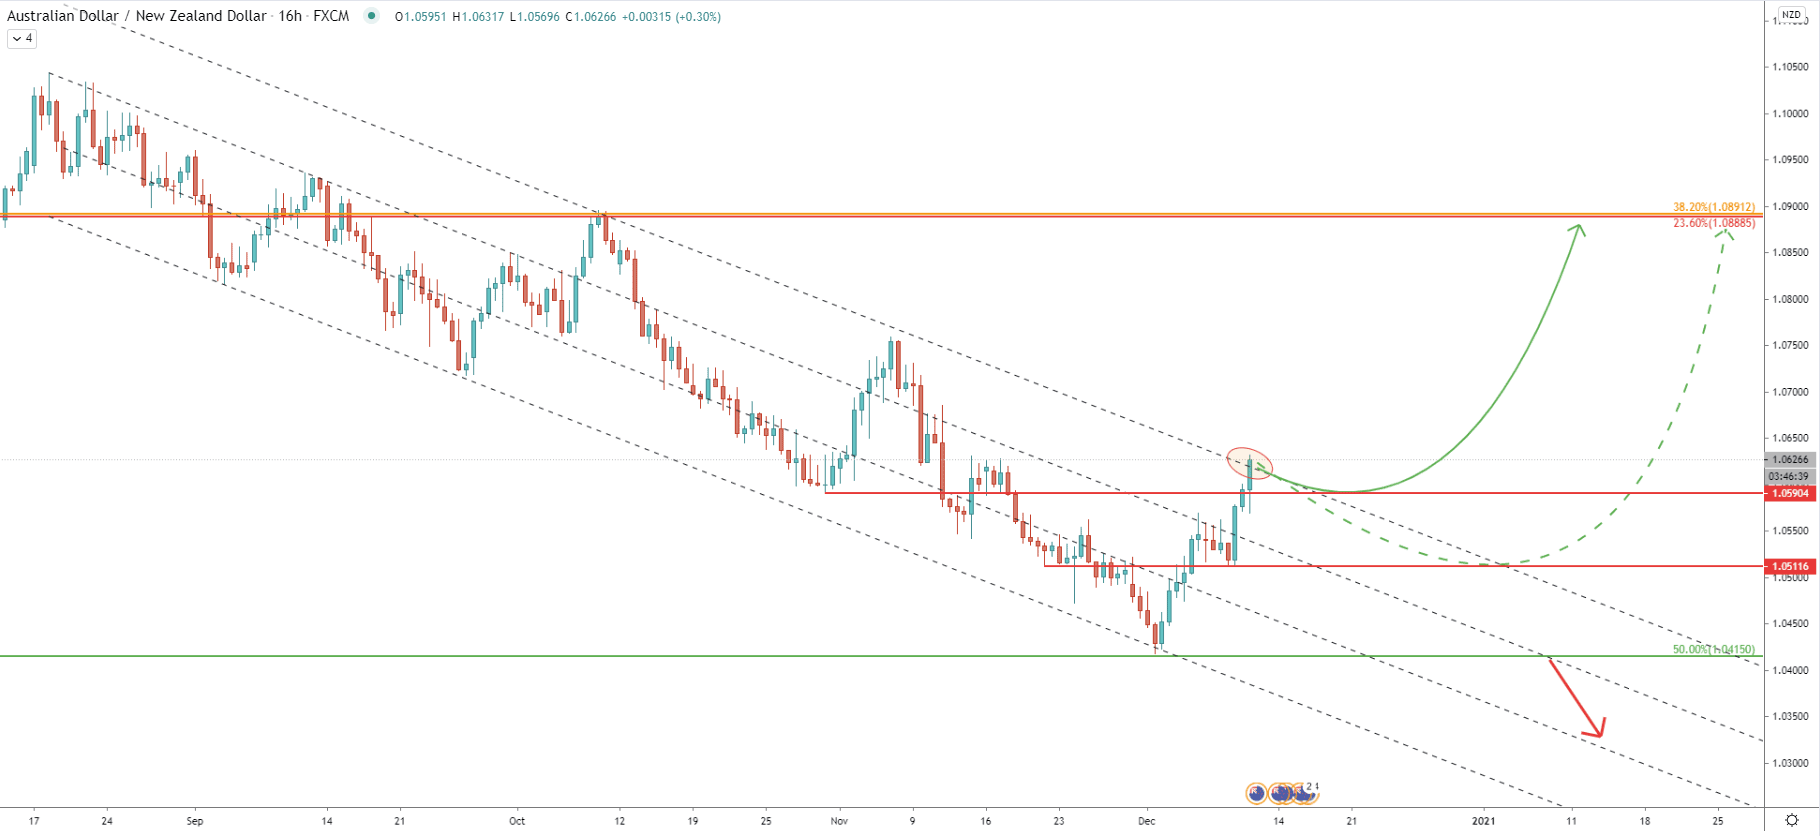
On the 16-hour chart, AUD/NZD has been trading within the descending channel since the end of September. But today, as can be seen on the chart, the price is attempting to break above the channel. If AUD/NZD will succeed and will manage to have a daily closing price above the upper trendline of the descending channel, yet another bullish confirmation will be presenting. However, this does not mean that there won’t be any pullback, in fact, it would be very reasonable for the price to correct down. It might bring AUD/NZD to one of the support levels formed previously. The nearest one is at 1.0590 and then goes the 1.0511. Perhaps the price will aim for the 1.0500 psychological area, before/if the uptrend will continue.
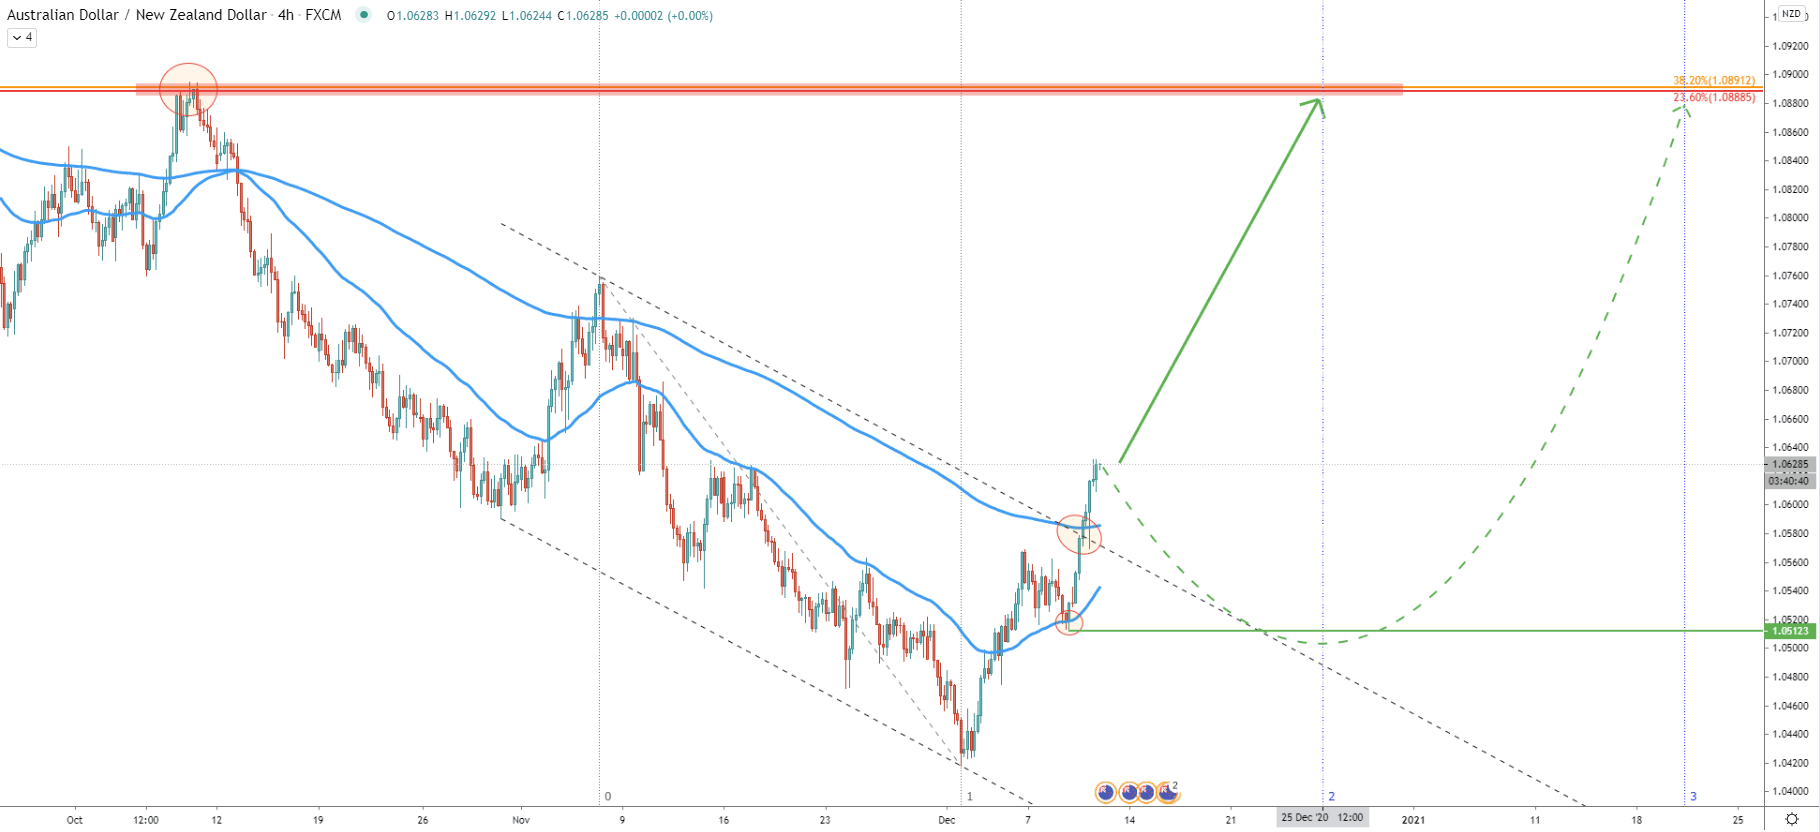
On the 4-hour chart, AUD/NZD also breaking above the channel, but this time it different channel to the one presented on the 16-hour chart. The difference is that this channel has been broken already, confirming bullish strength. But most likely buyers are waiting for confirmation on higher timeframes and then for a strong pullback in order to get the best risk/reward ratio. Therefore, the buying opportunity could be presented sometime next week, when AUD/NZD will correct down.
The correction is likely to send the price down to the 1.0500 support area and based on the Fibonacci cycles, the uptrend might begin on December 25, which is in two weeks from now. On the other hand, the uptrend might be ending on December 25, which suggests a fast correction down, and then a fast move to the upside. Soon we’ll find out which one, if any, of these scenarios will play
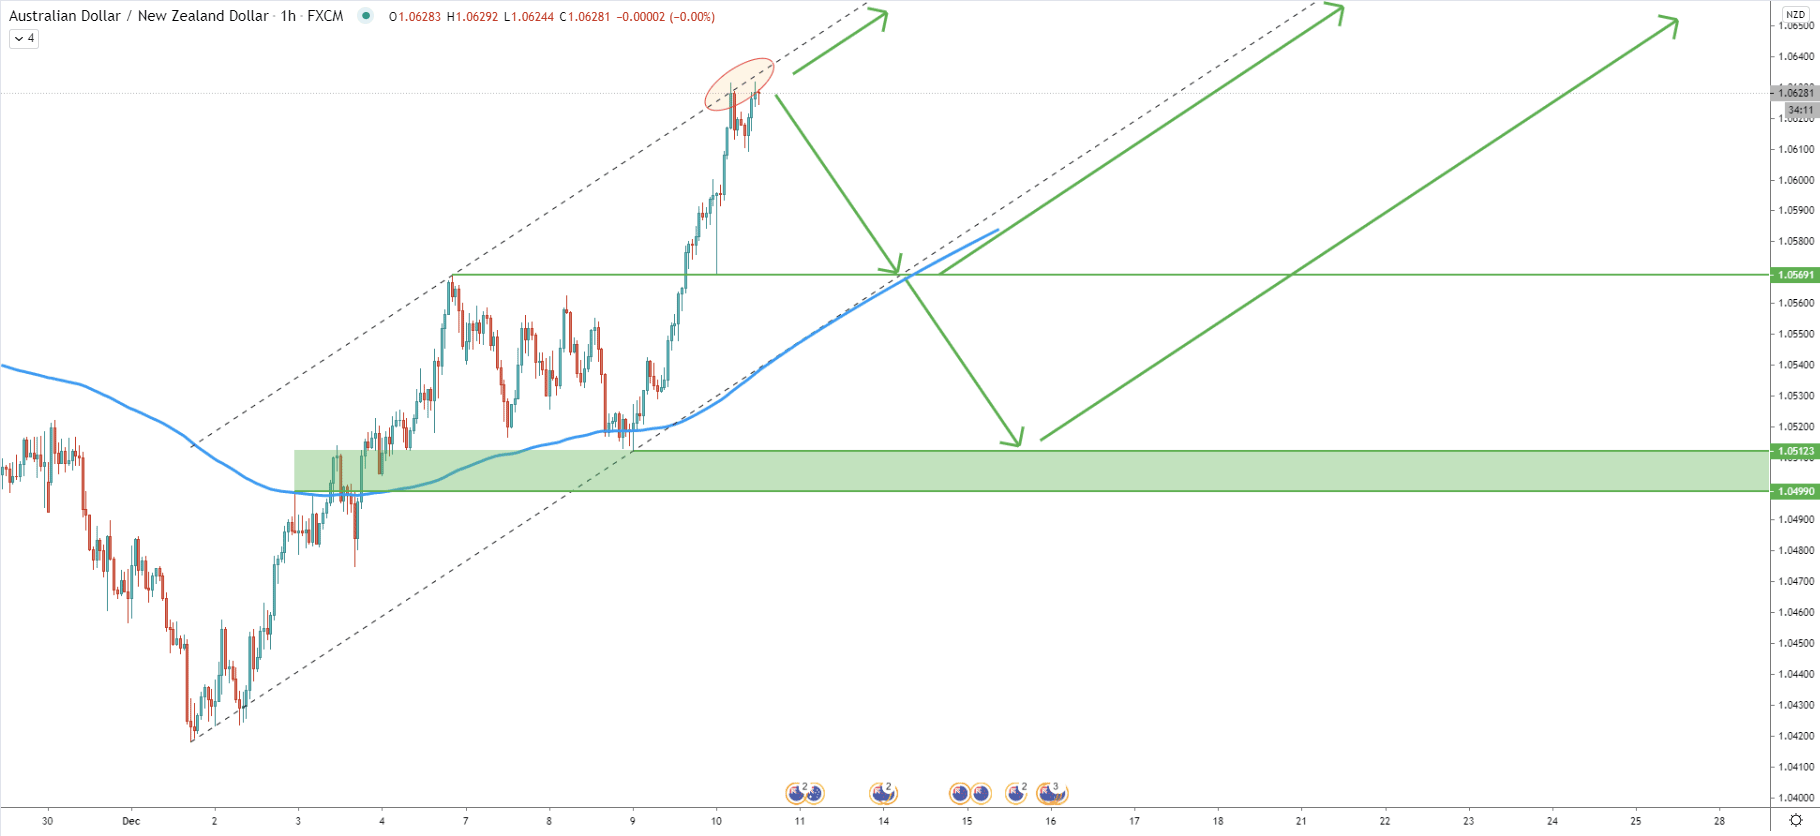
While the correction down would be reasonable, it is also confirmed technically. This is because today AUD/NZD is rejecting the top of the ascending channel, which is providing some resistance near 1.0630. Now there are several scenarios of further price development. One is that AUD/NZD will continue rising non-stop, but for this, it must break above the top of the channel with a daily break and close above. Another scenario is that the channel will continue to be rejected and AUD/NZD will correct either towards the 1.0570 support, confirmed by the uptrend trendline and 200 EMA, or the 1.0500 - 1.0512 support area., before/if the uptrend will continue.
AUD/NZD is confirming a potential trend reversal, although currently, it is facing a minor resistance. What is expected from this pair is a correctional move down, towards the 1.0500 psychological support. At that stage, buyers are likely to step in, resulting in the uptrend continuation.
As per the weekly chart, there is only one key resistance area. It is located near 1.0890 and confirmed by two Fibonacci retracement levels as well as the average-price uptrend trendline.
As per the 16-hour chat, only break and close below the 1.0415 low, produced on December 1, will invalidate the bullish outlook for the AUD/NZD. And only then sellers might get in once again, implying the downtrend continuation.
Support: 1.0590, 1.0515, 1.0500, 1.0415
Resistance: 1.0630, .0890


