
Published: March 31st, 2020
In this analysis, we will go through the AUD/JPY price action on 4 timeframes. It seems like the trend is changing, so let’s find how high is the probability and how far it may rise.
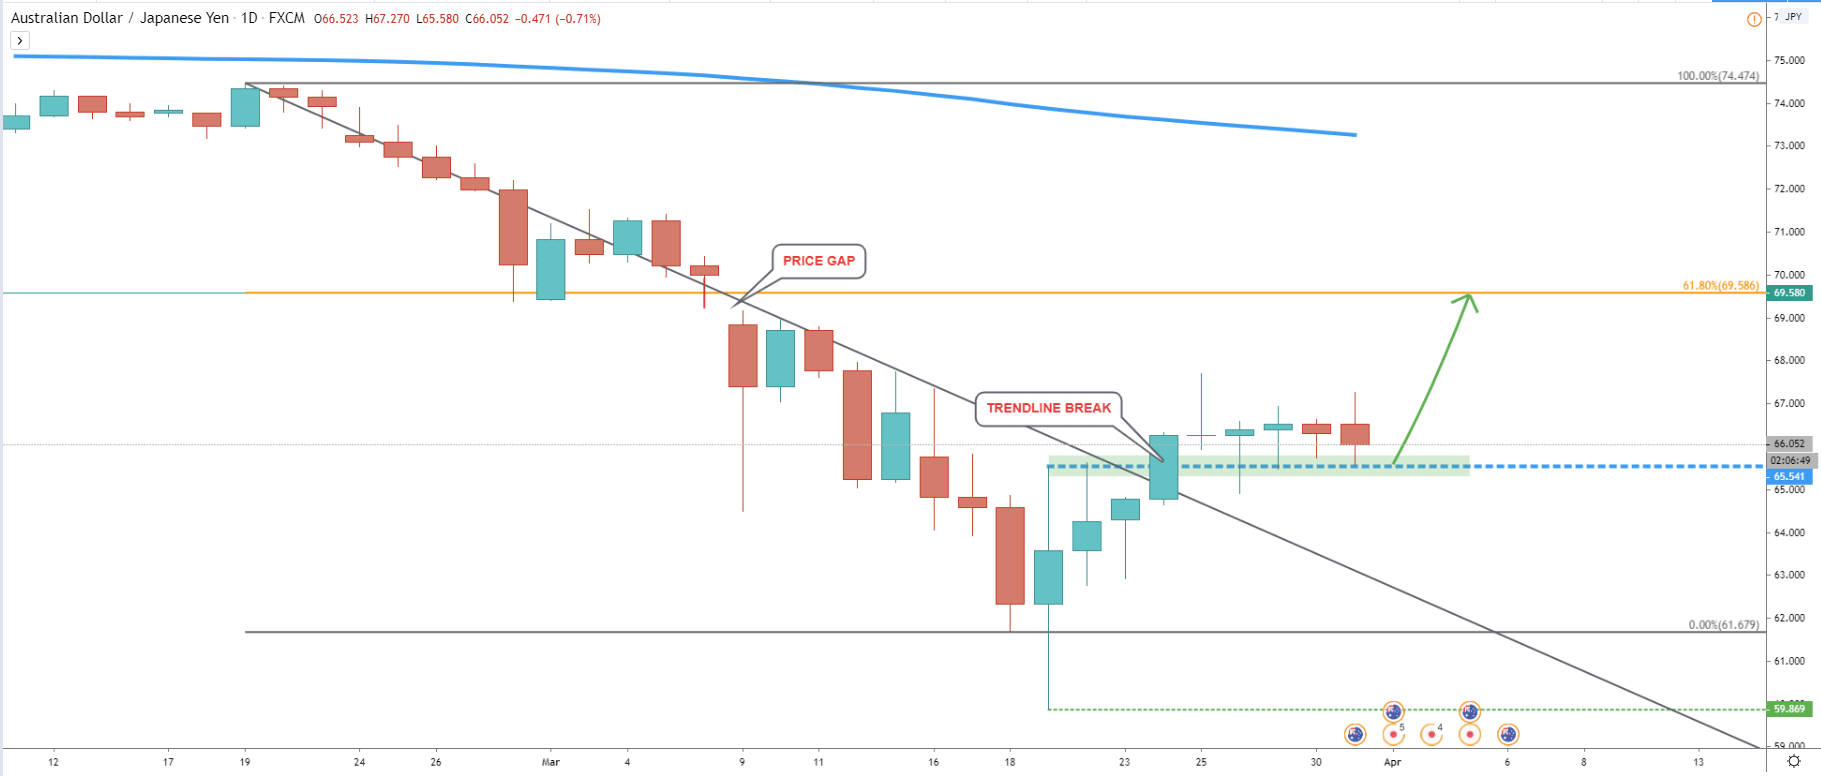
Daily chart clearly shows that there was a price gap, occurred between the 6th and 9th of March. On Friday, March 6, daily low was formed at 69.58, but on Monday AUD/JPY opened at 68.83 and produce the high at 69.05. This makes it a 53 price gap, with remains open up until now. History shows, that such gaps are being filled at some point in time, and soon, we might see AUD/JPY attempt to do that. In order to fill the gap, the price must go up at least to 69.58, which is 350 pips from the current level.
On the chart, we can see the Fibonacci retracement level applied to the trend down, which was ongoing from February 19 to March 18. It shows that 61.8% Fibonacci retracement level is right at 69.58, the price required to fill the gap.
We can also see the breakout of the downtrend trendline and the support being formed at 65.54, which previously acted as the resistance.
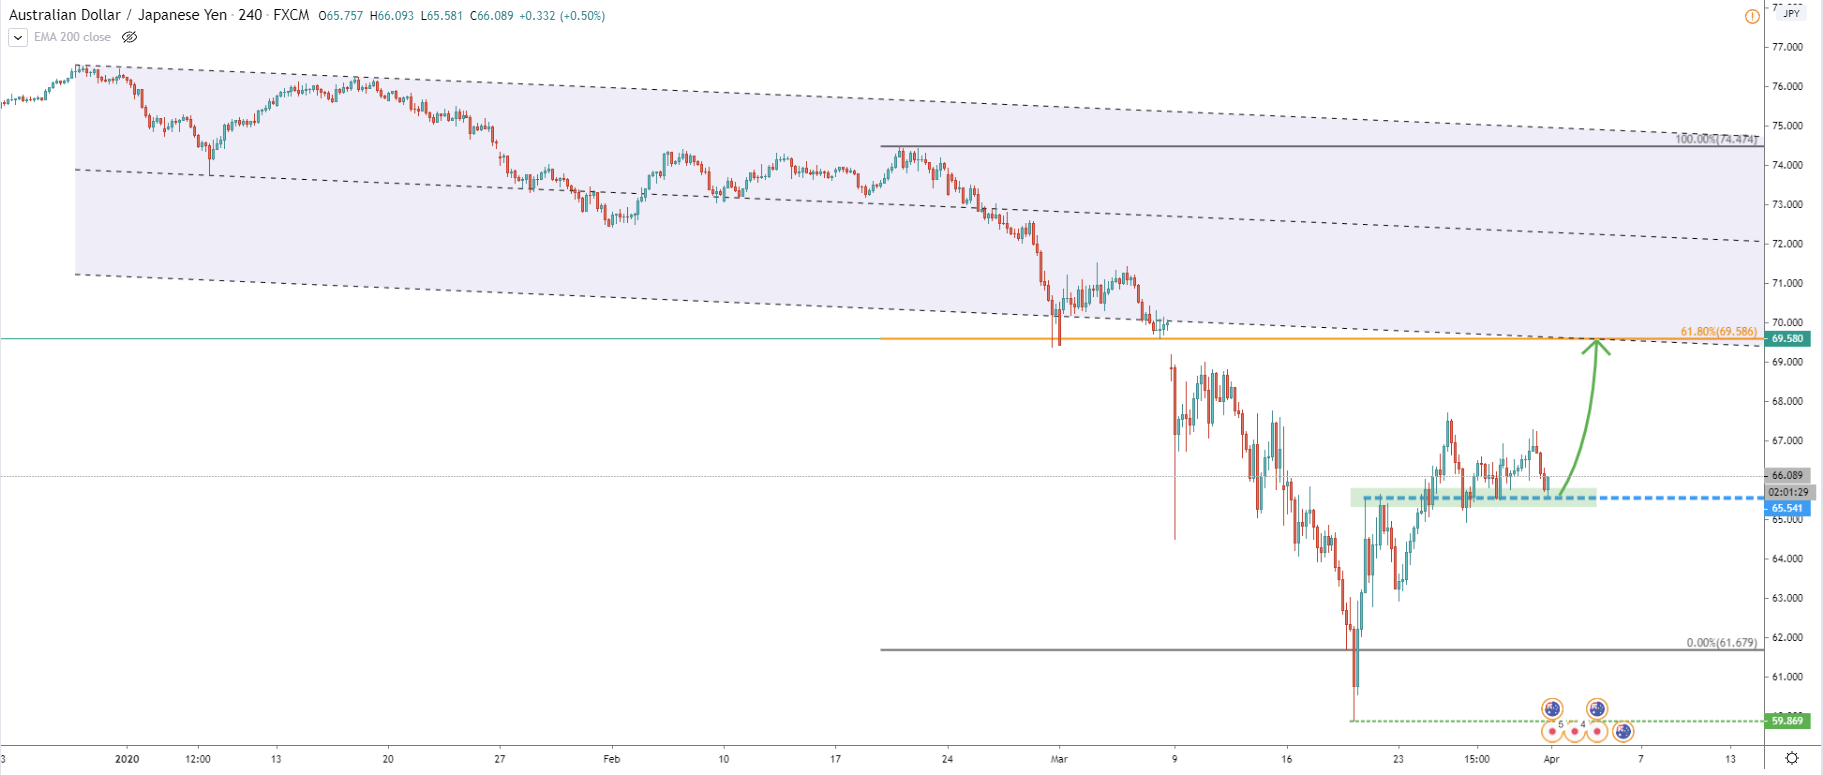
The resistance at 65.54 has been rejected on two consecutive occasions, which leads to conclusion that is in fact a strong demand area for AUD/JPY. Price is producing higher highs and higher lows, which should push the price up towards 61.8% in the coming days or a few weeks. The upside target corresponds to the lower trendline of the extended descending channel and suggests that it will be a fast trend, meaning it won’t’ take long for the target to be reached and cap to be filled.
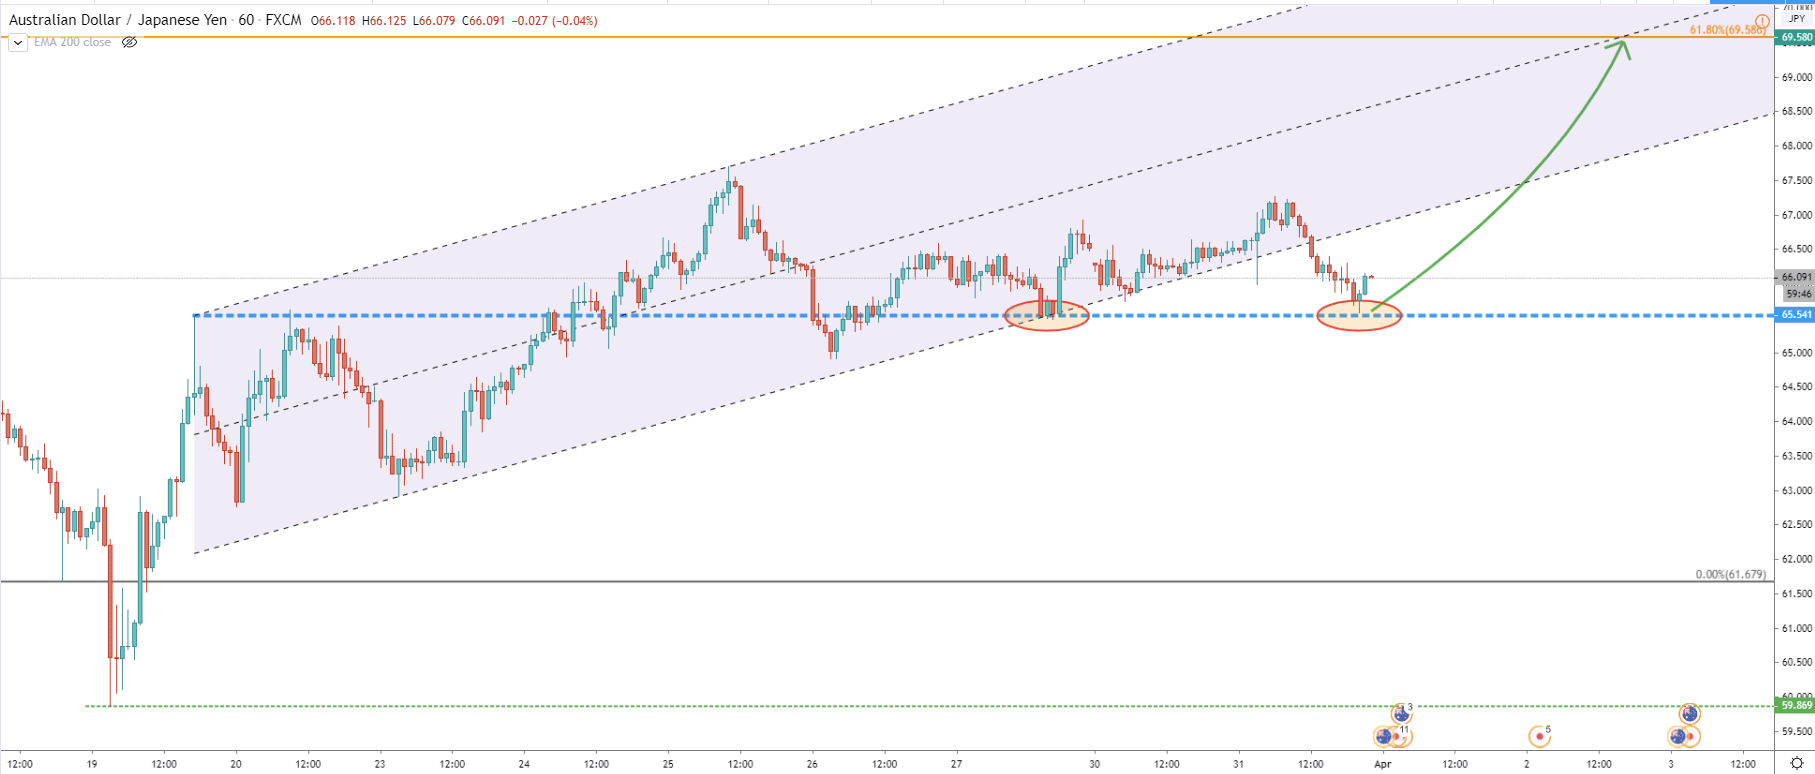
Here comes the 1H chart, where AUD/JPY showed great respect to the 65.54 support level. This is actually the price where AUD/JPY bounced off the ascending channel, and today it was rejected yet again. Overall, there is very strong support at this price and as long as it holds we can expect the price to move higher.
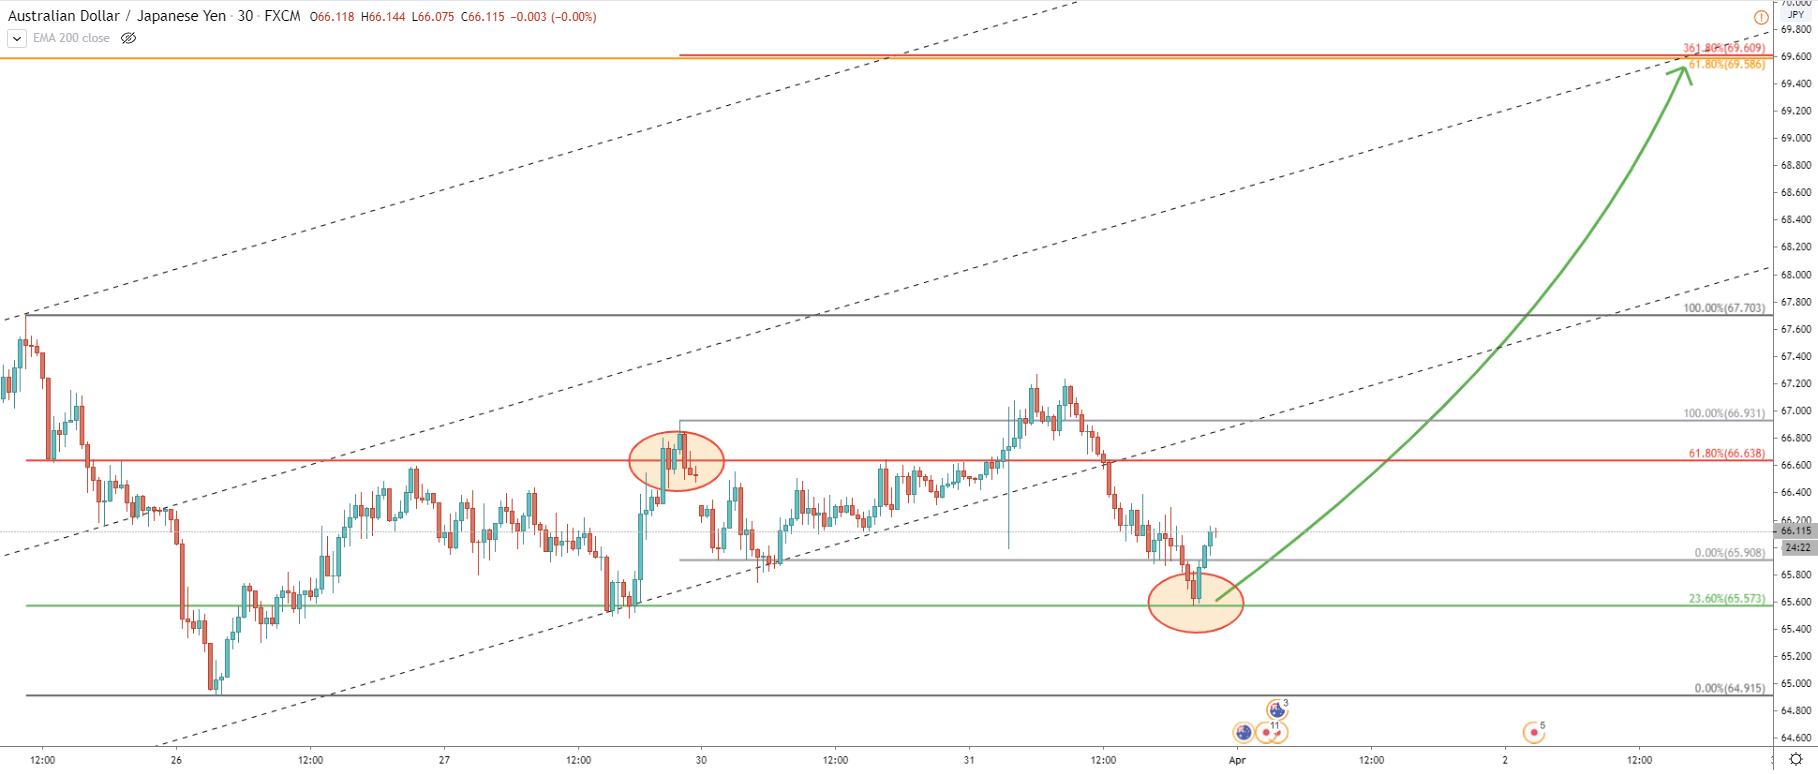
Finally comes the 30M chart, where move Fibonacci indicators were applied. On the Fibs applied to the 25-26 March corrective wave down, we can see that 61.8% key resistance was broken, and today, 23.6% of Fibonacci support was rejected cleanly. Another Fibonacci was applied to the corrective wave down after the 61.8% level breakout. It shows that a 361.8% retracement level at 69.60 corresponds to the upside on the daily chart.
Based on the above analysis, 62.57 level plays key support while 69.58 plays a key resistance level. While the support is holding, AUD/JPY is expected to move up in order to fill the price gap. This should take less than a week, and based on the 30M chart it might take only 3 days.
As per the daily as well as 30M chart, the upside target is seen at 59.58, which is confirmed by two Fibonacci retracement levels. At the same time, if AUD/JPY will reach this price, it would close the price gap, which statistically peaking, is highly probable.
As 65.57 plays a key support role, it should be monitored closely for a break below. If daily candle will manage to close lower, bullish outlook will be invalidated and the price might move towards 65.00 area, which is the next closest support zone.
Support: 65.57, 64.91
Resistance: 67.70, 69.58


