
Published: June 18th, 2020
We have made multiple analyses on various Australian Dollar currency pairs. They all have one thing in common, and this is the expected strength of the AUD in relation to most fiat currencies. This time we will dive very deep into AUD/JPY analysis and will go through 5 different timeframes, to understand whether the uptrend should be expected or perhaps price will continue trending down.
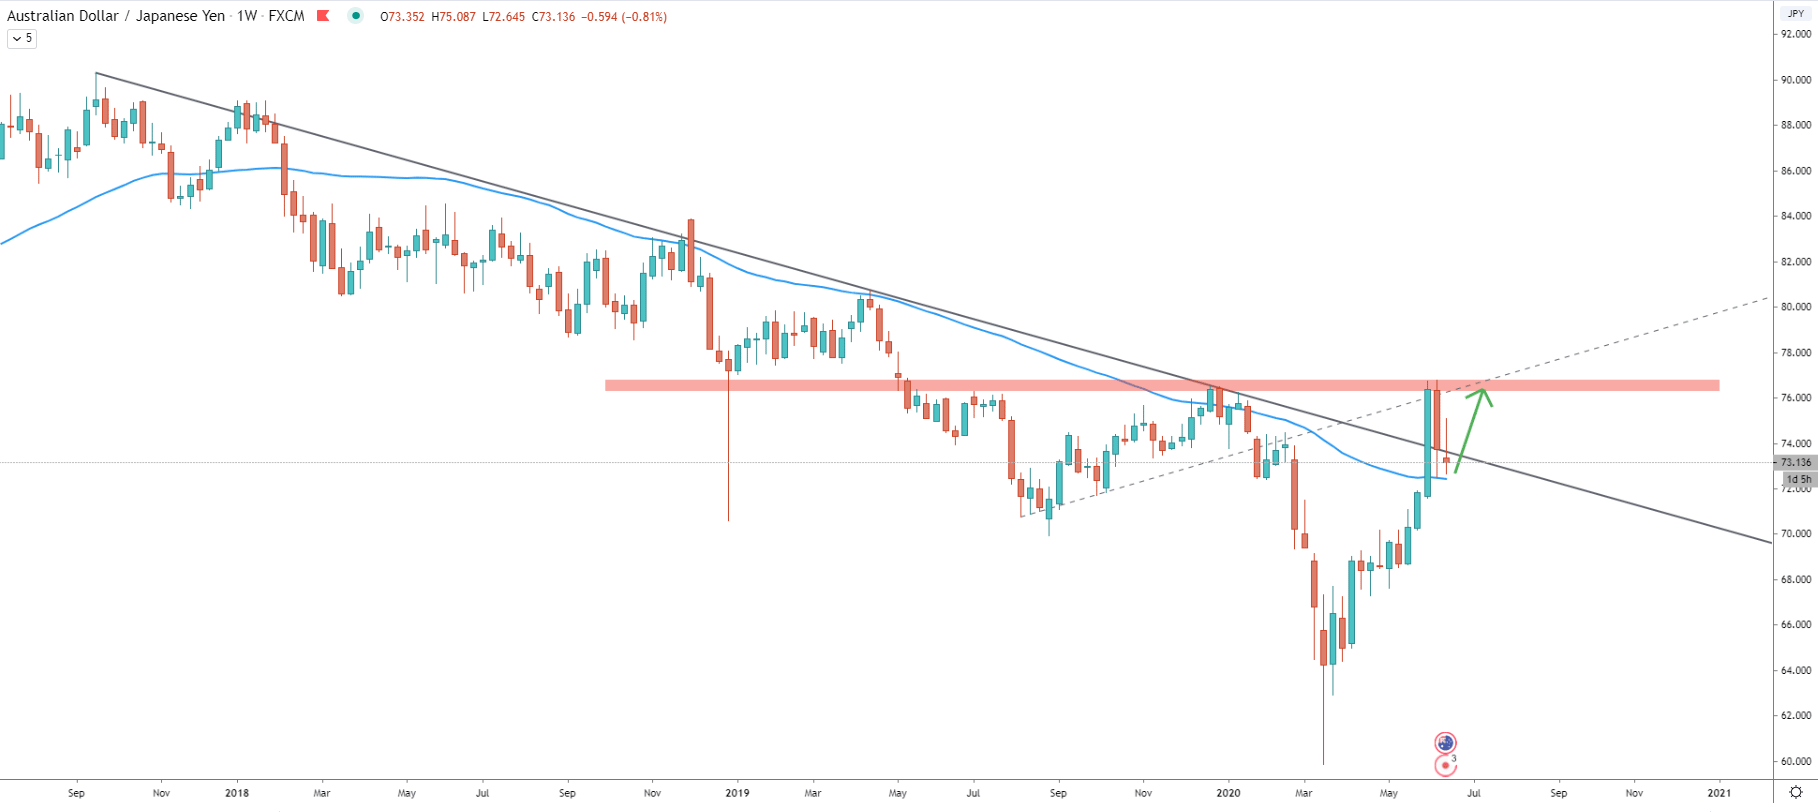
On the weekly chart, we can observe a long term downtrend, which has lasted for nearly 3 years. To be precise, this was a 32-months downtrend and it could have come to an end. This is because of the Weekly break and close above the downtrend trendline as well as 200 Exponential Moving Average.
But at the same time, it might be too early to get so positive on the AUD/JPY price perspective, because the major resistance area near 76.00 has been rejected. However, after the rejection price corrected down and cleanly bounced off the 200 EMA, suggesting further growth potential. It could mean that as long as the price remains above the EMA, AUD/JPY can be expected to move up, at least to produced a double top near the 76.00 resistance area.
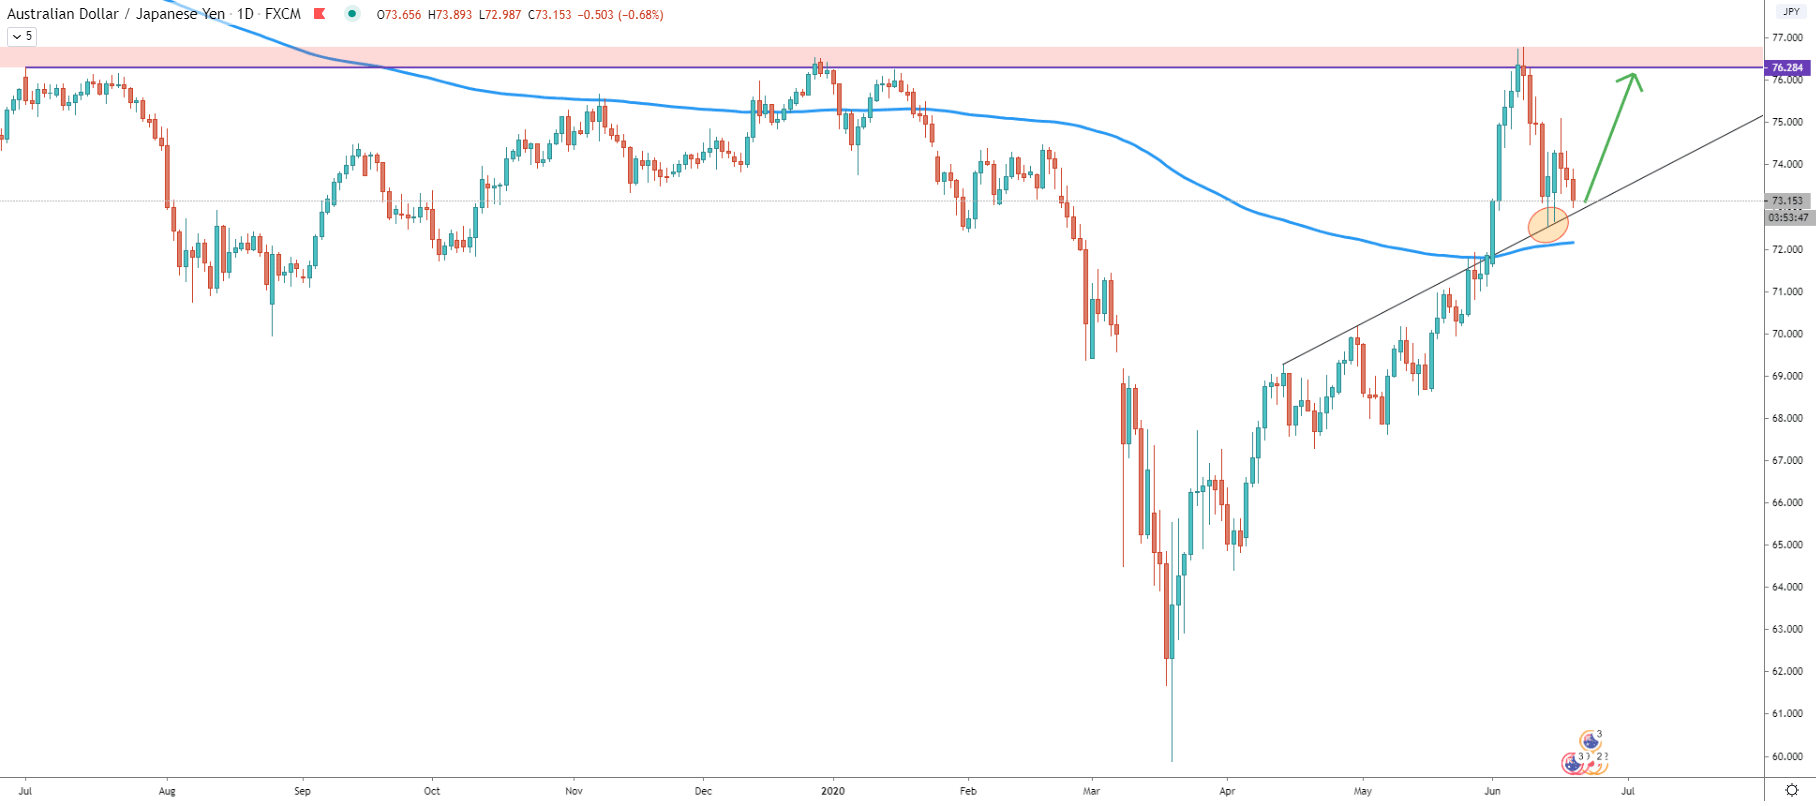
On the daily chart, we can see a clean bounce off the previously formed resistance trendline. For two consecutive days price rejected the trendline and still trading near the bottom. At the same time, the price remains above the 200 EMA and right now it could be the best moment for bulls if there is a strong interest in buying AUD/JPY. The strongest resistance remains near 76.30, which is a potential 300 pips upside move.
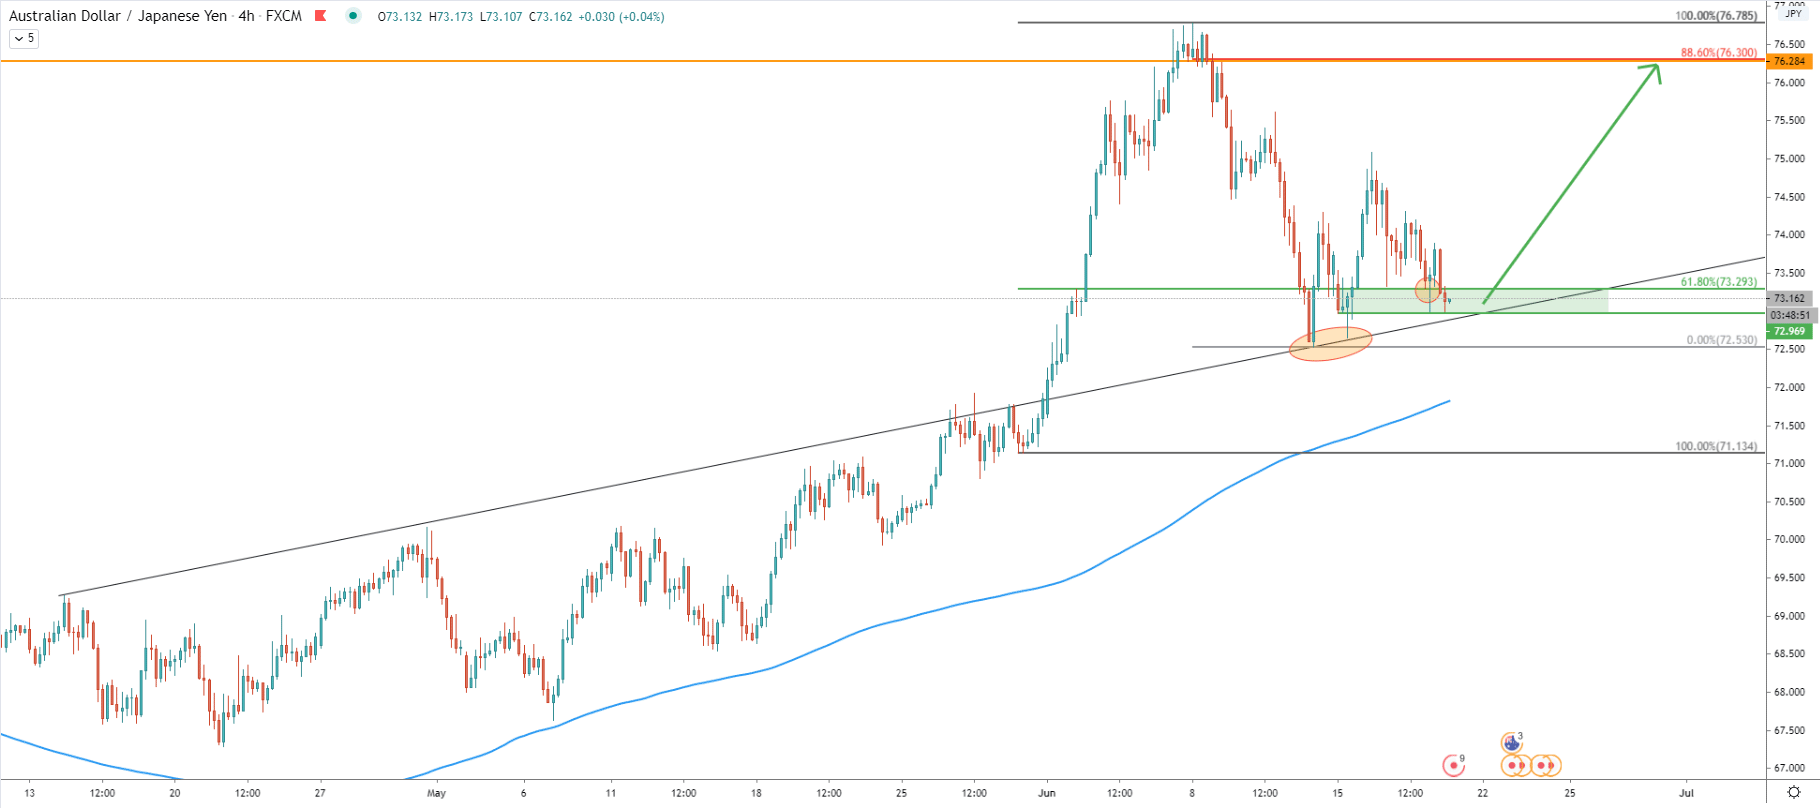
After a double rejection of the uptrend trendline, the price formed support at 72.97, which today was rejected cleanly. Moreover, the Fibonacci applied to the last wave up, shows that 61.8% retracement level at 73.30 is also being rejected and there was no clean break and close below this level. It makes the area between the 73.00 - 73.30 a very strong demand zone in the medium and long term.
We might witness increased volatility in the coming days, and as long as price remains above 73.00 psychological level, AUD/JPY should be expected to rise. The Fibonacci, applied to the current correction down, shows that 88.6% Fibs at 76.28 also corresponds to the major resistance level as per the weekly and daily charts.
Maybe we are witnessing a “W” pattern price formation, as long as AUD/JPY is holding the uptrend trendline. The overall downtrend trendline was broken and currently, pair corrected down and the downtrend trendline along with the uptrend trendline is now acting as the support.
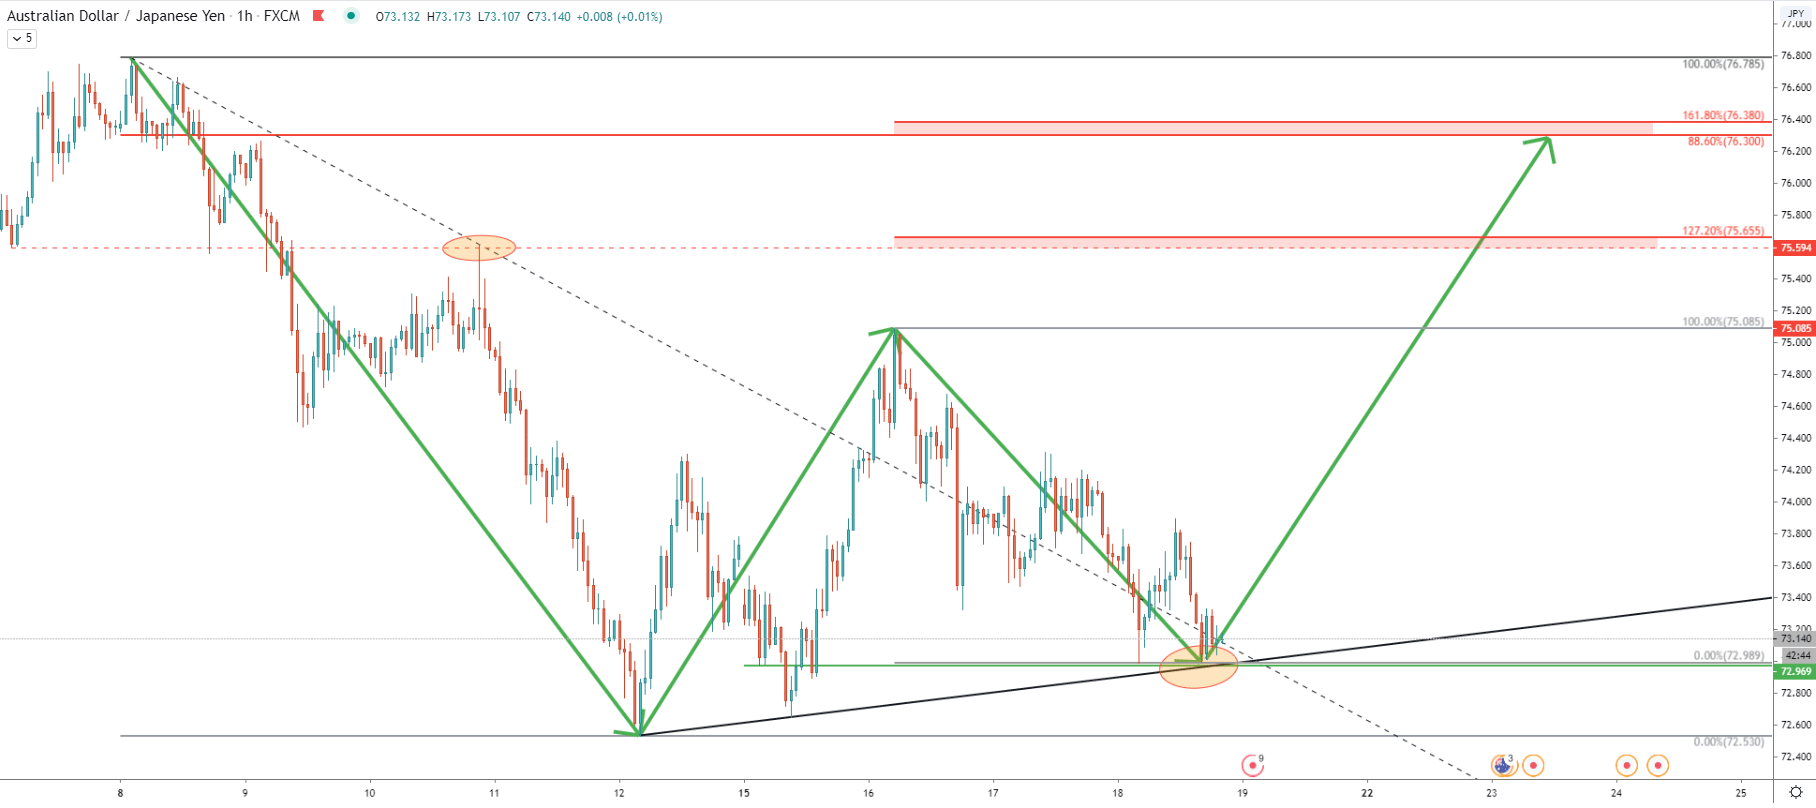
It certainly seems like the very beginning of a strong rally and on this chart, there are two major resistance levels. The nearest one is at 127.2% Fibs at 75.65, applied to the current correction. It also goes in line with the previously formed resistance where the downtrend trendline was rejected. The second and perhaps the final upside target for the potentially upcoming wave up is located between 161.8% and 88.6% Fibs, which is 76.30 - 76.40 area.
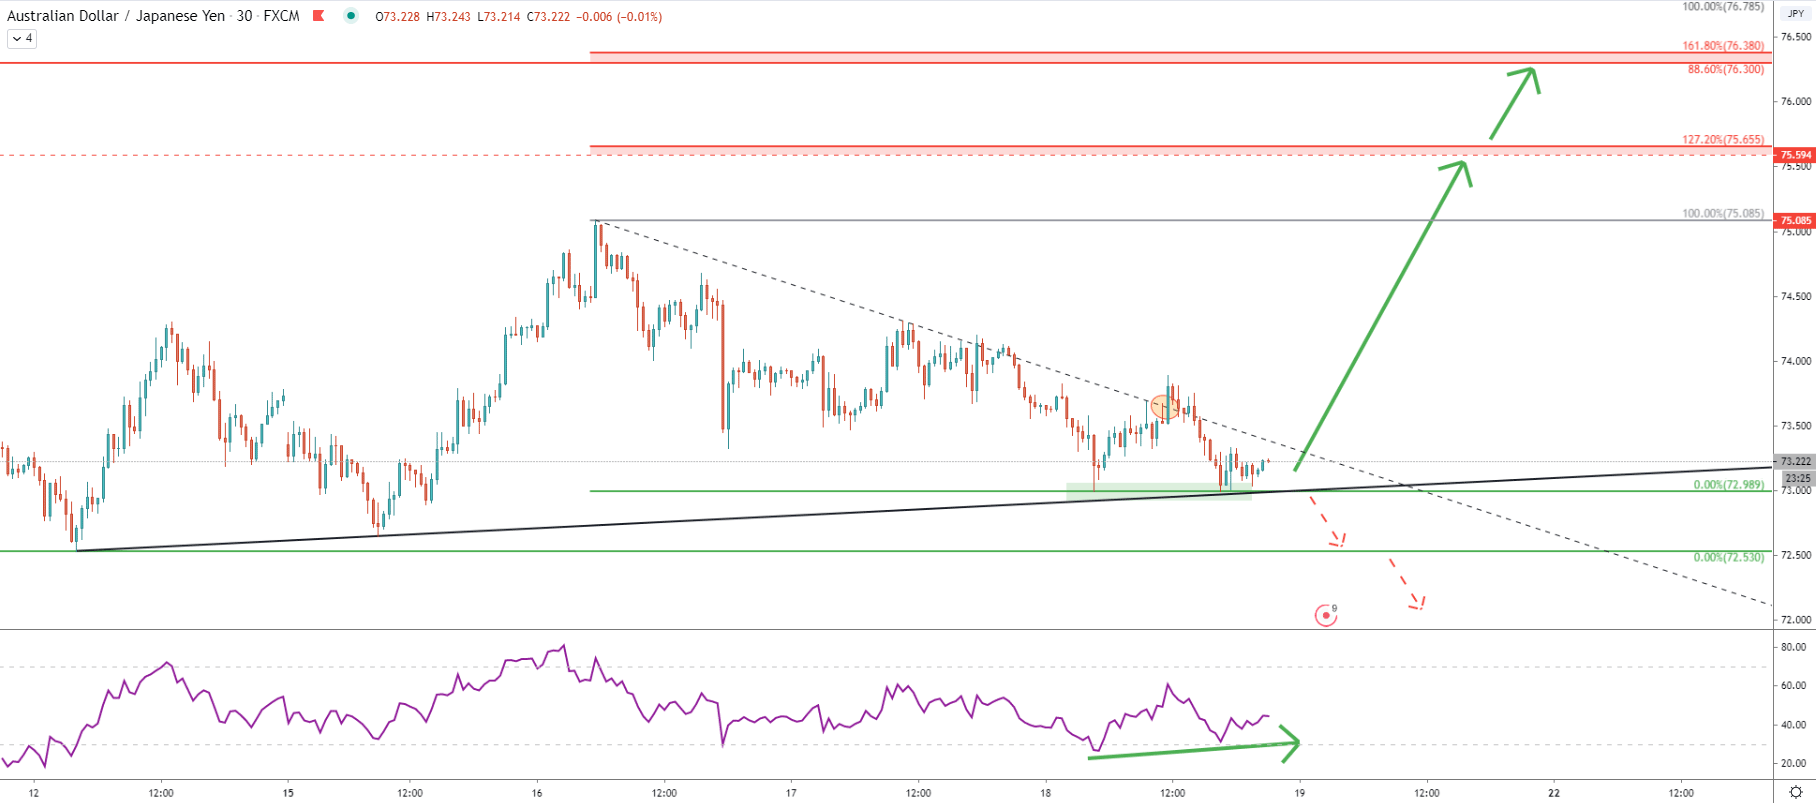
Finally, the 30-minute chart, where we can witness the formation of the double bottom. Along with it, the RSI oscillator formed a bullish divergence, prior to which the downtrend trendline was broken. Certainly, this could be the inception of the strong upside move, but only as long as price remains above the 73.00 support.
The long term trend seems to be changing from bearish to bullish after price broke above the downtrend trendline on the weekly chart. Nevertheless, there is a massive resistance area, which must be broken to confirm the validity of the uptrend. But at the same time, the probability is in favor of the price moving north, to test previously formed resistance. Currently, pair has formed a double bottom along with a bullish divergence after breaking above the downtrend trendline. This shows bullish domination, which might increase buying pressure in the coming days.
As per the 1-hour chart, there are two major resistance levels. The first is at 75.65, which is likely to be broken in case of a strong uptrend. If that will be the case, second resistance is seen near 76.30 and is confirmed by two Fibonacci retracement levels, as well as previously formed resistance on the weekly chart.
The probability of the downtrend is still high, because of the rejection of the long term resistance on the weekly chart. If price breaks below the 73.00 level with the daily close below, the price might re-test the 72.53 support. But a daily close below 72.53 will completely invalidate the bullish scenario and price can either consolidate for an extended period of time or start trending down.
Support: 73.00, 72.53
Resistance: 75.65, 76.30


