
Published: August 7th, 2020
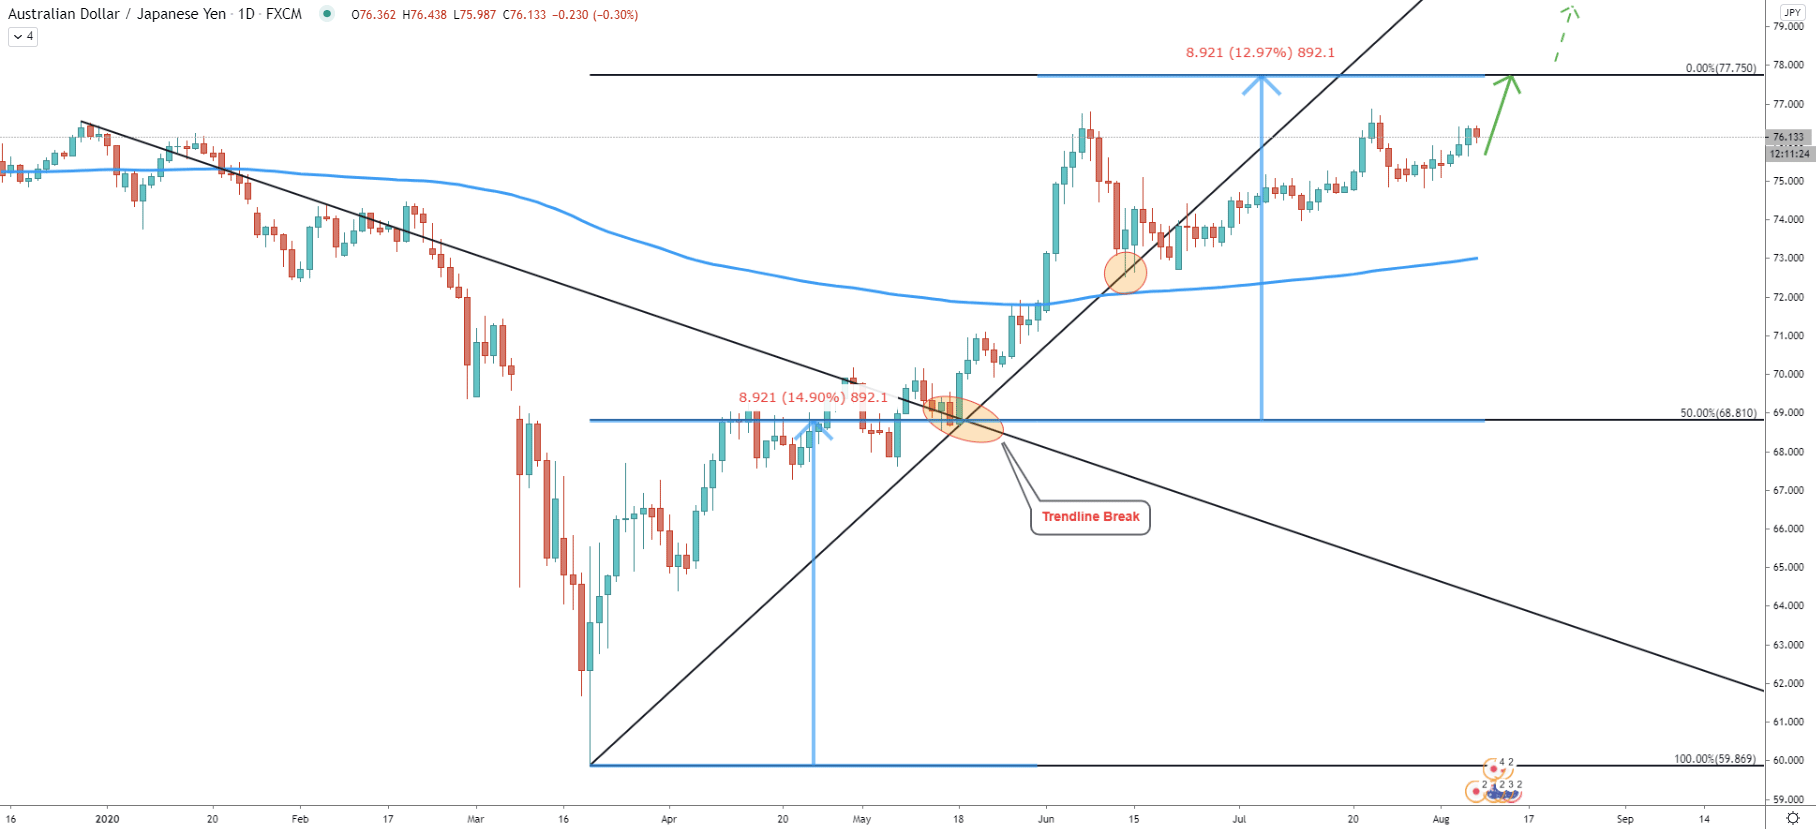
The price of the AUD/JPY currency pair continues to rise in the long-term, where the overall trend remains very bullish. The big question is how far price can go, and to determine this, we have applied the Fibonacci retracement indicator so that 50% retracement level is placed at the breakout point of the downtrend trendline. The idea of such an approach is to show that the distance from the bottom to the breakout usually equals the distance from the breakout to the upside target. In our case, the target is seen at 0% Fibs at 77.75 level. This means that there is still potential for over 150 pips in the short to medium term.
Also, considering the rejection of the long term uptrend, which occurred on June 12, the price could go far beyond the nearest resistance at 77.75. However, for such a scenario, there must be daily and weekly close above this resistance.
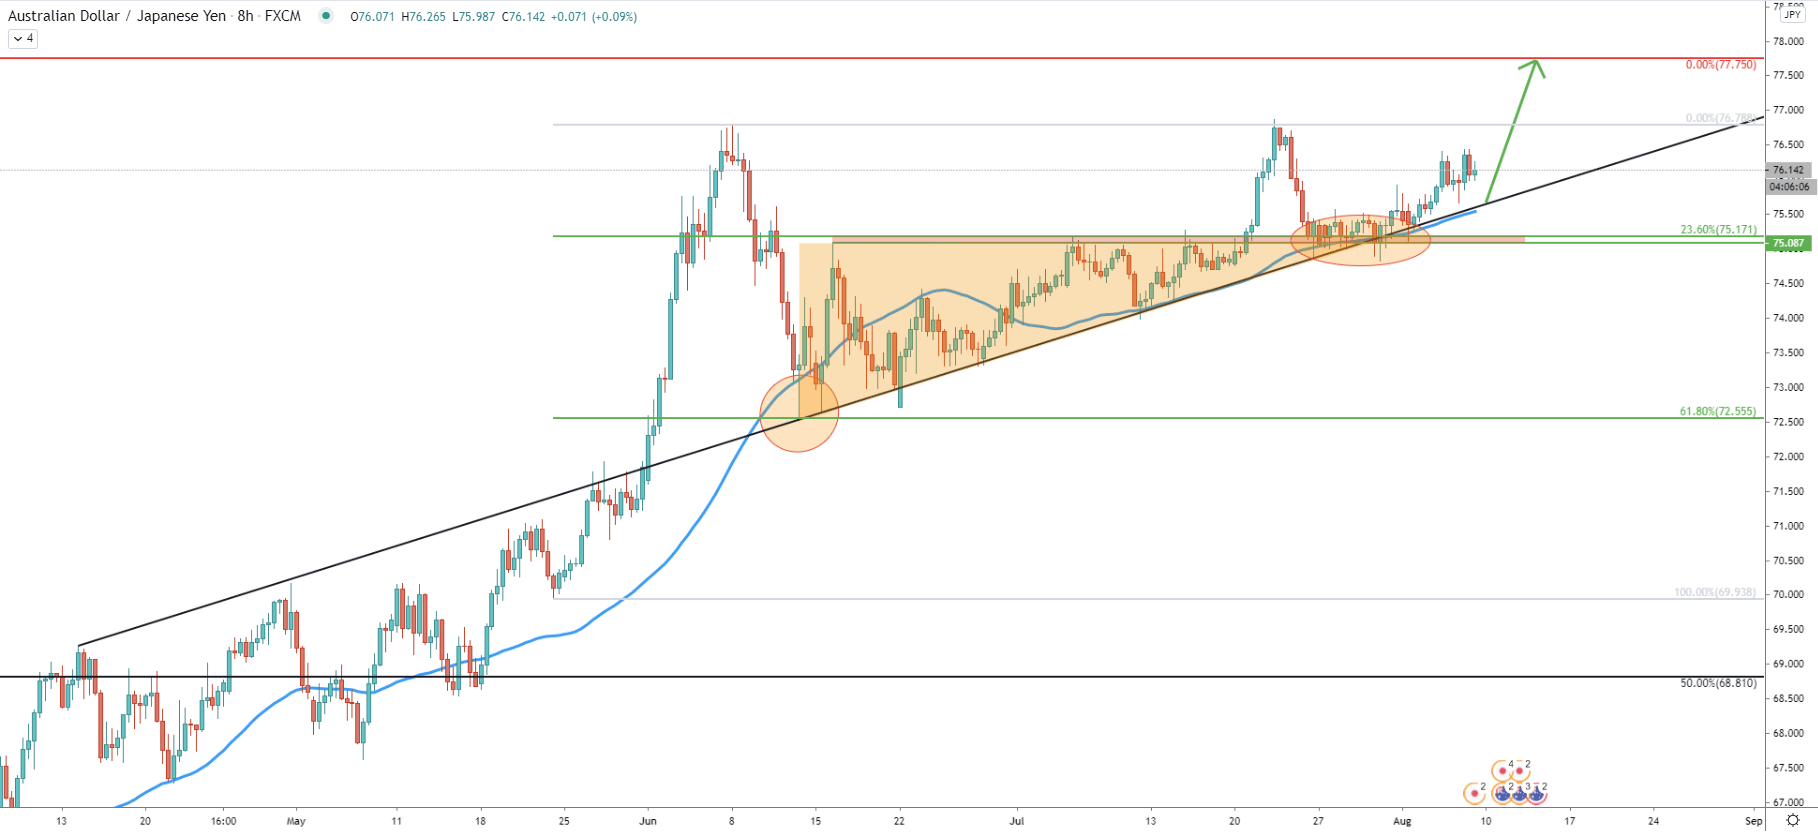
On the 8-hour chart, we have applied an average-price uptrend trendline which shows that it has been consistently rejected during past few months. Along with the trendline, AUD/JPY rejected 50 Simple Moving Average and the 61.8% Fibonacci retracement level on June 12.
Since then price has been consolidating and formed a triangle pattern that was broken on July 21. Price went up and tested 76.87 high on July 22. The correction down followed and stopped by the average-price trendline and the 50 SMA. At the same time, 23.6% Fib support at 75.17 acted as the resistance which corresponds with the previous resistance of the triangle pattern. This was a massive demand zone, resulting in the price increase yet again. All-in-all, the trend remains heavily bullish and any sort of pullback could provide a good opportunity for buyers once again.
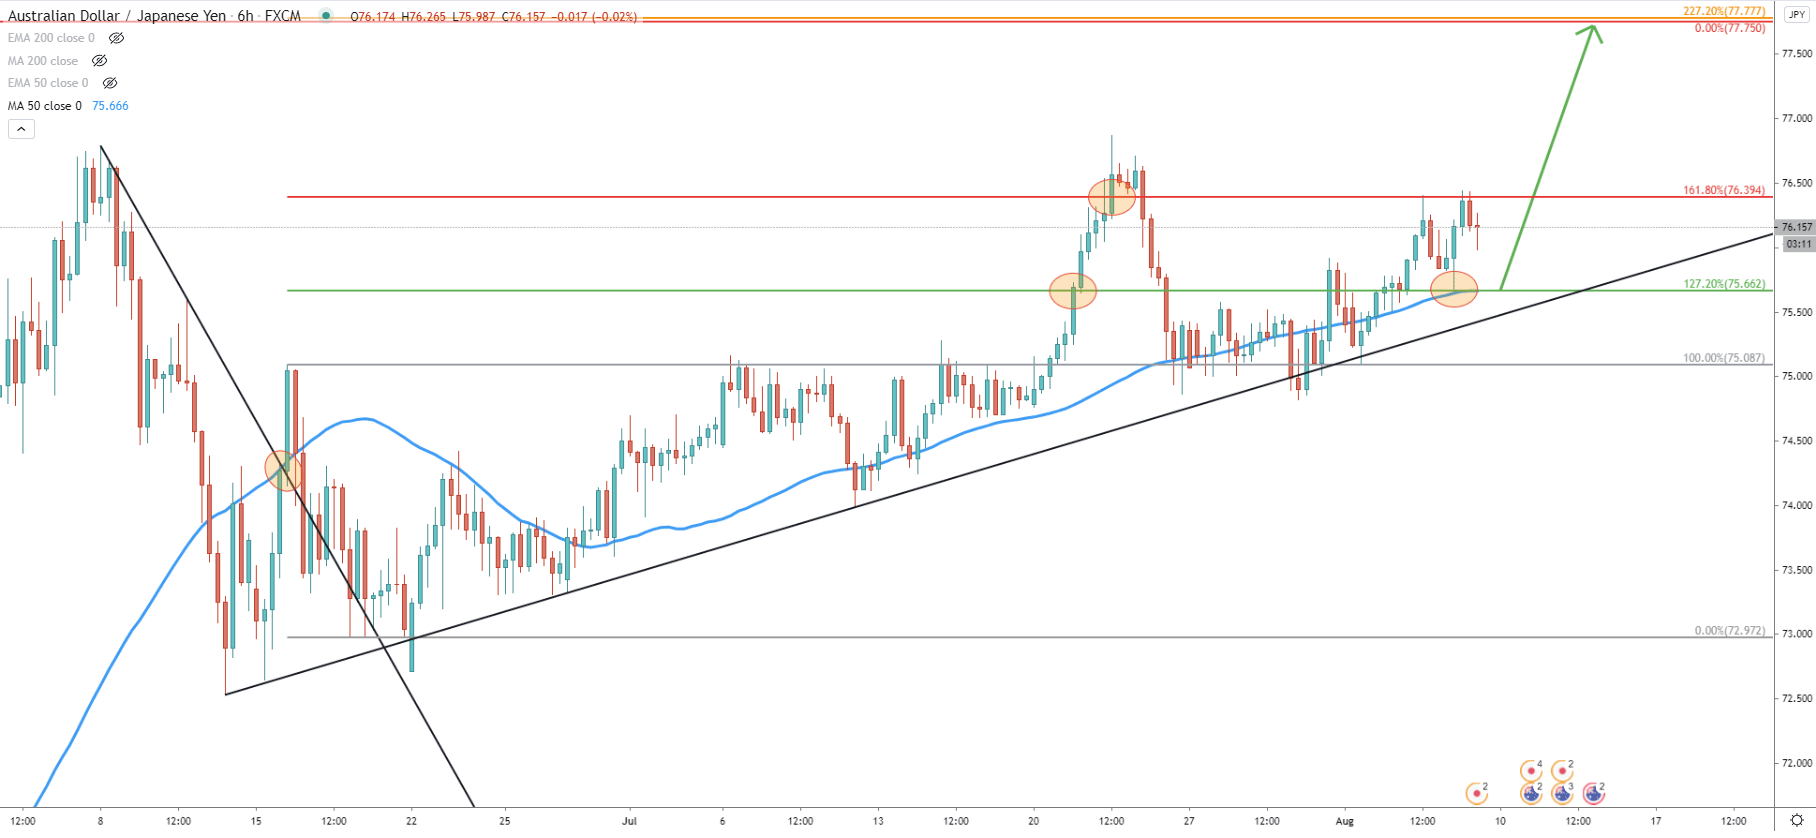
Here, the Fibonacci retracement indicator was applied to the corrective wave down after the price broke above the downtrend trendline. The 127.2% Fibs and 161.8% Fibs were both rejected, suggesting the next resistance level at 227.2%. It is located at 77.77, which almost exactly corresponds to the 0% Fibs as per the Daily chart.
We can also see, that yesterday AUD/JPY cleanly rejected 127.2% retracement level at 75.66 along with the 50 SMA. This could have been the perfect buying opportunity for a 200 pip upside swing.
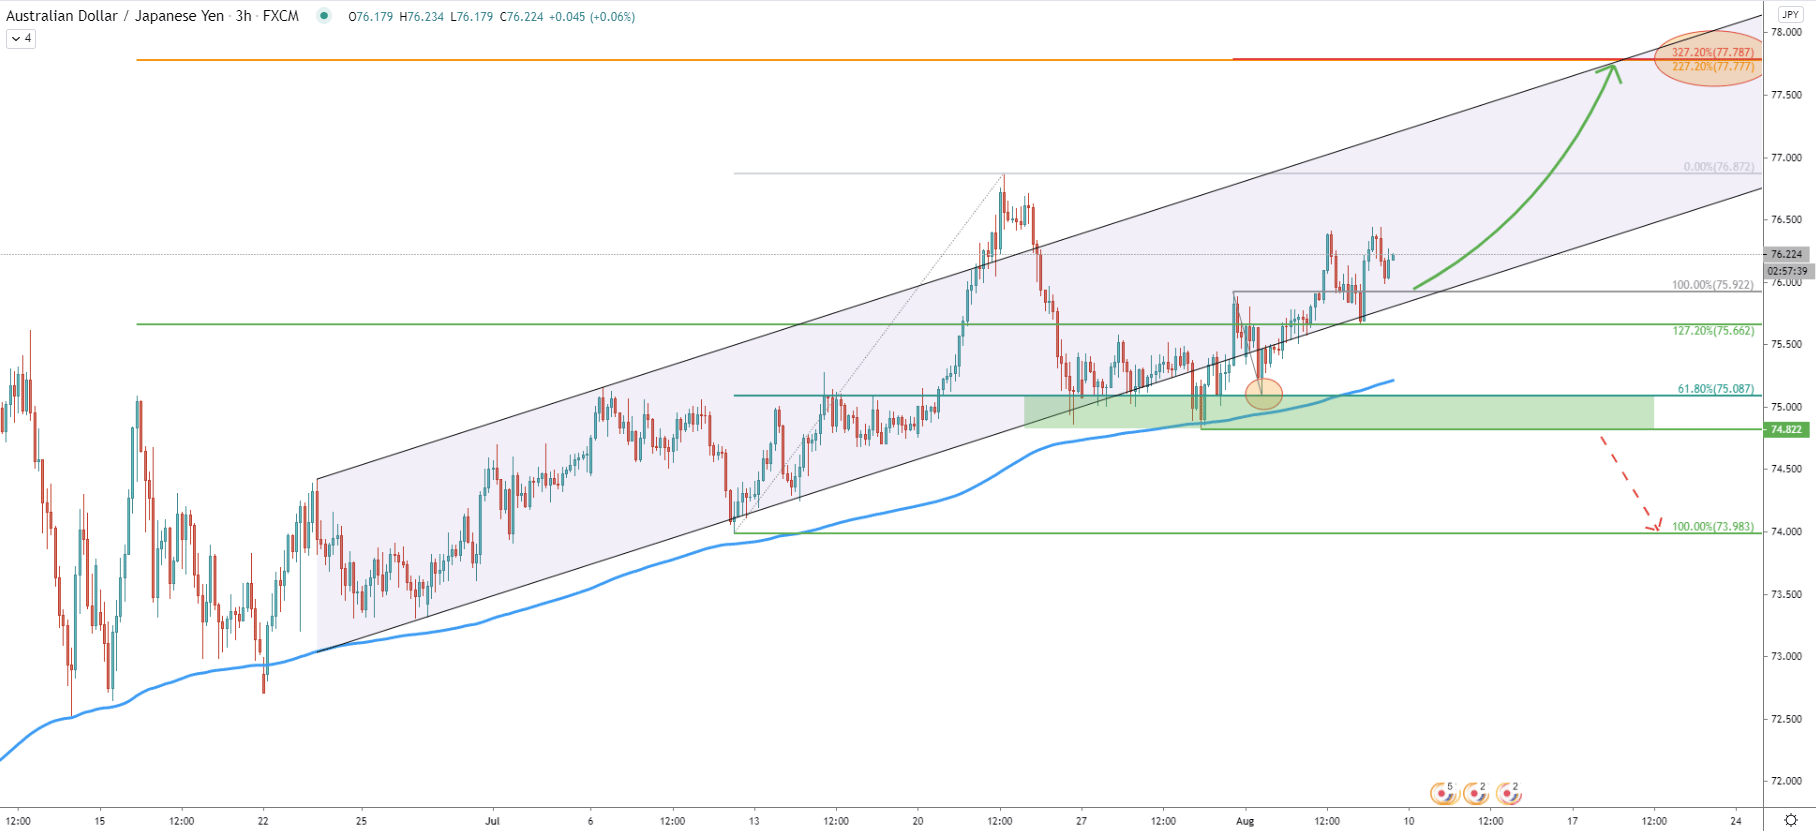
On the 3-hour chart price remains above the 200 Exponential Moving Average with the most recent clean rejection occurred on July 30. Along with the EMA, the price has rejected the bottom of the ascending channel and started to produce higher highs and higher lows. Fibonacci, applied to the last wave up, where a previous higher high was formed, shows that 61.8% Fibs at 75.08 also was rejected cleanly on August 3.
We have applied yet another Fibonacci retracement indicator to the pullback where 61.8% Fibs was rejected. 327.2% corresponds precisely to the previously mentioned resistance at 77.77.
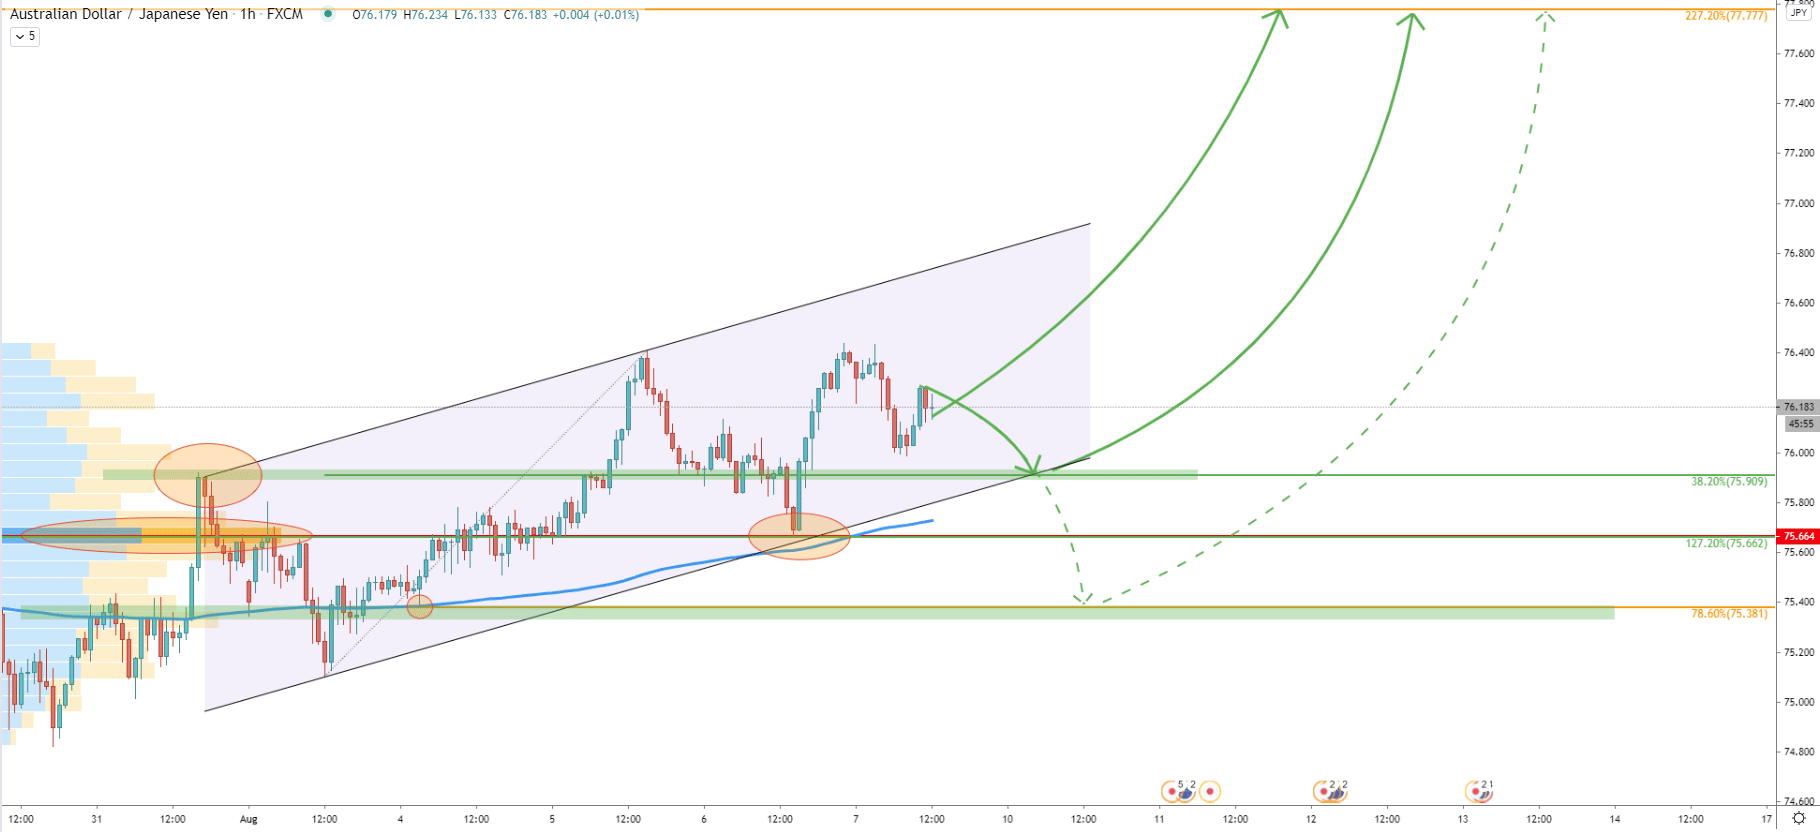
On the hourly chart, we’d like to share several bullish scenarios that could take place this and the beginning of next week. The first is very optimistic, where the price will continue rising without stopping. The second and third are less optimistic although still very bullish. This is if AUD/JPY will correct down and reject one of the support levels prior to the uptrend continuation.
Yesterday we’ve shared analysis on the NZD/JPY which is highly correlated to the AUD/JPY currency pair. Both of these pairs providing multiple clues on the continuation of the uptrend in the short, medium, and even long term. Support levels and indicators are being rejected consistently, which strongly suggests that another strong upswing might be just around the corner.
As per the Daily, 6-hour, and 3-hour chart, there are 3 different Fibonacci retracement levels corresponding to one price. This is 77.77 resistance which is over 150 pips away from the current price.
As per the hourly chart, the nearest support is seen at 75.90 which is38.2% Fibs corresponding to the bottom of the ascending channel as well as 200 Exponential Moving Average. This should be a very strong demand zone, although it is possible that the price will break even lower. The next support is at 75.66, which corresponds to the 127.2% Fibs as well as the Volume Profile indicator level. The final support is seen at 75.38, which is 78.6% Fibs, where previously price bounced off rejecting the 200 EMA.
Daily break and close below the 75.38 could invalidate bullish scenario sending price much lower. However sikes below are possible and as per the 3-hour chart, NZD/JPY might re-test 75.00 area, before/if uptrend will resume. The final confirmation of the downtrend is likely to be a break below the 74.82 support, in which case price can easily drow to 74.00 psychological support.
Support: 75.90, 75.66,75.08, 74.82
Resistance: 76.39, 76.78, 77.77


