
Published: June 22nd, 2020
Last week we were focused on the strong Australian Dollar across the board and shared multiple AUD-related analyses. However, AUD pairs were mostly ranging throughout the past week, but today we can finally see some action picking up. While AUD might start outperforming most major fiat currencies, the Swiss Franc is expected to get weak, because of the potential Gold weakness. Today we’ll focus on the AUD/CHF currency pair and this week will try to share analysis on the expected Gold downtrend.
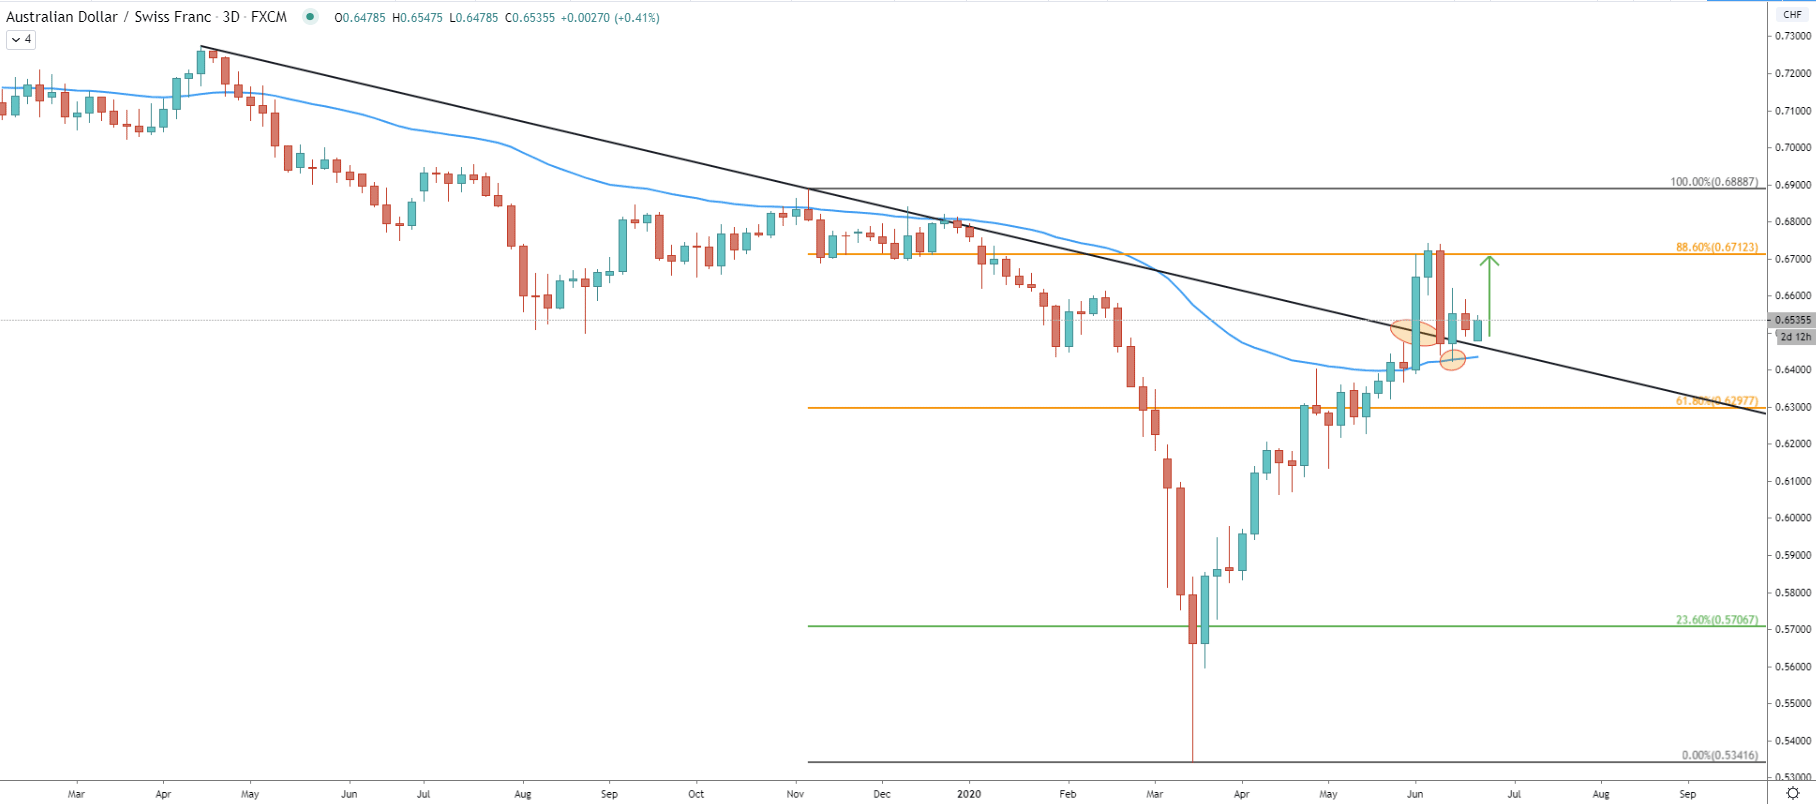
On the 3-day chart price broke above the long-term downtrend trendline, which is the very first sign of the AUD/CHF strength. After the breakout, pair has reached the 0.6743 high and then corrected down sharply. On the correction, the low has been established at 0.6424, where 50 Simple Moving Average was rejected. Today price has started to move north once again and considering current price action, the uptrend is likely to continue.
The nearest resistance is seen at the 0.6712, which is 88.6% Fibonacci retracement level applied to the last wave down. This is a potential 200 pip growth, which is expected to happen this or early next week. Although, if price breaks and closes above this resistance level on the weekly chart, the upside potential will become much larger.
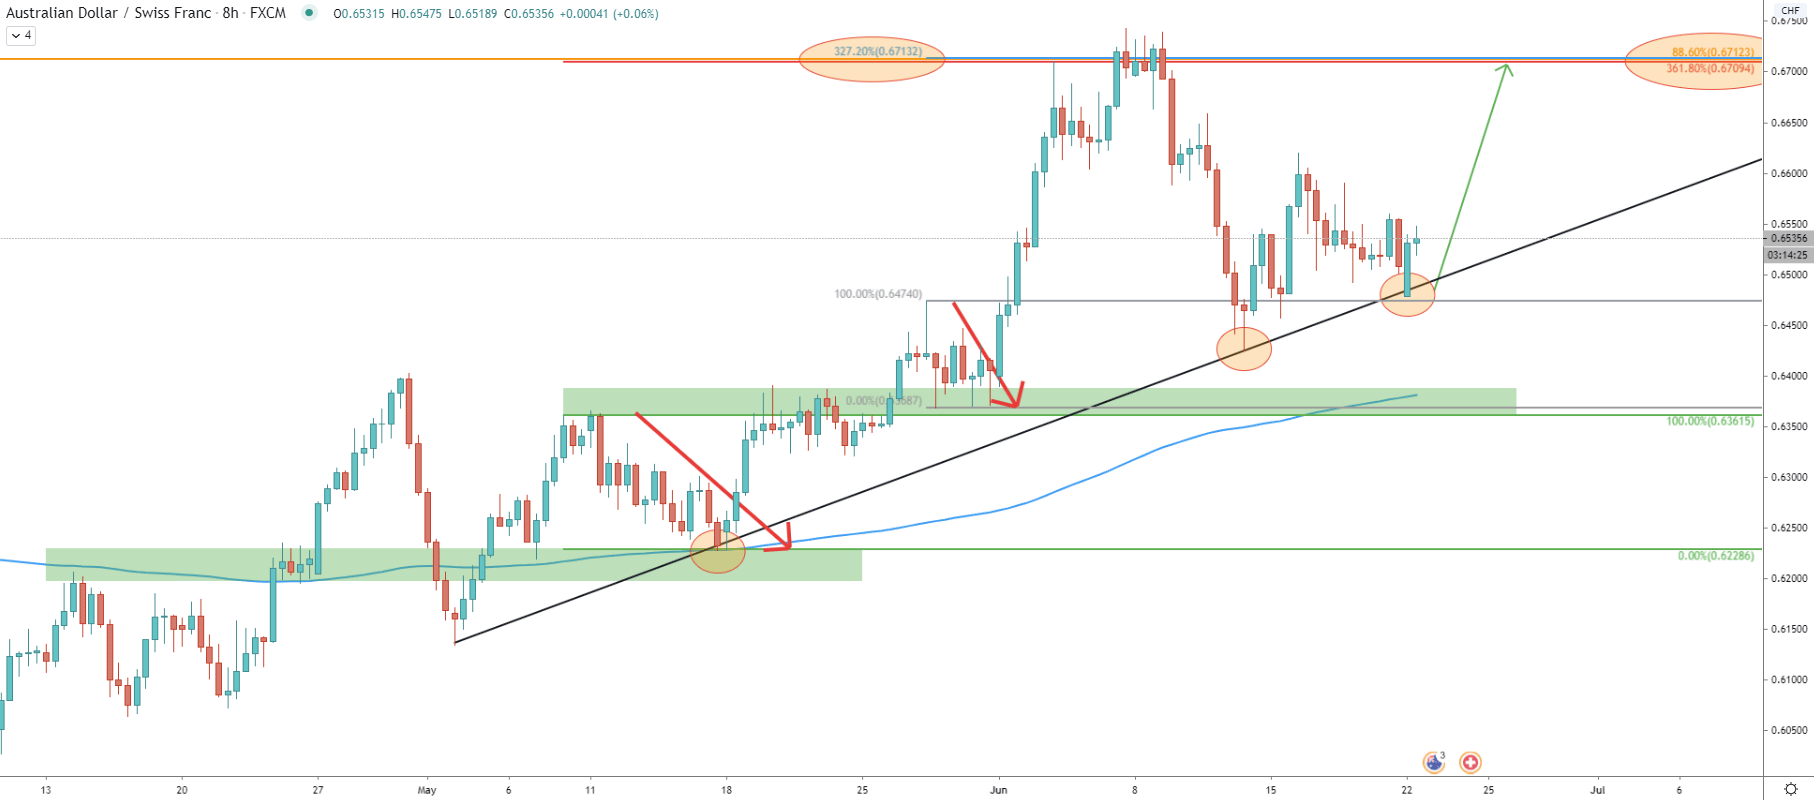
On the 8-hour chart, the uptrend trendline was rejected, even though there was an attempt to break below on today’s’ market opening. After the failed attempt to go down, the price started to rise. There are two Fibonacci indicators applied to the last two correctional waves down. The first correction occurred when the price rejected the 200 EMA, and the second rejection occurred when the price rejected the 0.6360 support area.
We can see that 361.8% and 327.2% Fibonacci retracement levels correspond exactly to the 88.6% Fibs as per the 3-day chart. All of them are pointing out to one price area near 0.6710, which makes it an extremely strong resistance for AUD/CHF.
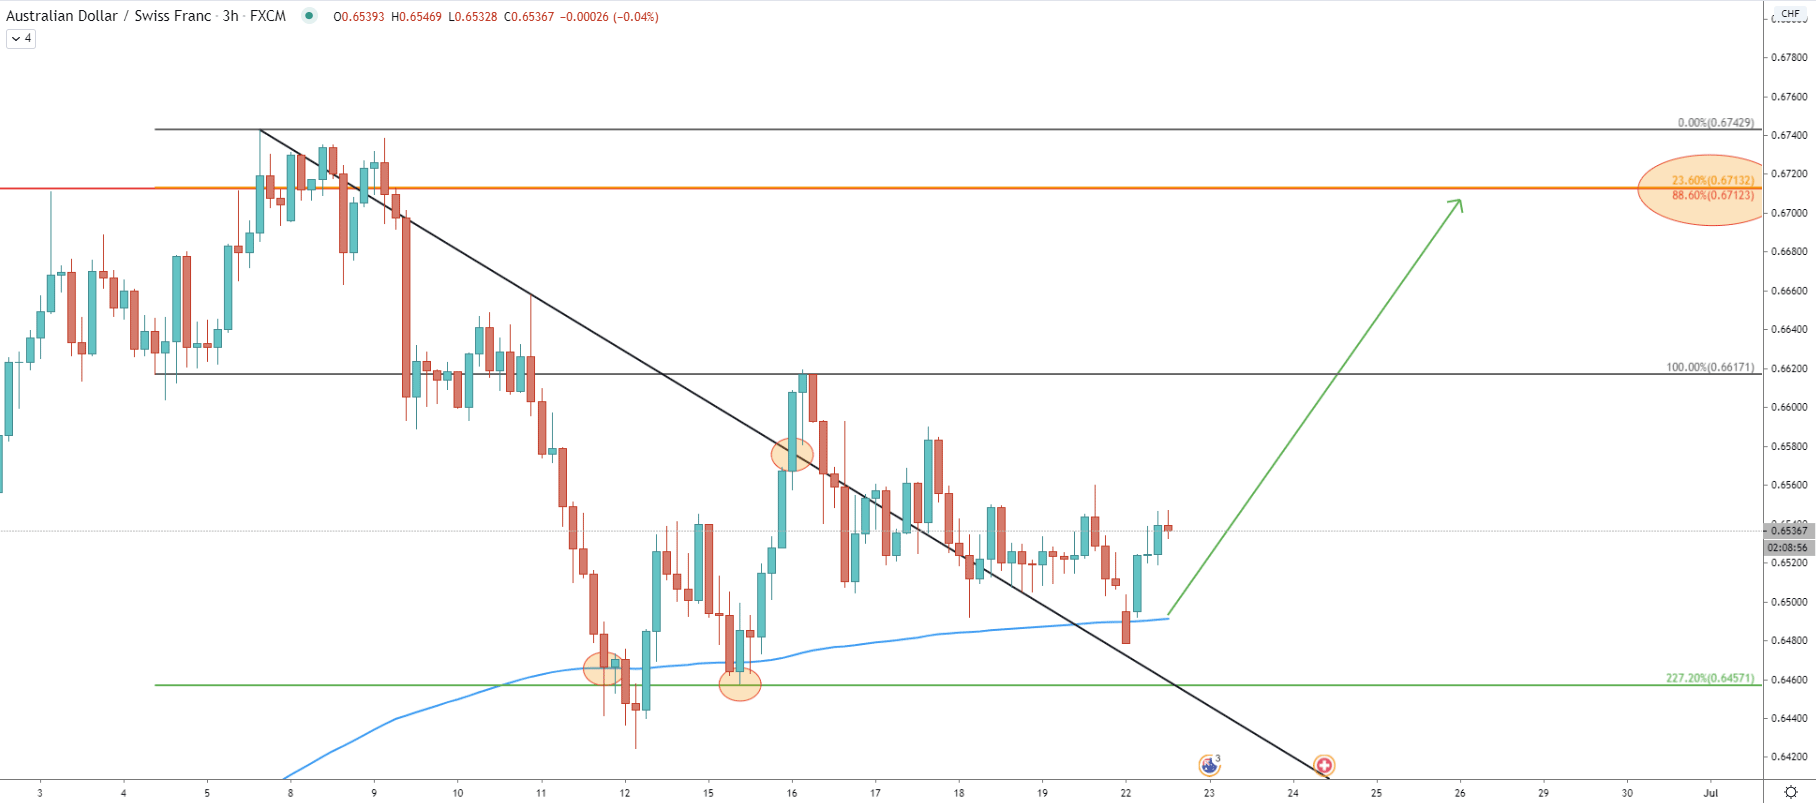
On the 3-hour chart, AUD/CHF has reached and rejected the 200 EMA. Price attempted to break lower but failed to close below. Then we can observe a clear rejection of the 227.2% Fibonacci retracement level applied to the last wave up, produced on June 5. This has triggered a strong upside wave, where the price was pushed above the downtrend trendline with a confirmed breakout. The most recent price action shows that AUD/CHF pulled back, to re-test the EMA as well as the uptrend trendline, which is now acting as the support. It could have been the starting point of the uptrend continuation towards the 0.6710 area. It is worth noting, that on this cart, the upside target is also confirmed by the 23.6% Fibs.
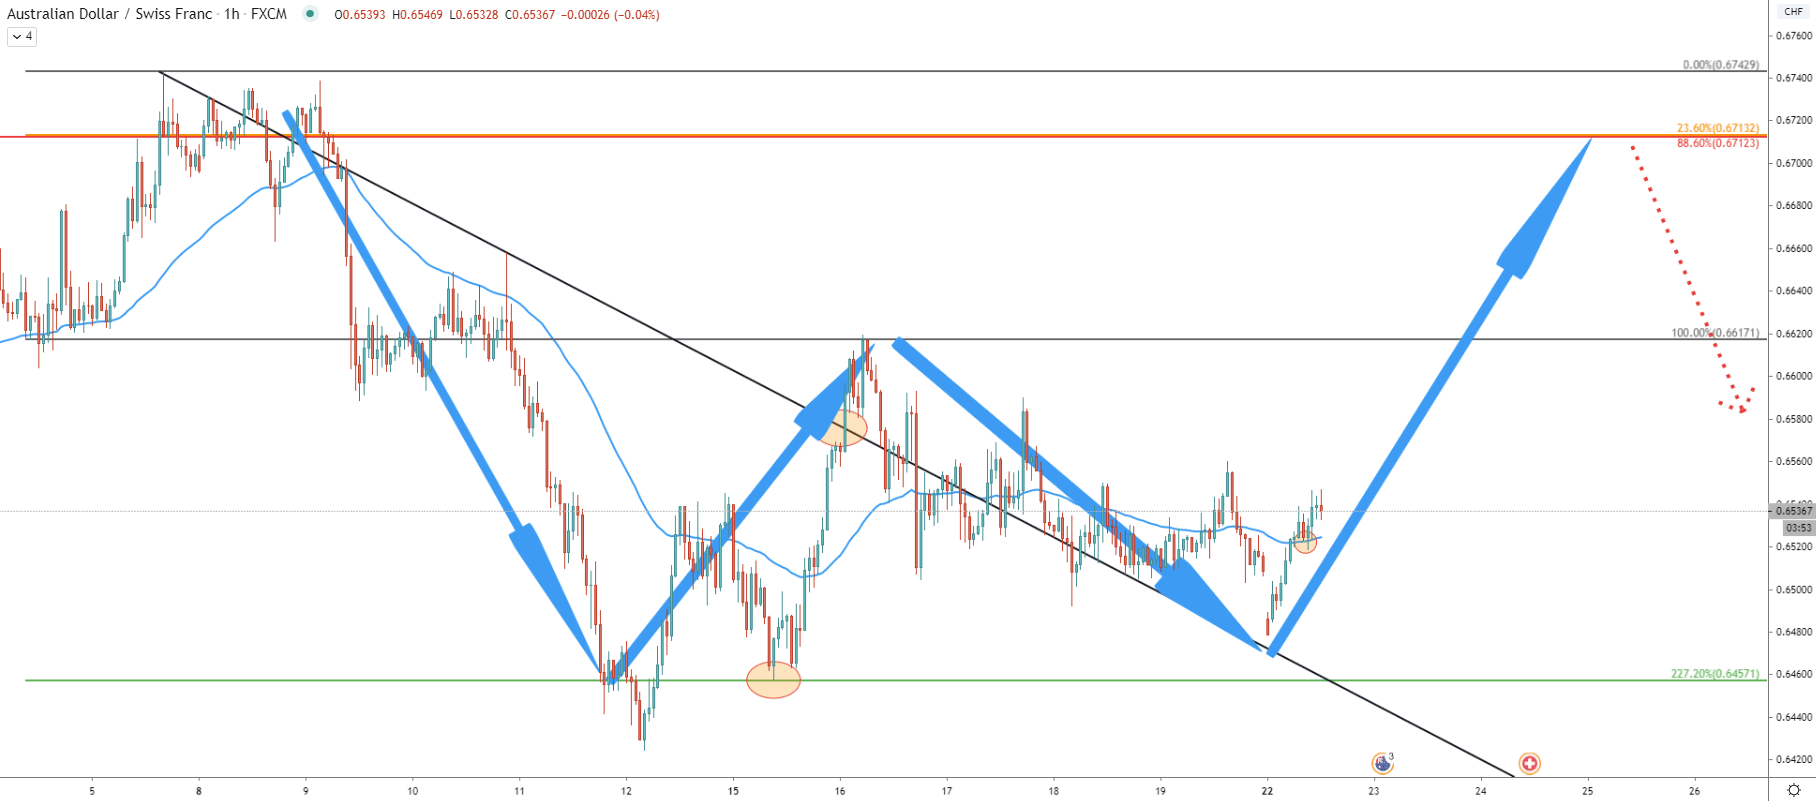
On the hourly chart, there is a formation of either a “W” reversal pattern or a “Bearish Gartley” pattern. If it is a reversal to the upside, there must be a break above the key resistance at 0.6710. However, if resistance will be rejected, a “Bearish Gartley” pattern should be confirmed. In this case, there will be an extremely strong moved down, over a long period of time.
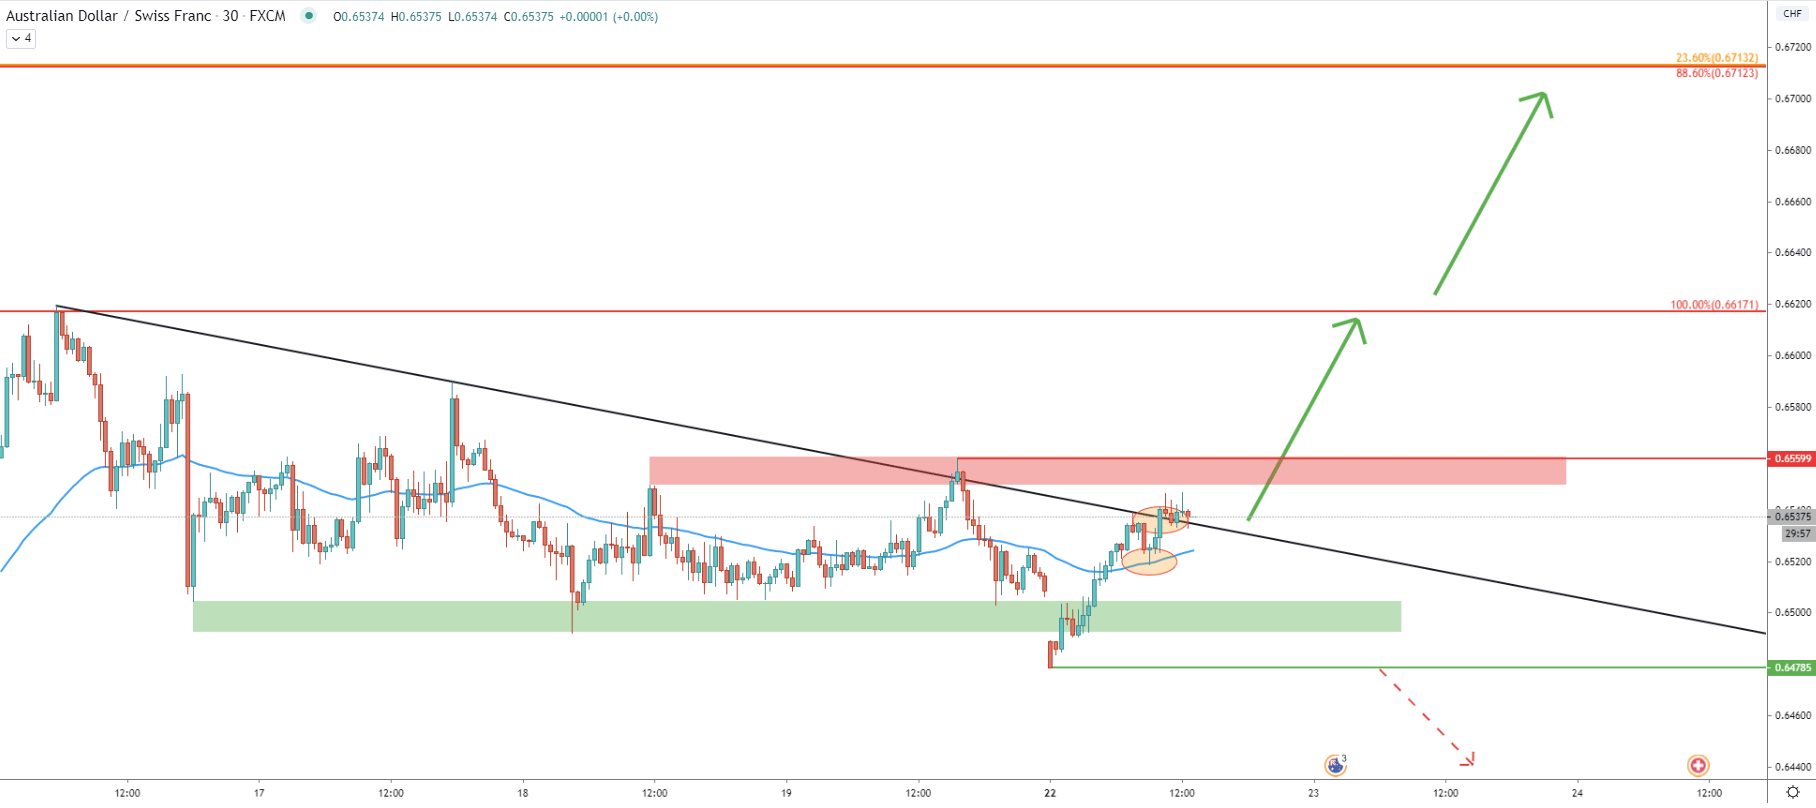
The 30-minute chart shows a break above the downtrend trendline yet again. But in this case, prior to the breakout price pulled back and rejected cleanly the 50 EMA. Perhaps on the shorter timeframe, as long as 0.6519 is respected, AUD/CHF will move to the upside. However, the potential resistance at 0.6617 should be taken into consideration and must be watched for either a rejection or a breakout.
AUD/CHF could be heading towards a new higher high on the 3-day chart. But it is yet to be confirmed whether there will be an uptrend continuation of a potential trend reversal. The confirmation fo the uptrend could be the Daily and Weekly close above 0.6714 resistance level. But if the rejected price might correct down strongly, or initiate a consolidation phase.
The upside target is located at 0.6710 area and is confirmed by 4 different Fibonacci retracement levels as per 3-day, 8-hour, and 3-hour charts.
The probability of the downtrend remains extremely low. Although there are certain signals to watch for the downside move. The first signal would be a 30-minute candle break and close below the 0.6519 level, where 50 EMA was cleanly rejected. If/when this occurs, price is likely to move lower and only 1-hour break and close below today’s’ low at 0.6479 can completely invalidate bullish forecast and AUD/CHF price will be at risk to go down strongly.
Support: 0.6519, 0.6479
Resistance: 0.6560, 0.6617, 0.6712


