Published: April 1st, 2020
Across the board, Australian Dollar currency pairs show strong signs of a potential trend reversal. Technically speaking price has reached either a top or the bottom and from this point onwards it is very possible that AUD will be outperforming other fiat currencies. In today’s’ analysis we will observe the AUD/CHF pair and its growth potential in the coming weeks.
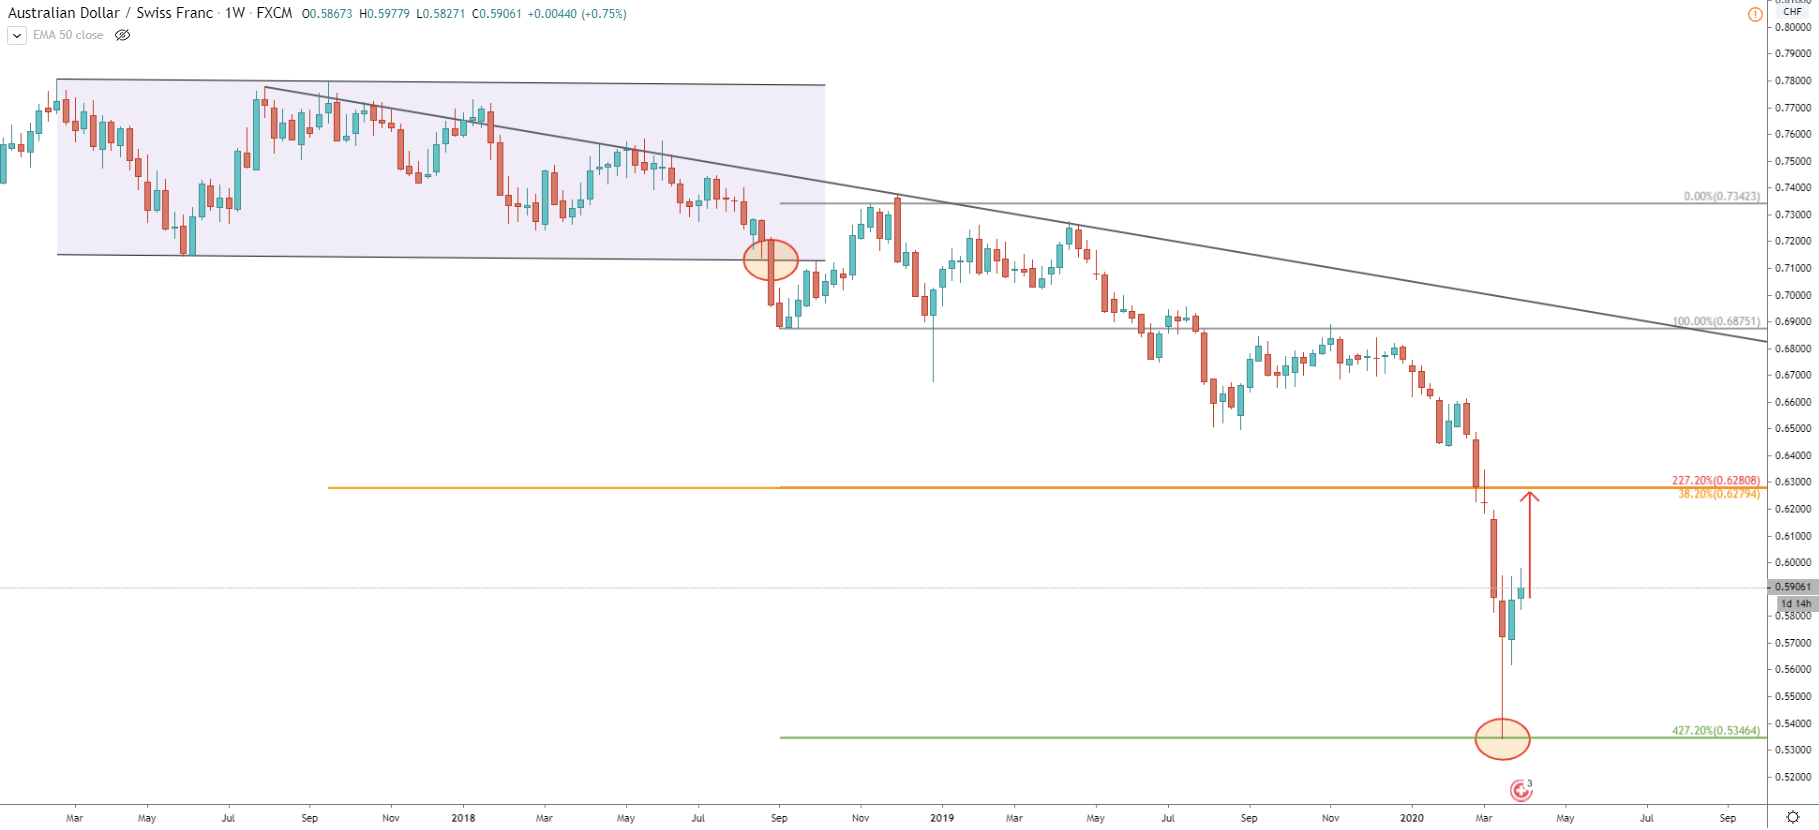
On the Weekly chart, AUD/CHF reached 0.5346 all-time low on March 19. We have applied the Fibonacci retracement indicator to the corrective wave up after the breakout of the channel. It shows that price has reached and rejected cleanly the 427.2% retracement level. Such clean bounces usually indicate either a top or a bottom of the prevailing trend. In our case, this could mean that AUD/CHF is either reversing or at the very least there will be a strong corrective move up.
The main and closes resistance for AUD/CHF is located at 0.6280. This price corresponds with two Fibonacci retracement levels. First being 227.2% retracement from the Fibs applied previously. The second is a 38.2% retracement level applied to the overall downtrend, which lasted between September 12, 2019, and March 19, 2020.
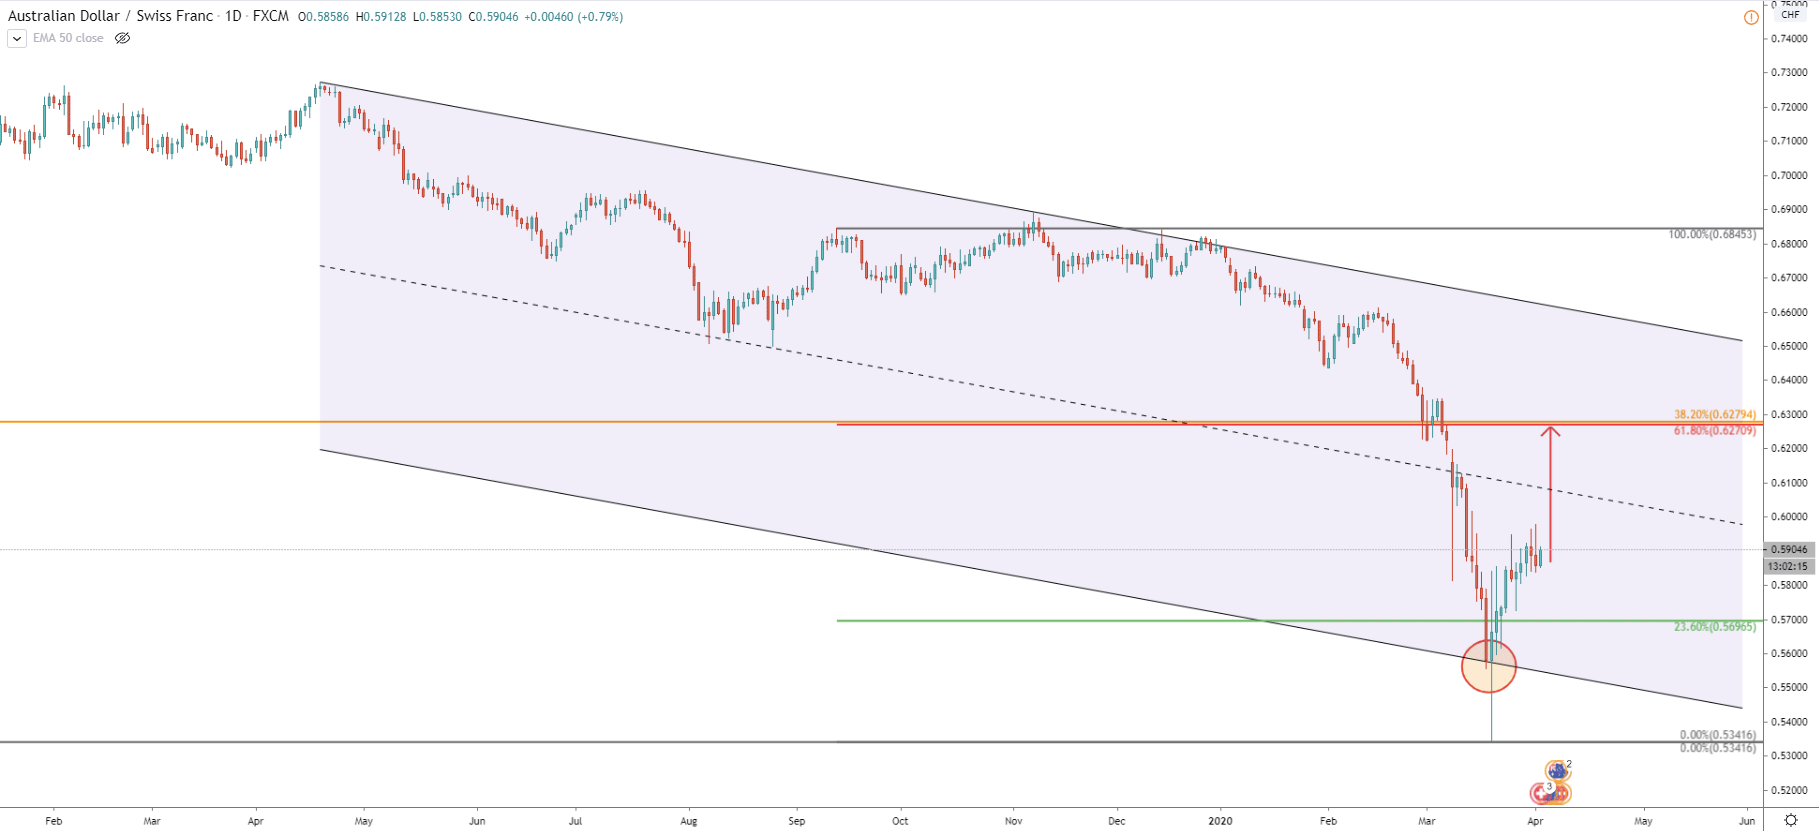
The daily chart shows that the pair reached the bottom of the descending extended channel. Price attempted to go lower and produce a huge spike down. However, it failed to close below channel trendline. Since testing the bottom price already recovered by more than 10%, and at this point, it looks like the recovering phase will continue for weeks to come.
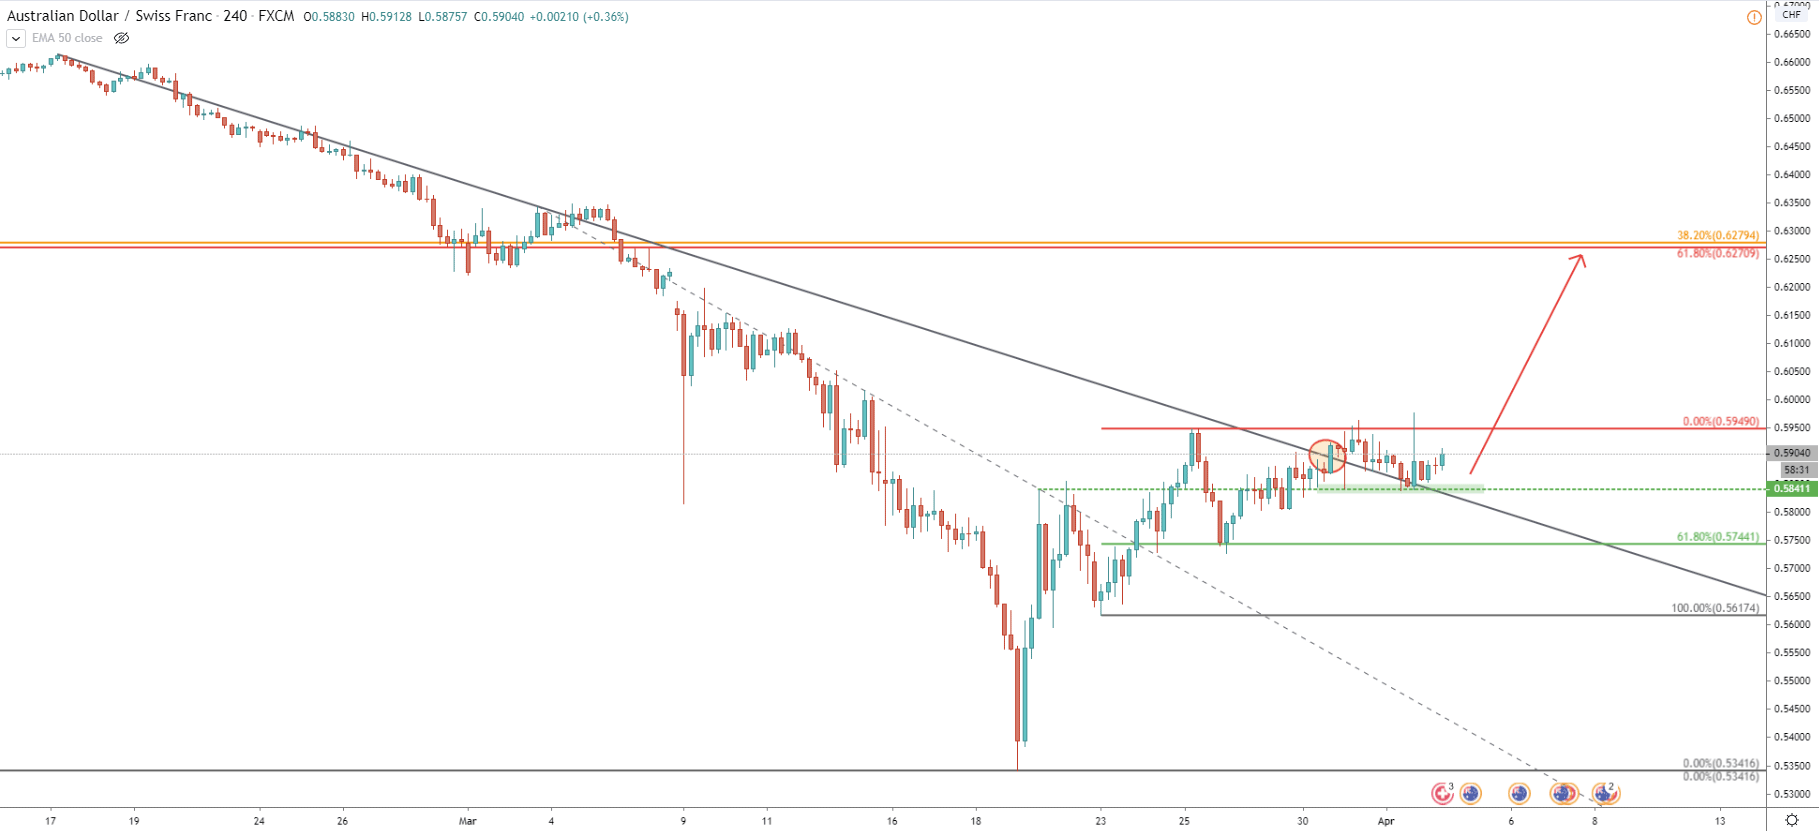
There are two downtrend trendlines applied to the 4H chart. After breaking the first trendline, AUD/CHF has corrected down and rejected a 61.8% Fibonacci retracement level. Then price continued to print lower lows and lower highs and currently, we can see yet another correction to the downside after breaking the second downtrend trendline. Clearly, there is a strong support formed at 0.5841, which previously was a resistance. Considering facts, that both trendlines were broken and both support were rejected, as long as there is no daily close below this 0.5841 support, AUD/CHF will continue moving upwards.
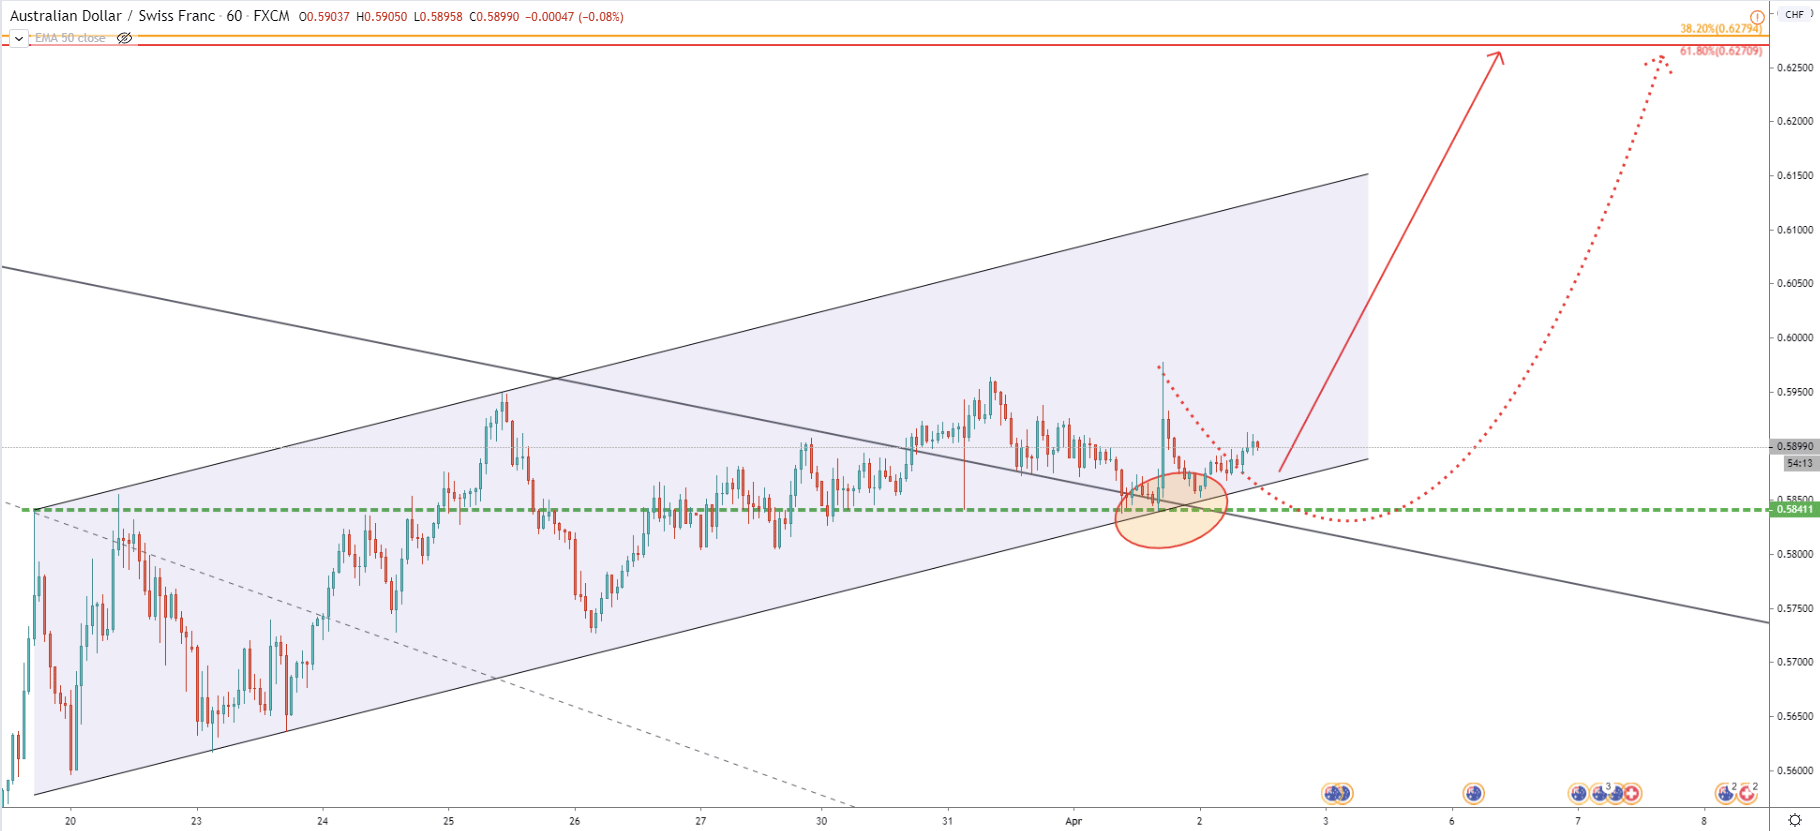
Filly comes to the 1H chart where the price is moving within the ascending channel. The most recent price action shows, that pair rejected the bottom of the channel after which produced a strong impulsive move up. It seems like bulls are starting taking over, although it might take some time for the pair to make a stronger move up. While short term consolidation can be expected, AUD/CHF also might go north without any warning. The key resistance at 0.6280 is 370 pips away, but if it gets penetrated with a weekly close above, this might be a confirmation of the beginning of a long term uptrend.
After a heavy downtrend, AUD/CHF finally could have teste the bottom and from now on price might go up in the long run. Current price action suggests that there are more buyers than sellers, which should result in a strong wave up towards the Fibonacci resistance level at 0.6280
There is only one upside target which is confirmed by two Fibonacci retracement levels. It is based at 0.6280, which is 6.5% and/or 370pips away from the current price level.
As long as there is no daily closing price below 0.5841 support, AUD/CHF should continue moving up. But if there will be support breakout, the bullish scenario will be invalidated and the long term downtrend is likely to continue.
Support: 0.5841
Resistance: 0.6280