
Published: February 27th, 2020
AUD/CHF downtrend has been going on since November 7. This is actually a 78-days consistent decline, which might have ended today.
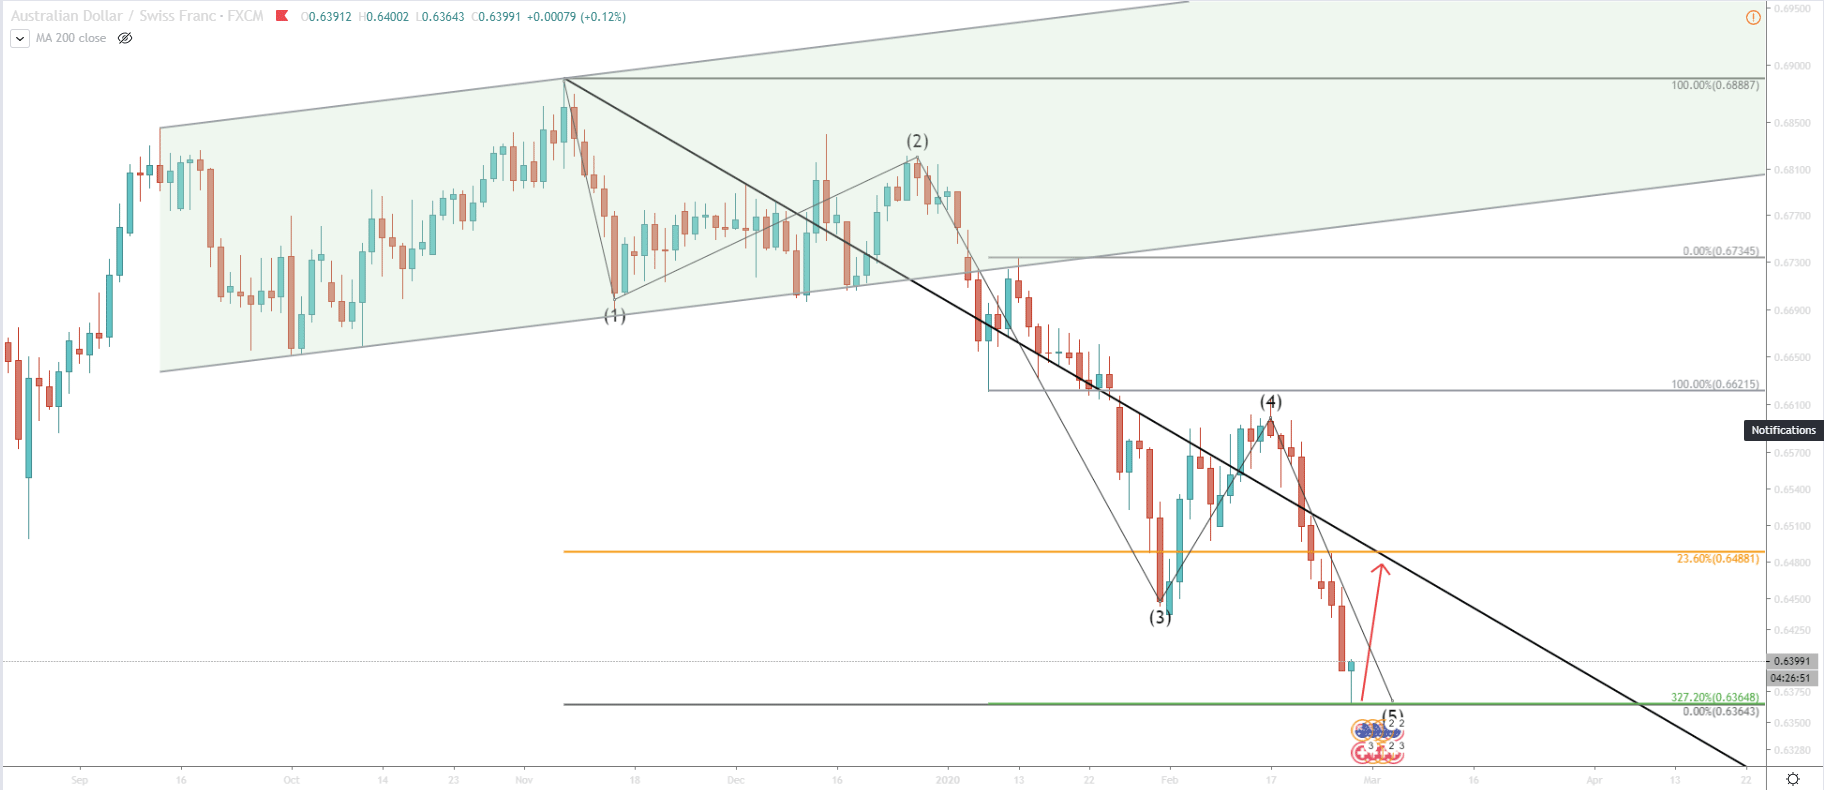
On the daily chart, AUD/CHF price broke the ascending channel, which produced a second wave down. Fibonacci applied to the corrective wave up after the channel breakout shows, that price rejected 327.2% Fibonacci cleanly, indicating that the downtrend could have come to an end.
At the same time, we see that it was the 5th wave down and according to the Elliot wave theory, this is the final wave of the trend. If the price will not go below 0.6343 support, it is highly likely that AUD/CHF fill start moving up. This could either be a correction and even a trend reversal.
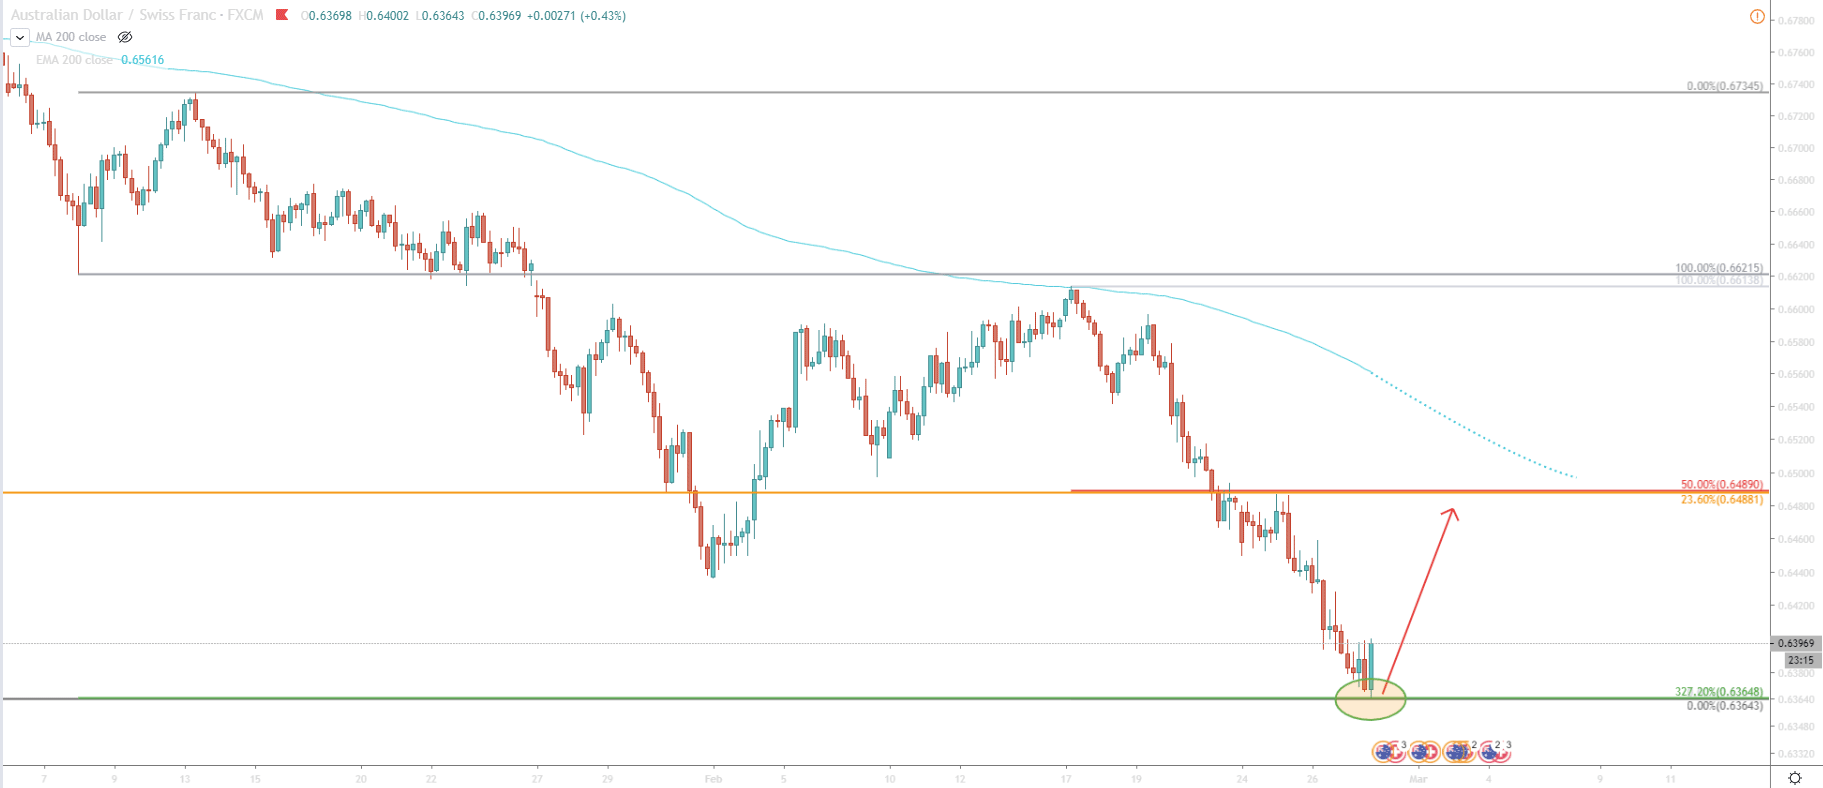
The 4H chart provides a view to the resistance level, which could be the target for buyers. This resistance is confirmed by two Fibonacci retracement levels, first being 23.6% applied to the long term downtrend. And second is a 50% retracement level applied to the most recent and final 5th wave down. Also by looking at the 200 Exponential Moving Average, we can see that price can rise higher and test it on the way up.
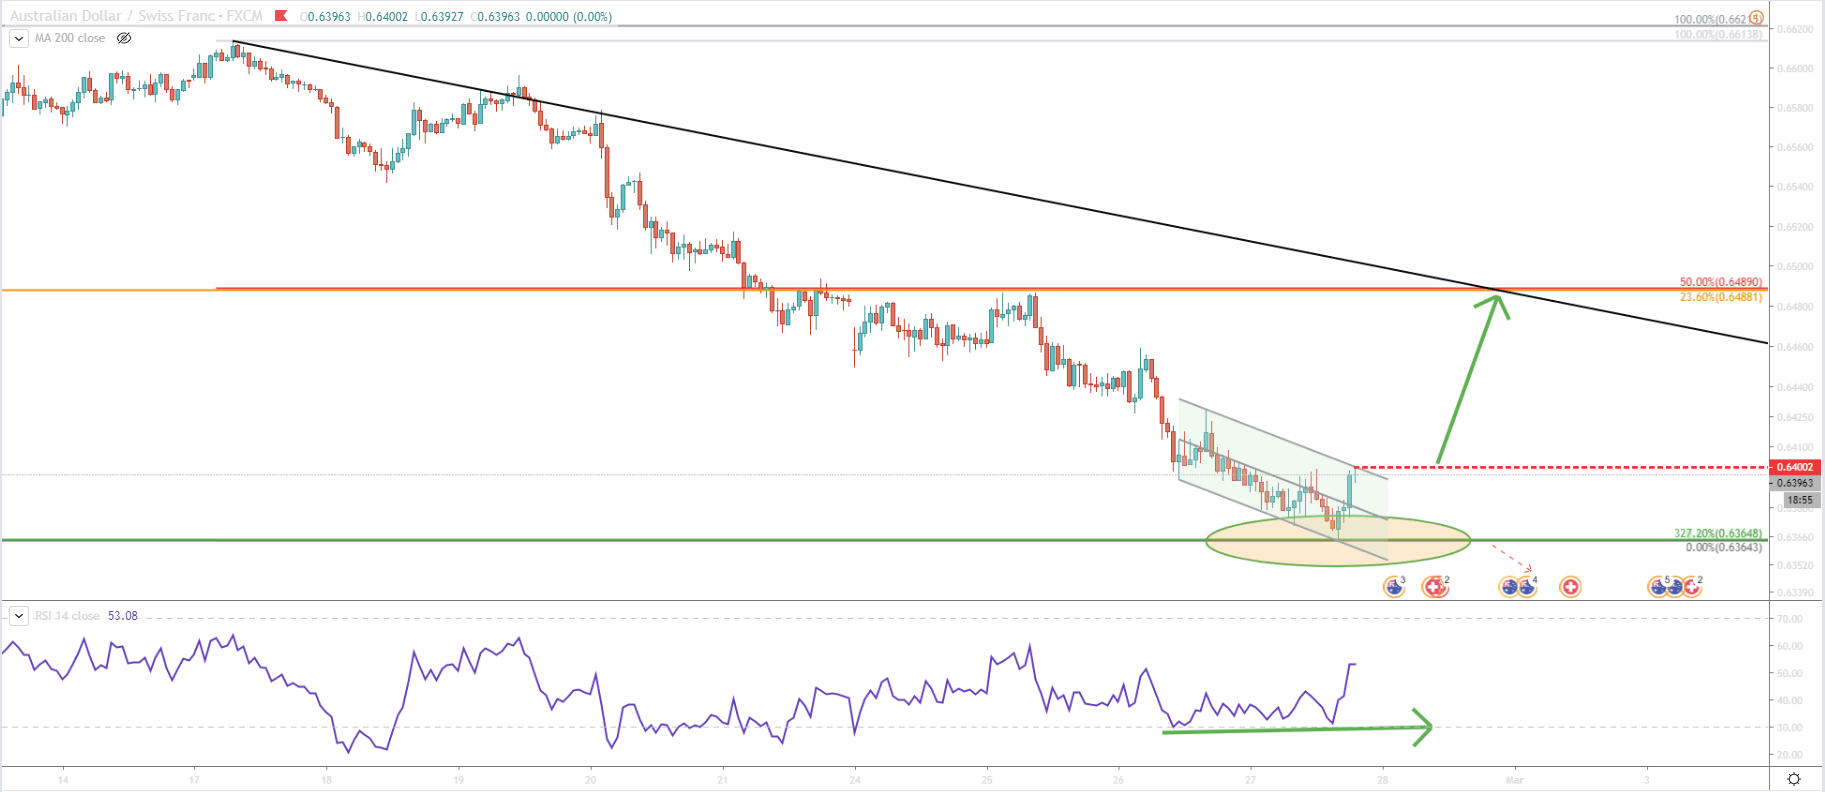
But here comes a 1H chart, where we can see that AUD/CHF rejected the upper trendline of the descending channel. Clearly there is a resistance, and for the price to start moving higher, we must see an hourly break and close above the channel, or 0.6400 psychological resistance.
Such break above should initiate an impulsive wave up, and the price could reach 0.6490 area within 48 hours. The safest way is to wait for this breakout and then buying opportunity can present itself on a small correction down.
AUD/CHF is potentially ending the phase of the downtrend because currently there is the 5th wave down could be coming to an end. This is because of the reaction of the Fibonacci support. For the price to move higher, the descending channel on the 1H chart must be broken with an hourly break and close above. Prior to that, the price can consolidate between 0.6363 support and 0.6400 resistance.
As soon as AUD/CHD breaks above the channel, the next resistance is seen as high as 0.6488, which is confirmed by two Fibonacci retracement levels as well as the downtrend trendline. I should be a key level, to show if long term downtrend is ended or if rejected, we are yet to see new lower lows.
We can not stress enough that the trend is heavily bearish. Price still remains below the descending channel. If AUD/CHF will go below 0.6363 support, it will result in the continuation of the 5th wave and can bring price much lower.
Support: 0.6363
Resistance: 0.6400, 0.6488


