
Published: February 18th, 2021
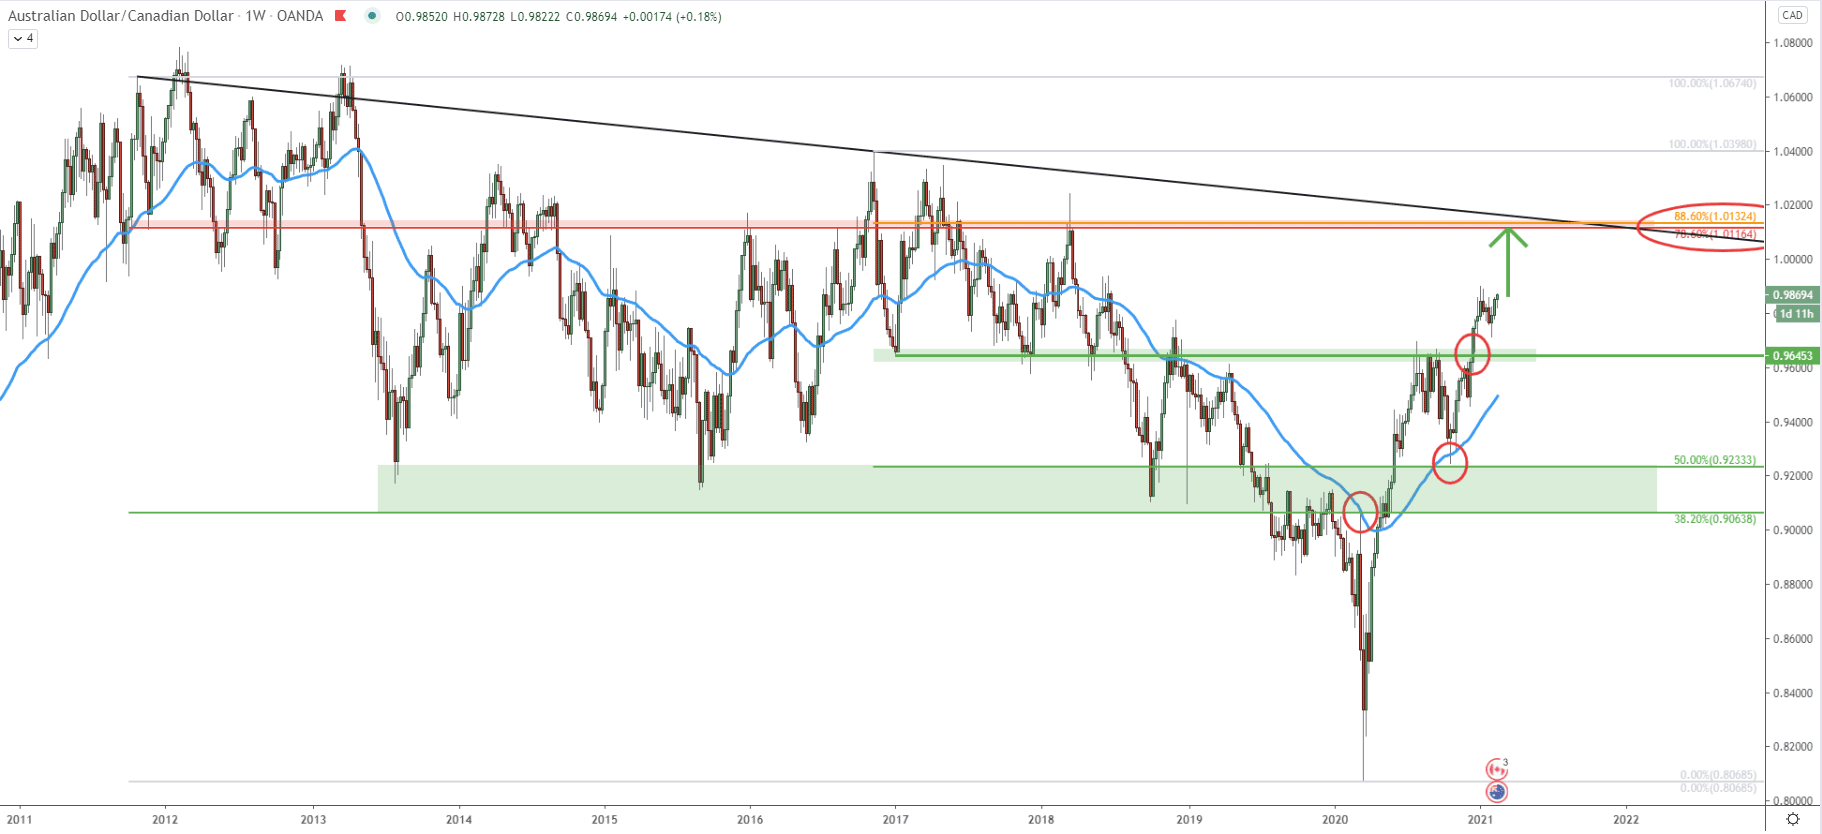
The AUD/USD price has been on a steady rise since the beginning of 2020. In one year price has increased by 1800 pips, while moving from the 0.8068 low, up until the current price, which is 0.9870. This was a very fast recovery, showing a strong dominance of the Australian Dollar over the Canadian Dollar. Obviously, it would be very unreasonable to try trading against the trend, because it is the same as catching a falling knife.
In such scenarios, the probability is clearly in favor of an uptrend continuation, especially considering the recent break above the 0.9645 resistance area. Previously, it was a strong supply/demand zone and the price just sliced through without any hesitation. It shows an enormous buying pressure, which might send the price up to the 1.0110 resistance area.
This resistance corresponds to two Fibonacci retracement levels as well as the simple downtrend trendline, making it a very attractive profit-taking area. This means that the price is yet to increase by over 250 pips in the coming weeks.
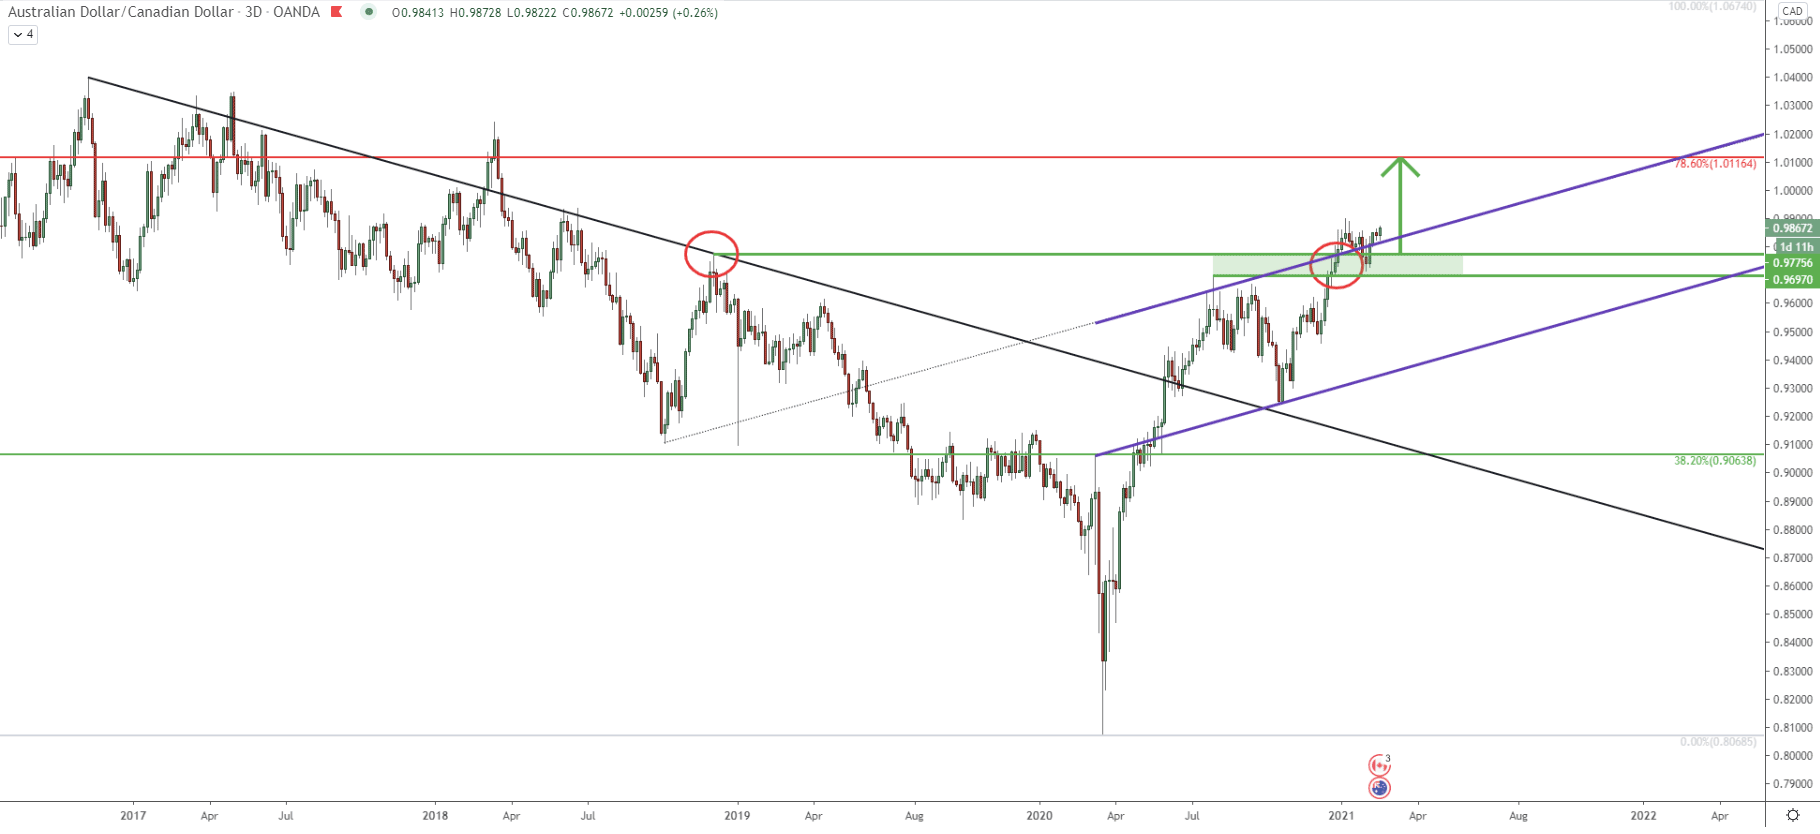
The downtrend trendline got broken after which price has been trending up within the ascending channel. However, the top of the channel, along with the resistance at 0.9775 was recently broken, suggesting a further price increase. The support zone is formed between 0.9700 - 0.9775, which will certainly be of interest to the buyers if the price will pull back down. But we must consider that right now, AUD/CAD is bouncing off the upper trendline of the ascending channel, which is acting as the support. And this brings us to the conclusion, that there might not be any strong downside move and the trend will remain strongly bullish during this and next week.
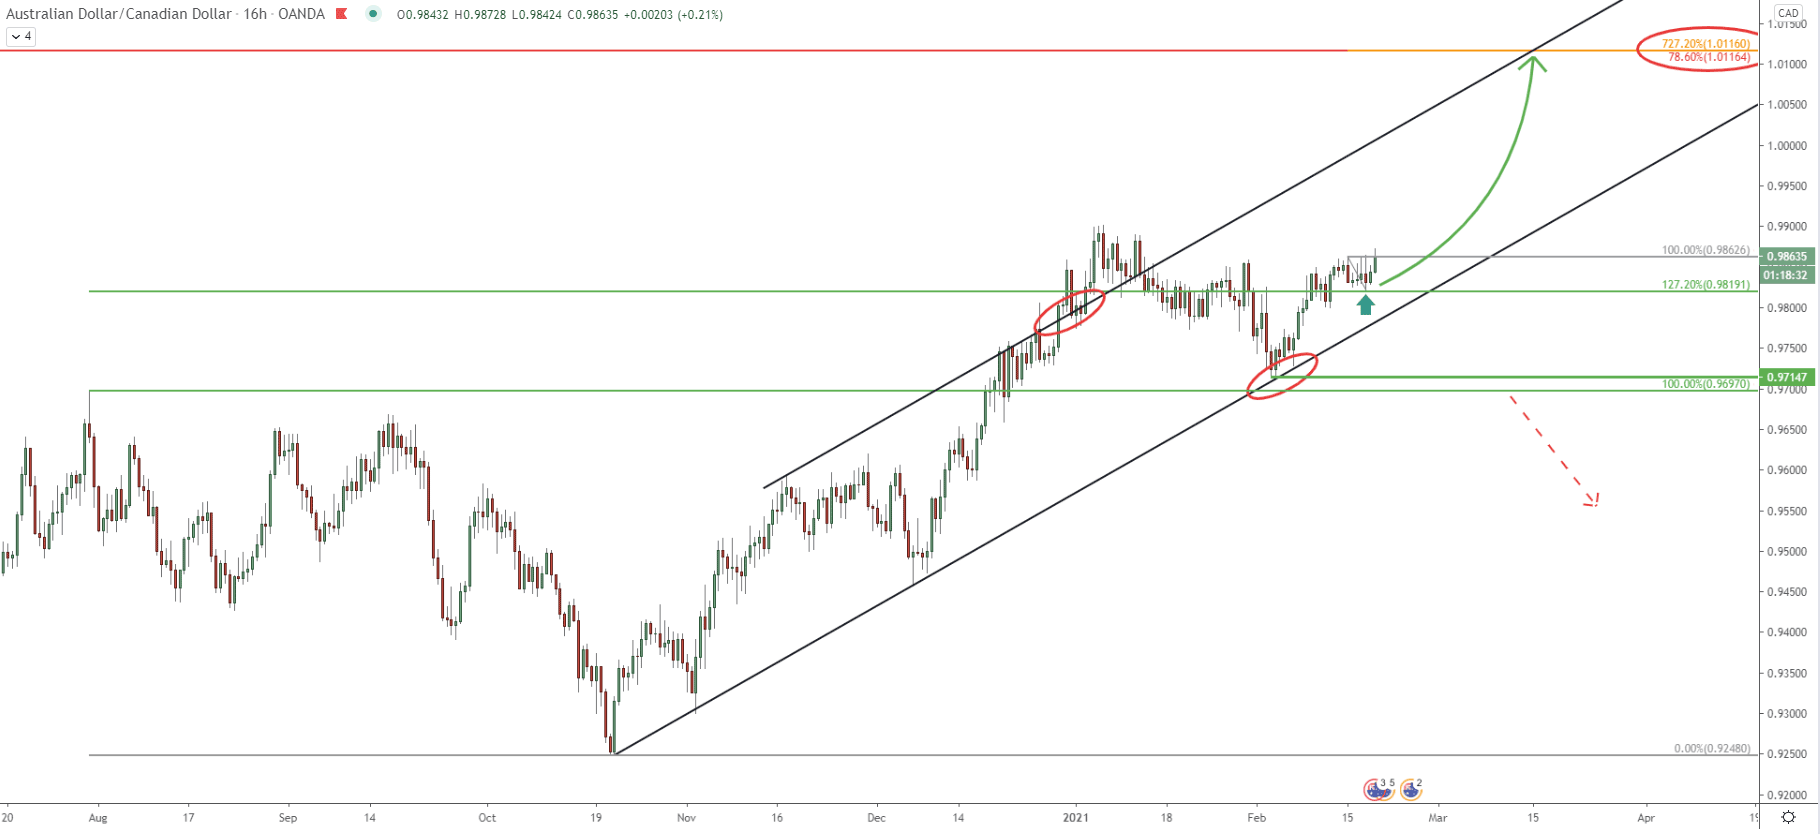
On the 16-hour chart, yet another ascending channel has been formed. And again we can see that the top of the channel has been broken, after which the price corrected down. On the correction, the uptrend trendline got rejected, as well as the 0.9700 psychological support area. Yesterday, AUD/CAD had a small pullback, where the price bounced off the 127.2% Fibonacci support at 0.9819. It was a very clean bounce, implying the continuation of an uptrend. Fibs, applied to that pullback, show that the 727.2% retracement level, corresponds exactly to the 78.6% Fibs as per the weekly chart. And it seems like 1.0116, could be the prices price for the bulls to fix profit. Obviously, there can be a break to the upside when/if this resistance is tested. And in that case, the uptrend might be extended much further.
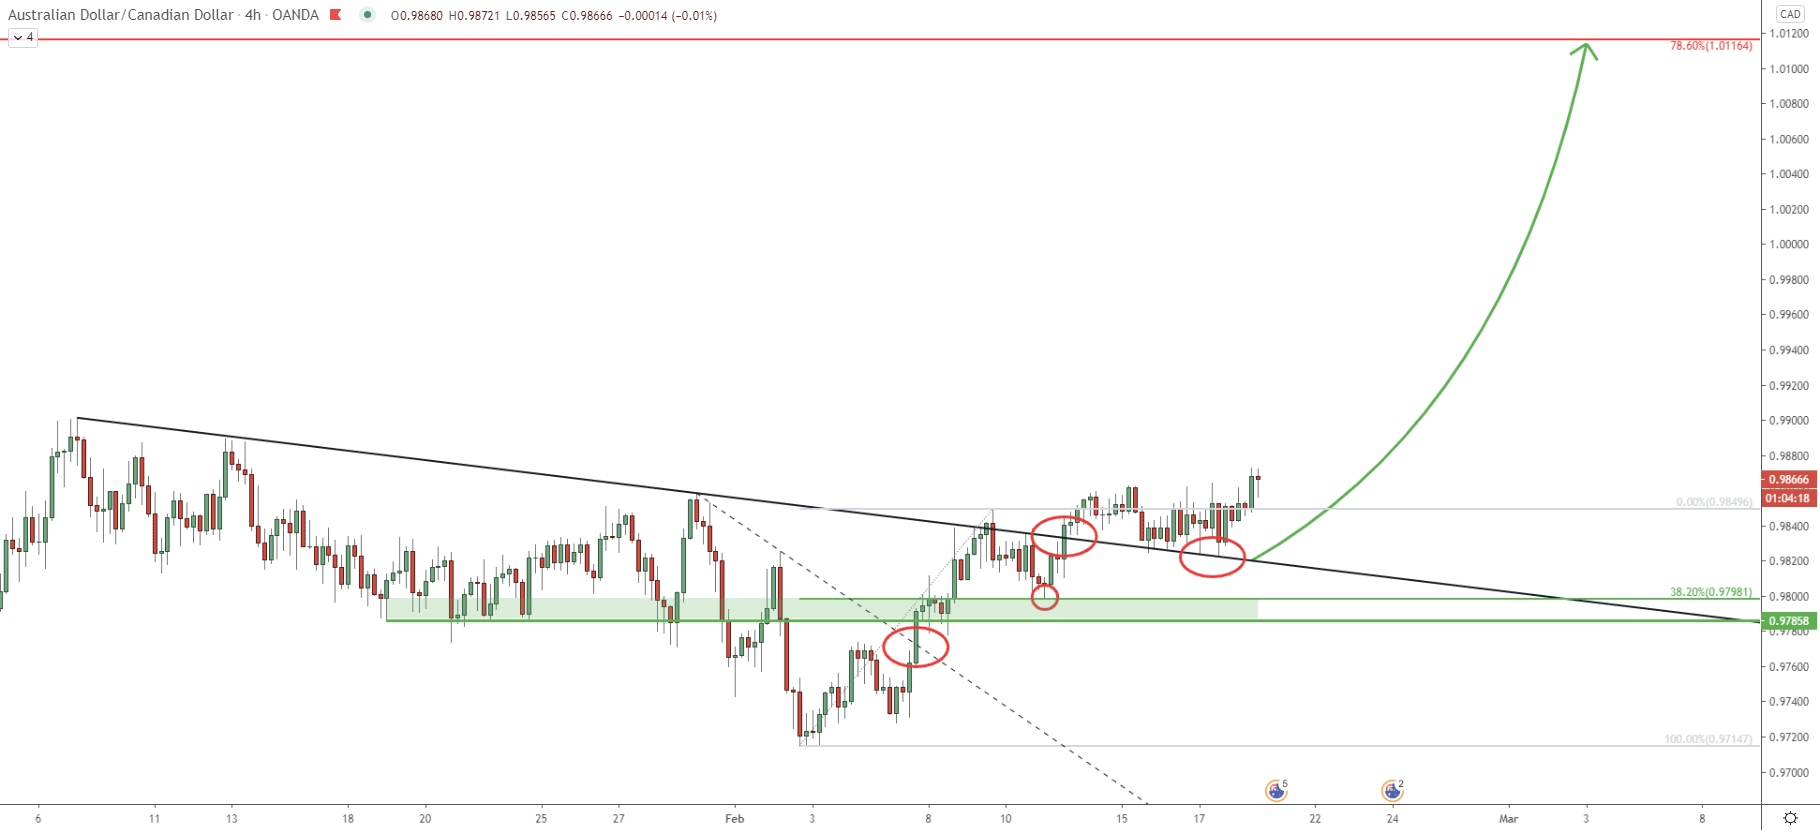
On the 4-hour timeframe, price broke above two downtrend trendlines, the minor and the major one. At the same time price roke above the strong resistance area near 0.9800 psychological level, which is confirmed by 38.2% Fibonacci retracement. Upon the corrective move down, the 38.2% Fibonacci support got rejected precisely, after which price produced a new higher high. Finally, there was a bounce off the downtrend trendline, which has acted as the support, providing another confirmation of the strong bullish momentum.
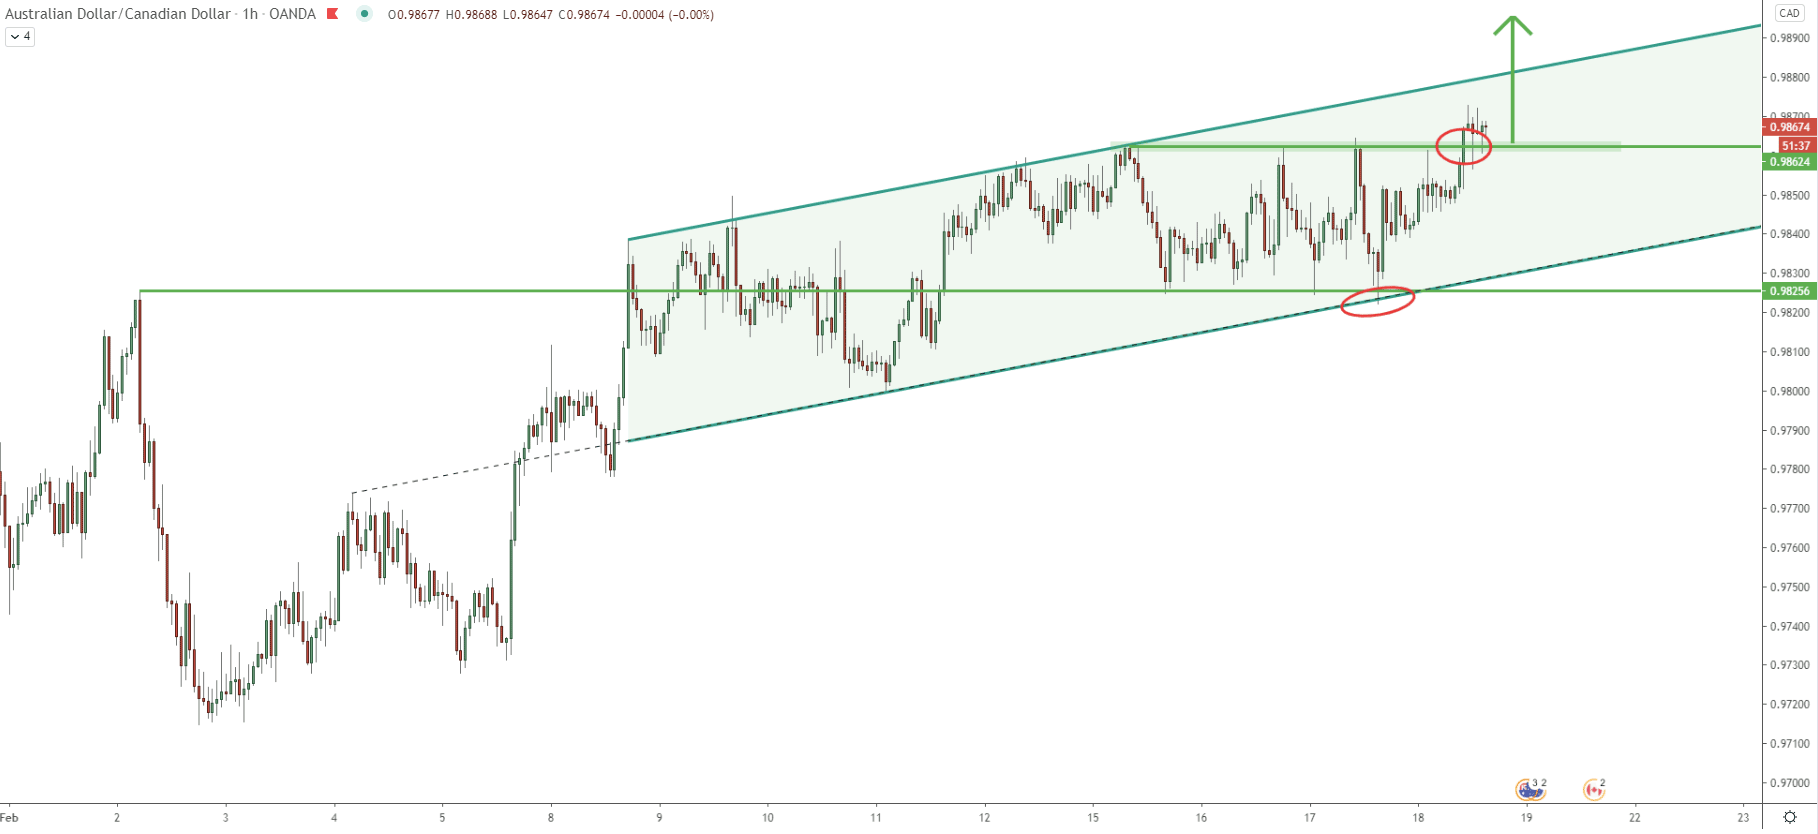
Even on the hourly chart, there is an ascending channel. But this time, the price still hasn’t broken above it. Right now, buyers could be waiting for this breakout, in order to step in. Prior to that, range trading might be taking place, while the price is expected to consolidate around the 0.9860 support area. This support is currently being respected, although attempts to break lower might happen. Most importantly, for the uptrend to continue, the price must not break below the uptrend trendline. And while it remains above, bulls are likely to seek any sort of downside moves, to get the best risk/reward buying opportunity.
AUD/CAD trend is heavily bullish and any sort of a downside correction might result in a strong rally as buyers are likely to seek a good buying opportunity. As a result, the price can continue rising by another 250 pips in the coming weeks.
As per the weekly and 16-hour chart, the key resistance and the potential upside target is at 1.0116. This price is confirmed by 3 different Fibonacci retracement levels, making it extremely important, for buyers as well as sellers in the medium to long term.
As per the 16-hour chart, the key support area is located near 0.9700 psychological level. Break below will immediately invalidate bullish outlook, and in such a scenario, a change in trend should be expected. Bears are likely to gradually start taking control, while the price might consolidate for some time, before moving down.
Support: 0.9700, 0.9820
Resistance: 1.0000, 1.0116


