Published: February 27th, 2024
AstraZeneca expected to disclose quarterly earnings of $0.88 per share, reflecting an 8.3% decline compared to last year. The current consensus earnings projection for the current fiscal year is $4.07 per share, signifying a growth of 12.1% compared to the previous year.
Anticipating the forthcoming fiscal year, the prevailing consensus earnings forecast stands at $4.97 per share, signifying a significant surge of 22%. However, this estimation has declined by 4.8% over the previous month.
Although earnings growth is commonly regarded as the principal indicator of financial health, revenue growth holds equal significance. Long-term revenue expansion is significantly correlated with sustainable earnings growth.
The consensus sales estimate for the current quarter at AstraZeneca is $12.08 billion, representing an 11.1% year-over-year increase. The projected amounts for the current and subsequent fiscal years are $55.2 billion and $51 billion, reflecting respective increases of 8.2% and 11.3%.
During the most recent quarterly report, AstraZeneca generated revenues amounting to $12.02 billion, reflecting a growth of 7.3% annually. EPS increased to $0.73 from $0.69 compared to last year's period.
In the preceding four quarters, AstraZeneca has outperformed revenue and earnings per share (EPS) estimates by a factor of three.
Let's see the upcoming price direction from the AZN technical analysis:
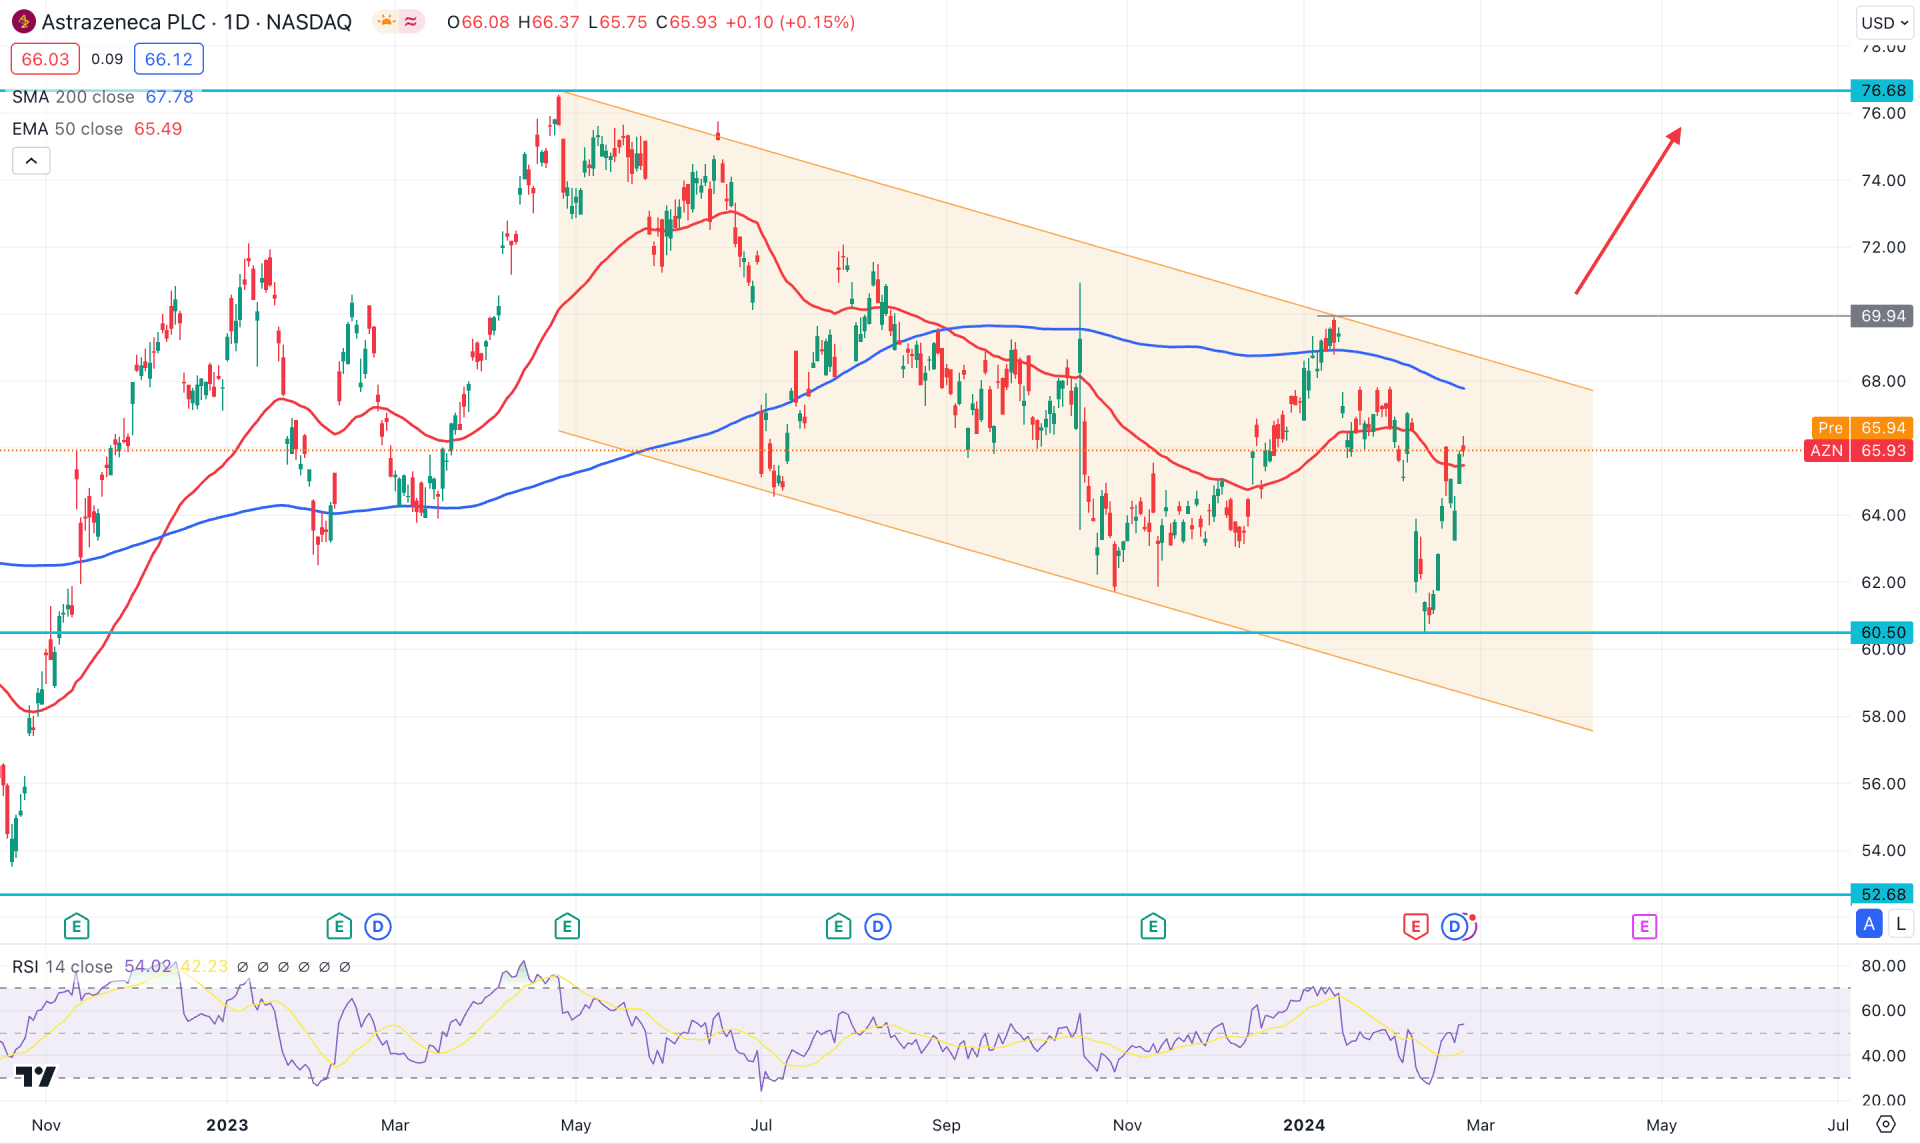
In the daily chart of AZN, the overall market momentum is corrective. A bullish breakout is possible from the channel formation, while significant dynamic levels are above the current price. Investors need more clues from the higher timeframe as the broader context looks mixed.
In the monthly candlestick pattern, the running candle suggests a bullish fakey formation within a broader bullish trend. A successful close as a Hammer could signal a strong bullish possibility, which could be an early sign of the possible flag pattern breakout. The weekly price shows the same story, where a sell-side liquidity sweep is present from the 61.76 level.
Coming to the daily price action. The recent price hovers below the 200-day Simple Moving Average, which acts as a major barrier for bulls. Moreover, the 50-day EMA is closer to the price, with a daily candle present above this line.
In the secondary window, the 14-day Relative Strength Index shows a strong rebound from the 30.00 line and made a strong position above the 50.00 neutral point.
Based on the daily outlook, the conservative long approach is to wait for a valid flag pattern breakout before anticipating the monthly candle continuation. In that case, a daily close above the 200-day SMA could work as a confluence bullish signal, eliminating the possibility of death cross continuation. On the upper side, the 69.94 level could be a crucial point to look at, as buying pressure above this level could extend the momentum above the 80.00 area.
On the bearish side, the 200-day SMA is the major resistance. Therefore, selling pressure from this area with a daily close below the 50-day EMA coil extends the channel. In that case, a downside pressure might come, targeting the 52.68 static support level.
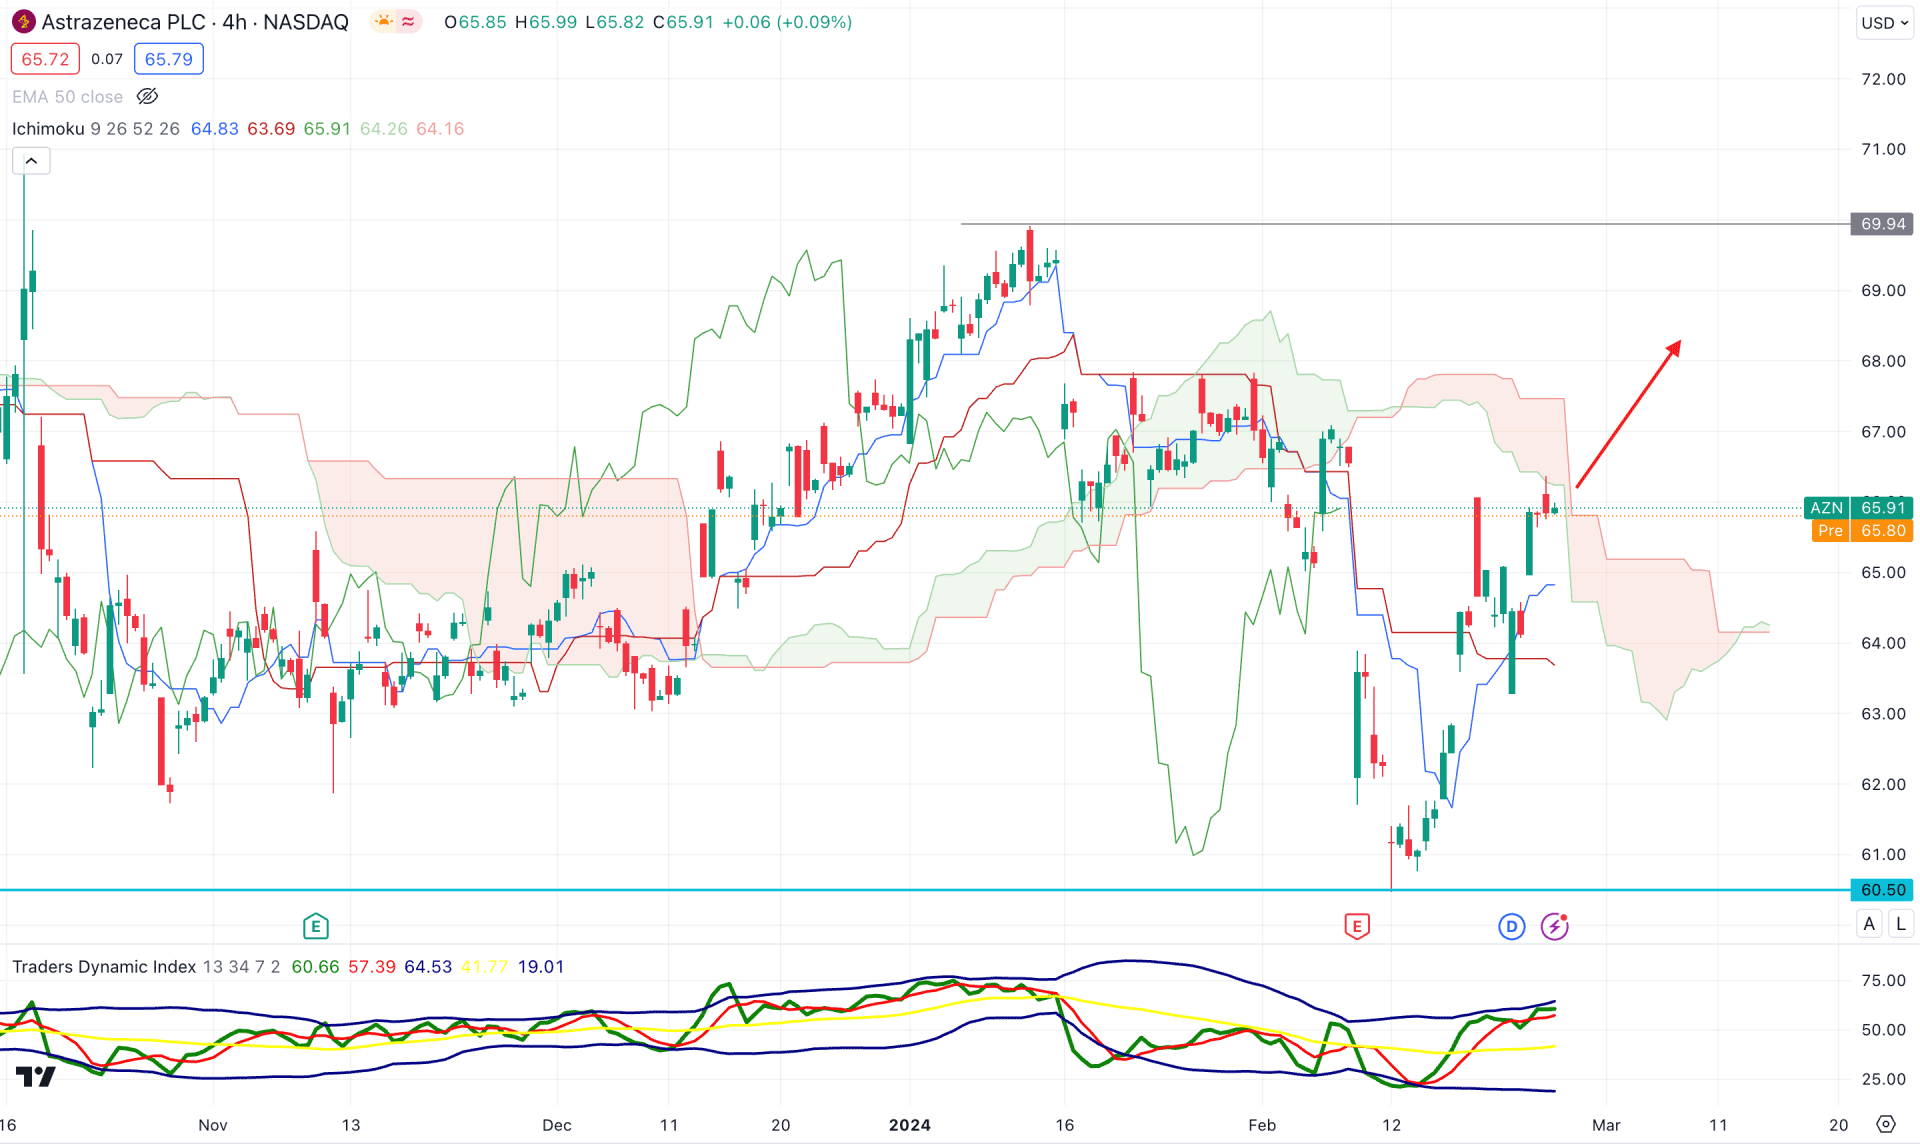
In the H4 timeframe, the recent price formed a bottom at the 60.50 level from where a V-shape recovery has come. Moreover, the future cloud has shifted the direction where the current Senkou Span A is above the Senkou Span B. A bullish crossover is visible among dynamic lines, while the Chikou Span is yet to form a breakout.
In the indicator window, the current Traders Dynamic Index (TDI) is above the neutral line, suggesting buyers' presence in the market.
Based on the H4 price structure, a bullish H4 candle above the dynamic Cloud could be a potential long opportunity, which may extend the upward pressure in the coming days. The primary outlook for this pair is to test the 69.94 resistance level before reaching the 80.00 psychological line.
On the bearish side, an immediate reversal with a stable downside pressure below the Kijun Sen line could be a bearish continuation signal, targeting the 60.00 level.
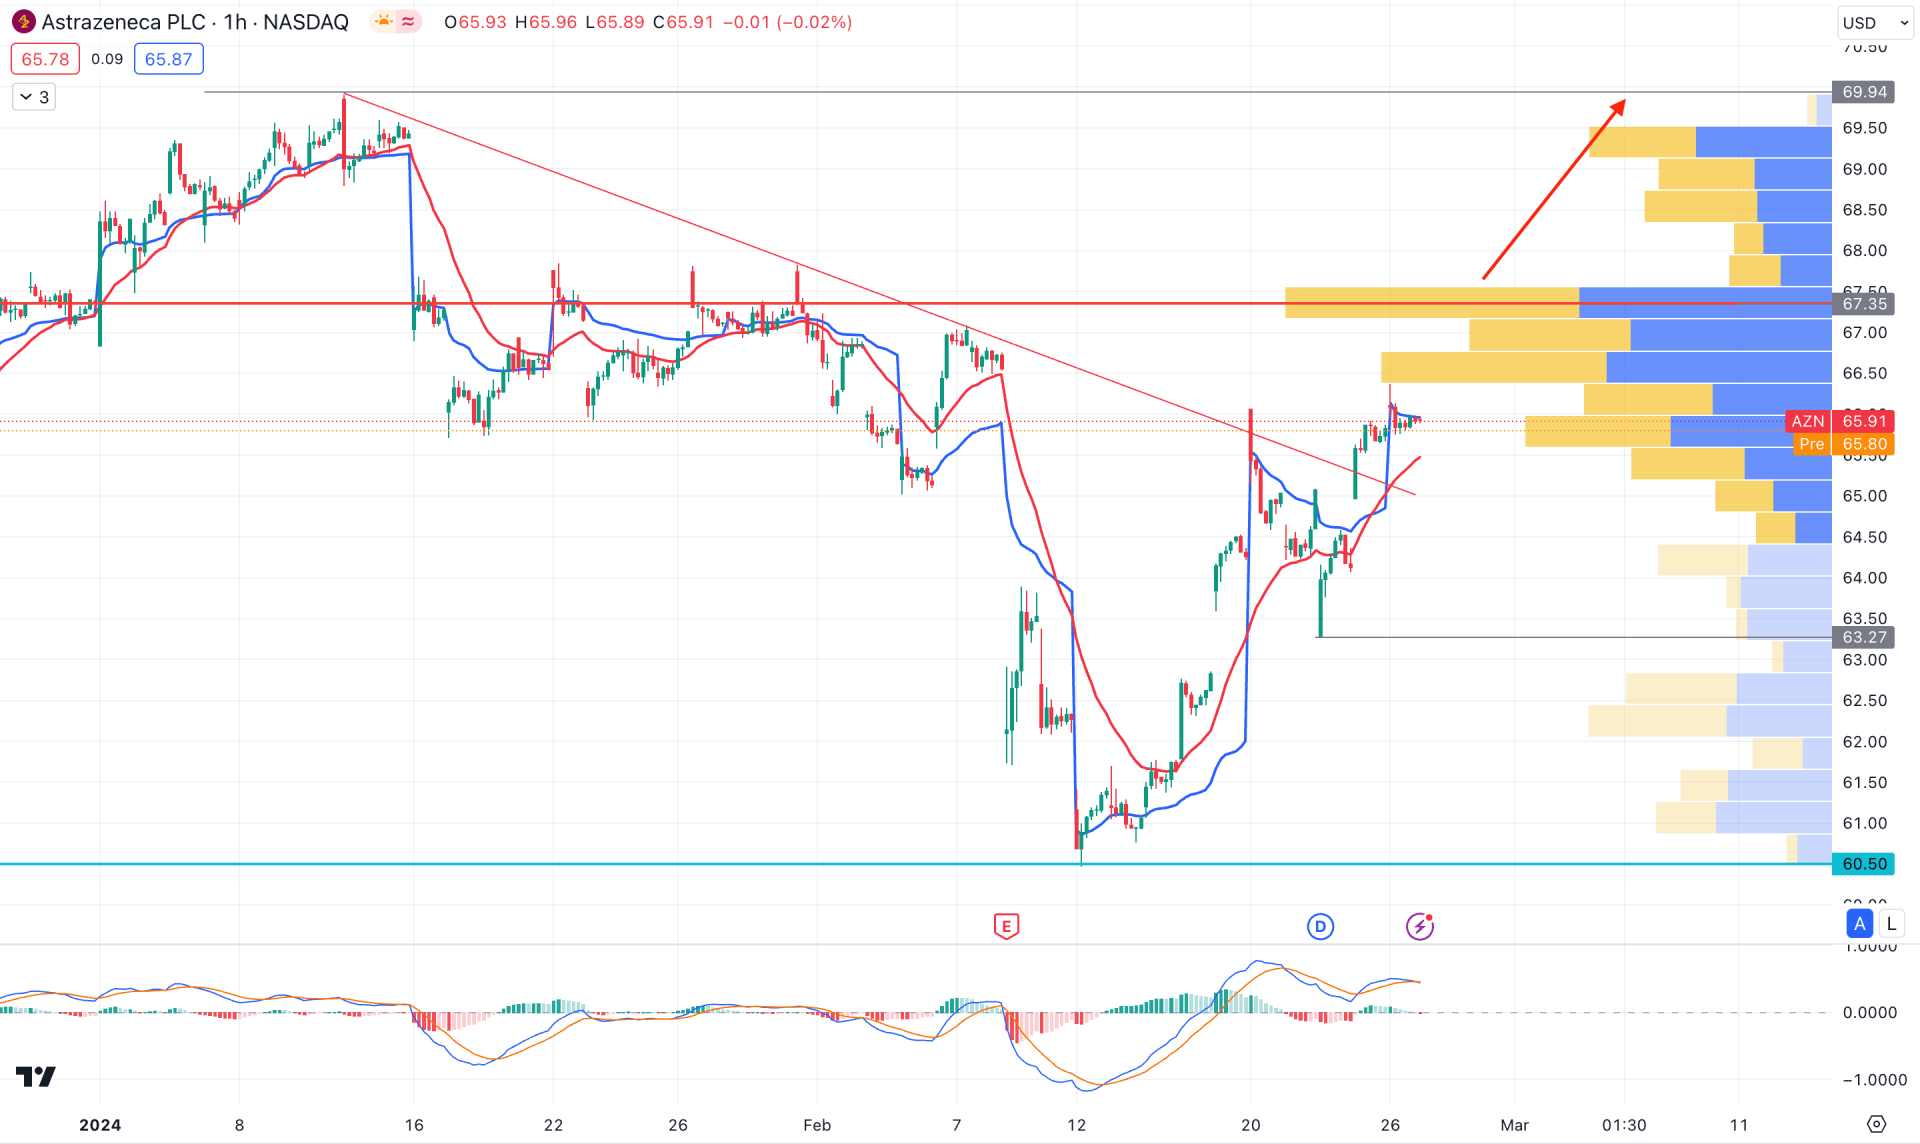
In the H1 timeframe, the current price trades above the dynamic 20 EMA and weekly VWAP level, suggesting a strong bullish momentum. However, the latest visible range high volume level is at 67.35 level, which is above the current area.
In the indicator window, the MACD Histogram is neutral, while the signal line holds the momentum above at the bullish zone.
Based on this structure, investors should closely monitor how the price reacts at the high volume level. A successful breakout with an H4 candle above the 68.00 level could be an early long opportunity. However, a bearish recovery with a stable bearish pressure below the 64.00 area could be a bearish continuation signal, targeting the 60.00 level.
Based on the current market structure, AZN has a higher possibility of forming a bullish impulsive trend after breaking out from the ongoing channel. In that case, investors should closely monitor how the price reacts to the channel resistance and dynamic 200-day SMA. An early buying opportunity is also visible from the hourly price action.


