Published: April 9th, 2024
Arweave reached its highest point in eighteen months in February 2024 amidst notable expansion on its platform. Achieving three billion transactions on its blockchain, Arweave, a decentralized storage platform that enables users to securely store, exchange, and retrieve data files in any format.
Arweave differentiates itself in the data storage industry by providing permanent solutions tailored to decentralized applications (dApps). Its PermaWeb infrastructure, which can store data for two centuries, has garnered interest in numerous initiatives spanning various blockchain networks. Significantly, the token underwent considerable expansion, quadrupling its value since mid-February.
Arweave, positioned as a decentralized storage network dedicated to the perpetual preservation of data, defines itself as "a hard drive that is owned collectively and never forgets." The platform predominantly accommodates "the permaweb," an extensive collection of community-driven applications and platforms organized decentralized.
A hyper-parallel computer is imminently integrated into the Arweave ecosystem, which holds the potential to transform blockchain operations fundamentally. This novel system enables concurrent transactions, thereby augmenting processing speed and furnishing the capability of transient storage. Arweave has established itself as a prominent cryptocurrency coin within the file-sharing industry, and its momentum has continued to grow throughout the month of February.
On the contrary, after a fleeting upward trend, AR underwent a correctionary phase that lasted the entire month of March, culminating in a substantial decline of 21.5% in the last week of the month.
Let's see the upcoming price direction of this token from the AR/USDT technical analysis:
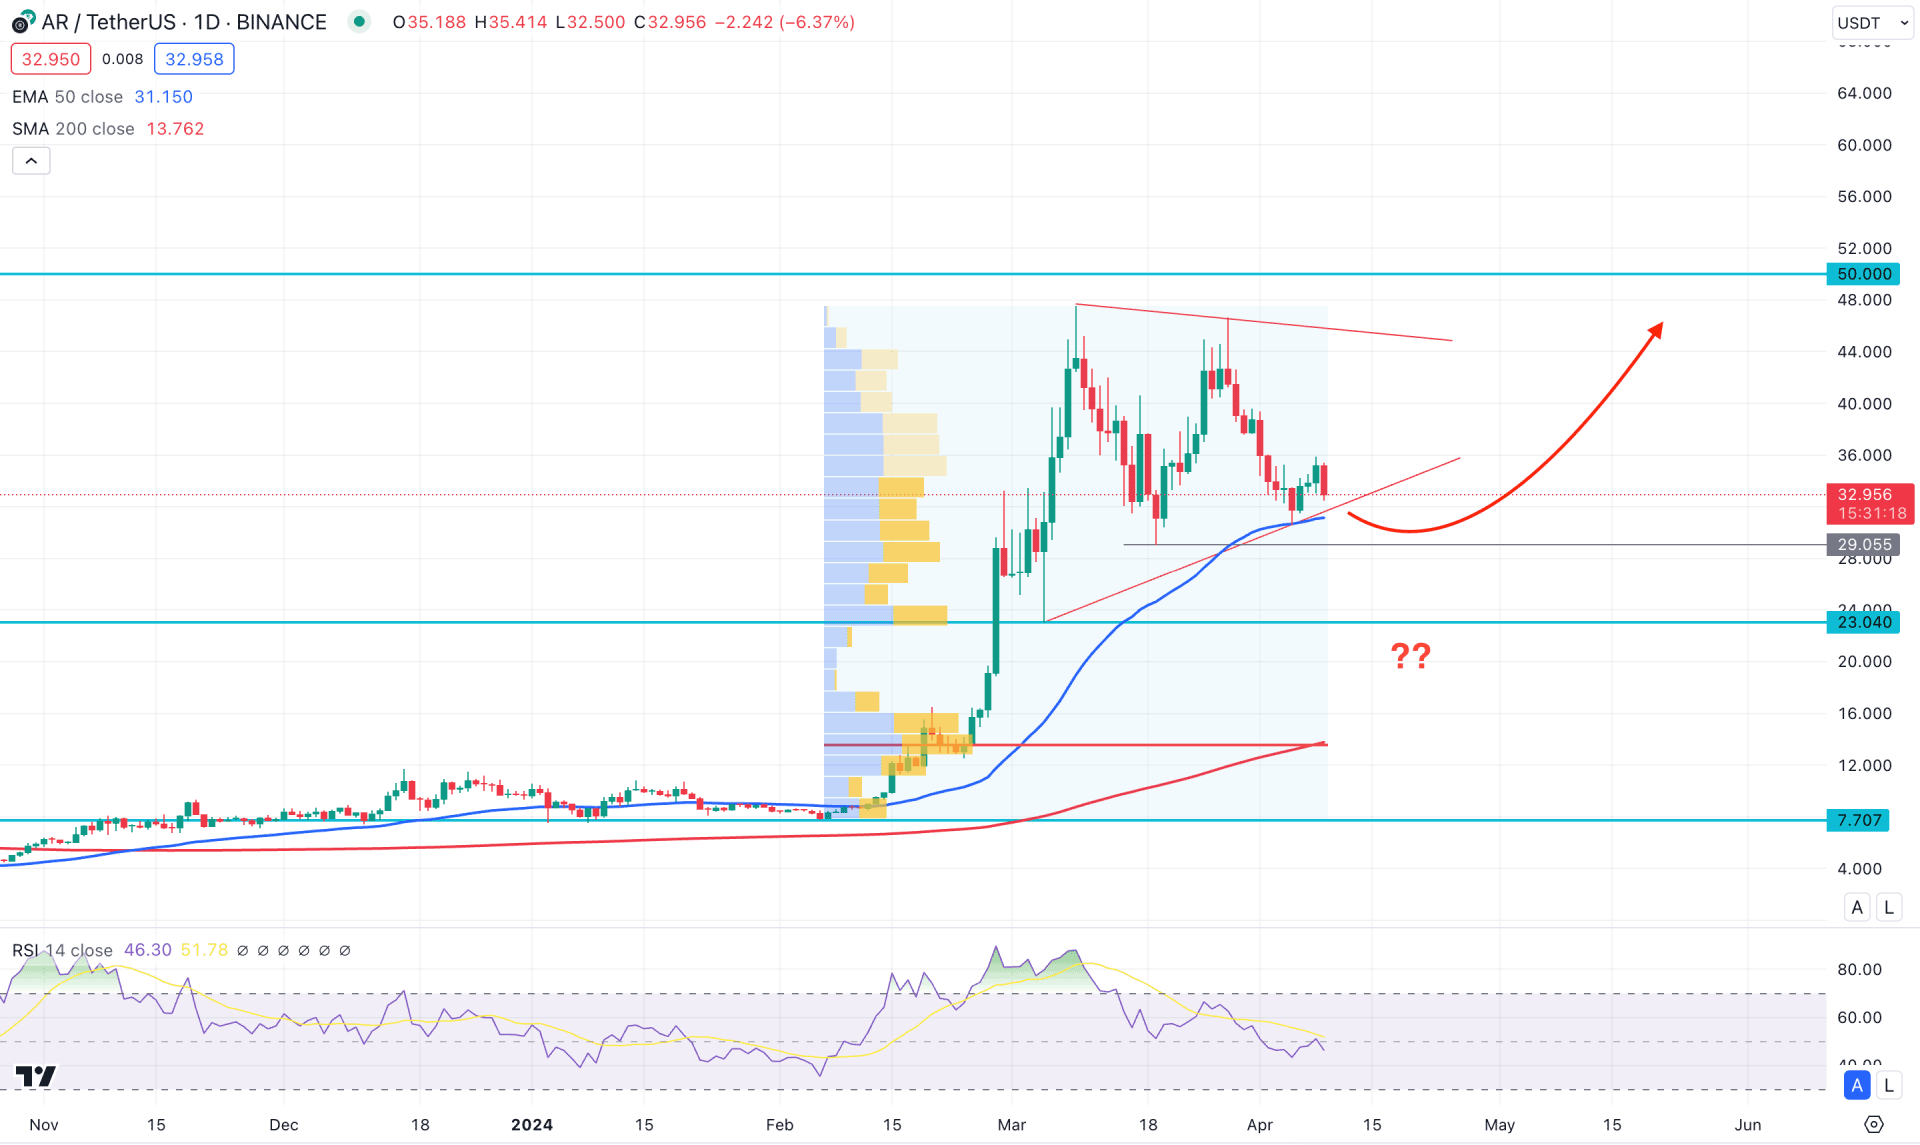
In the daily chart of AR/USDT, prolonged buying pressure was found to be at a ceiling at the 47.39 level, where downside pressure is visible. However, the Pump and Dump scheme failed as bears failed to form bearish exhaustion from the top. In this context, we may consider the buying pressure valid, which might create a long opportunity once the downside correction is over.
In the higher timeframe, the monthly candle suggests a bullish continuation as the current price remains within an existing bullish continuation. Moreover, the weekly price suggests a higher volatility as recent candles showed an indecision. In this context, investors should monitor how the price reacts to the weekly support, from which a sell-side liquidity sweep could signal a monthly trend continuation.
In the volume structure, the most active level since February 2024 is at 13.60 level, which is way below the current price. As the recent price hovers above this crucial line, we may expect an upward signal after completing the downside correction.
In the daily structure, a corrective momentum is seen within a triangle formation, where the most recent price hovers above the trendline support. Moreover, the 29.05 static support level is still protected with a bullish slope in the dynamic 50 day EMA.
Based on the daily market outlook of AR/USDT, more downside pressure is pending before forming a bullish signal. Any bullish rejection from the 29.00 to 23.00 zone with a valid daily close could be a potential long opportunity, targeting the 50.00 level.
The alternative trading approach is to seek short opportunities after having a bearish close below the 23.00 line with a consolidation.
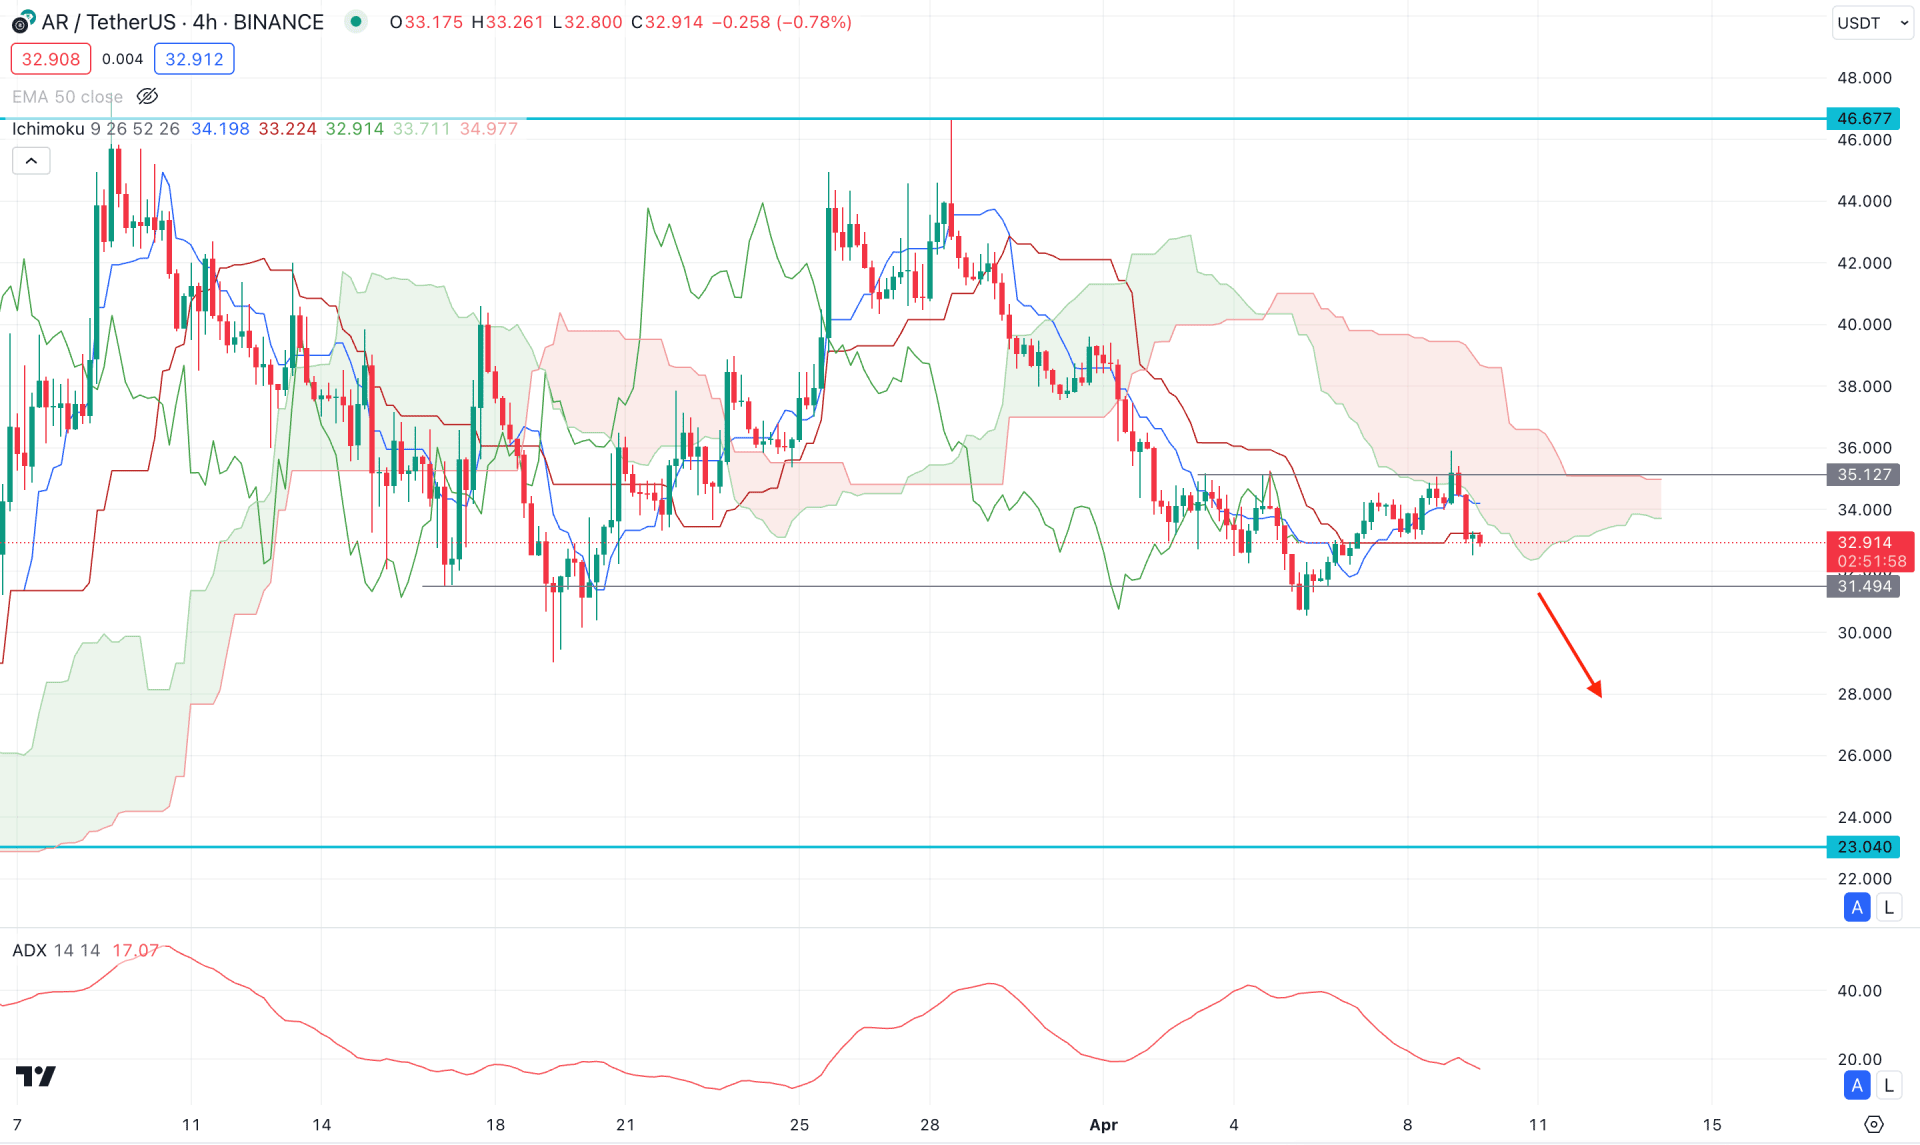
In the H4 timeframe, the bearish trend is strong as the current price hovers below the Ichimoku Kumo Cloud. Moreover, a sufficient bullish correction is present with a buy-side liquidity sweep at the 35.12 resistance level.
In the future cloud, the downside pressure will be potent as the Senkou Span A is below the Senkou Span B, followed by a bearish H4 close below the dynamic Kijun Sen line.
Based on this outlook, a bearish trend continuation is potent, where an H4 close below the 31.49 level could activate the conservative bearish opportunity in this pair.
On the bullish side, an immediate bullish reversal is potent, where a valid buying signal above the 36.00 static line could indicate a cloud breakout, targeting the 45.00 area.
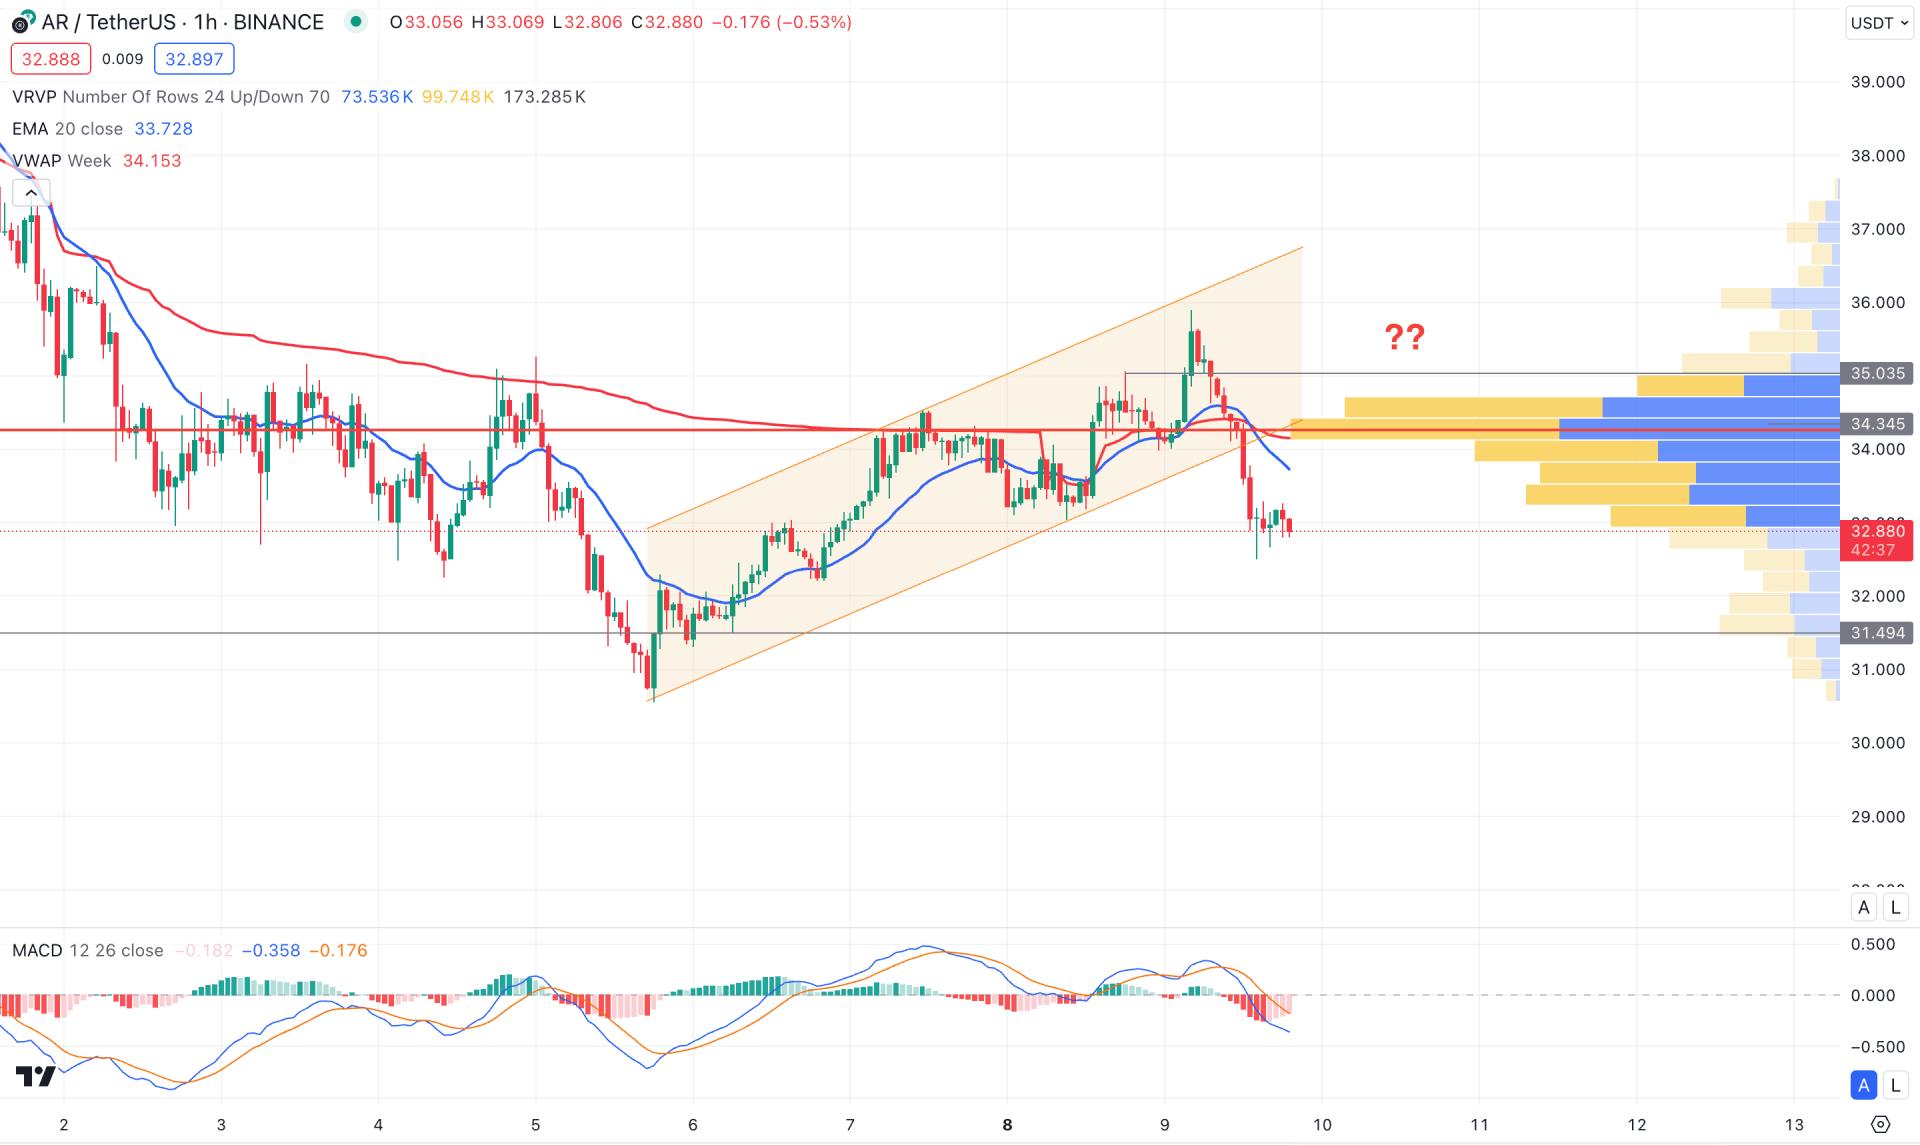
In the hourly time frame, the overall market pressure is beamish as the current price hovers below the ascending channel support. Moreover, the dynamic 20 EMA is above the current price with a bearish slope, suggesting a confluence bearish signal. The visible range high volume level is above the current price, working as a major resistance at the 34.35 level.
In the indicator window, the MACD Histogram hovers below the neutral line, while the Single line is at the negative zone.
Based on the hourly outlook, a downside continuation is potent in this pair, where the main aim is to test the 29.00 psychological line. On the other hand, a bullish rebound is possible, where a stable market above the 36.00 psychological line could be a long opportunity, as shown in the H4 chart.
Based on the current multi-timeframe analysis, ARTUSDT is more likely to provide a bullish continuation signal after having a valid breakout from the daily triangle formation. However, an early bullish sign might come from the H4 chart with a bullish exhaustion.


