Published: November 6th, 2024
Since most investors seek rising profit levels, nothing is more significant than revenue growth. A double-digit rise in earnings is very desirable for prospective investors because it is frequently seen as a sign of promising futures for the company in question.
Investors should concentrate on the anticipated growth even though Arista Networks' past EPS growth rate is 34.1%. This year, the company's earnings per share (EPS) is predicted to grow 19.4%, exceeding the industry average of 16.9%.
Arista Networks' revenue growth over the past year is 47.4%, which is greater than that of many of its competitors. The rate is comparable to the -18.7% industry average.
Although the current revenue growth should be the primary consideration for investors, it is also worthwhile to examine the historical growth rate to contextualize the current reading properly. Over the last three to five years, the company's yearly revenue growth rate has been 27.1%, which is higher than the sector's average of -1%.
Overall, empirical evidence shows that trends in revenue estimate modifications and short-term stock price actions are strongly correlated. Therefore, we might find a decent trading opportunity in ANET from the technical analysis.

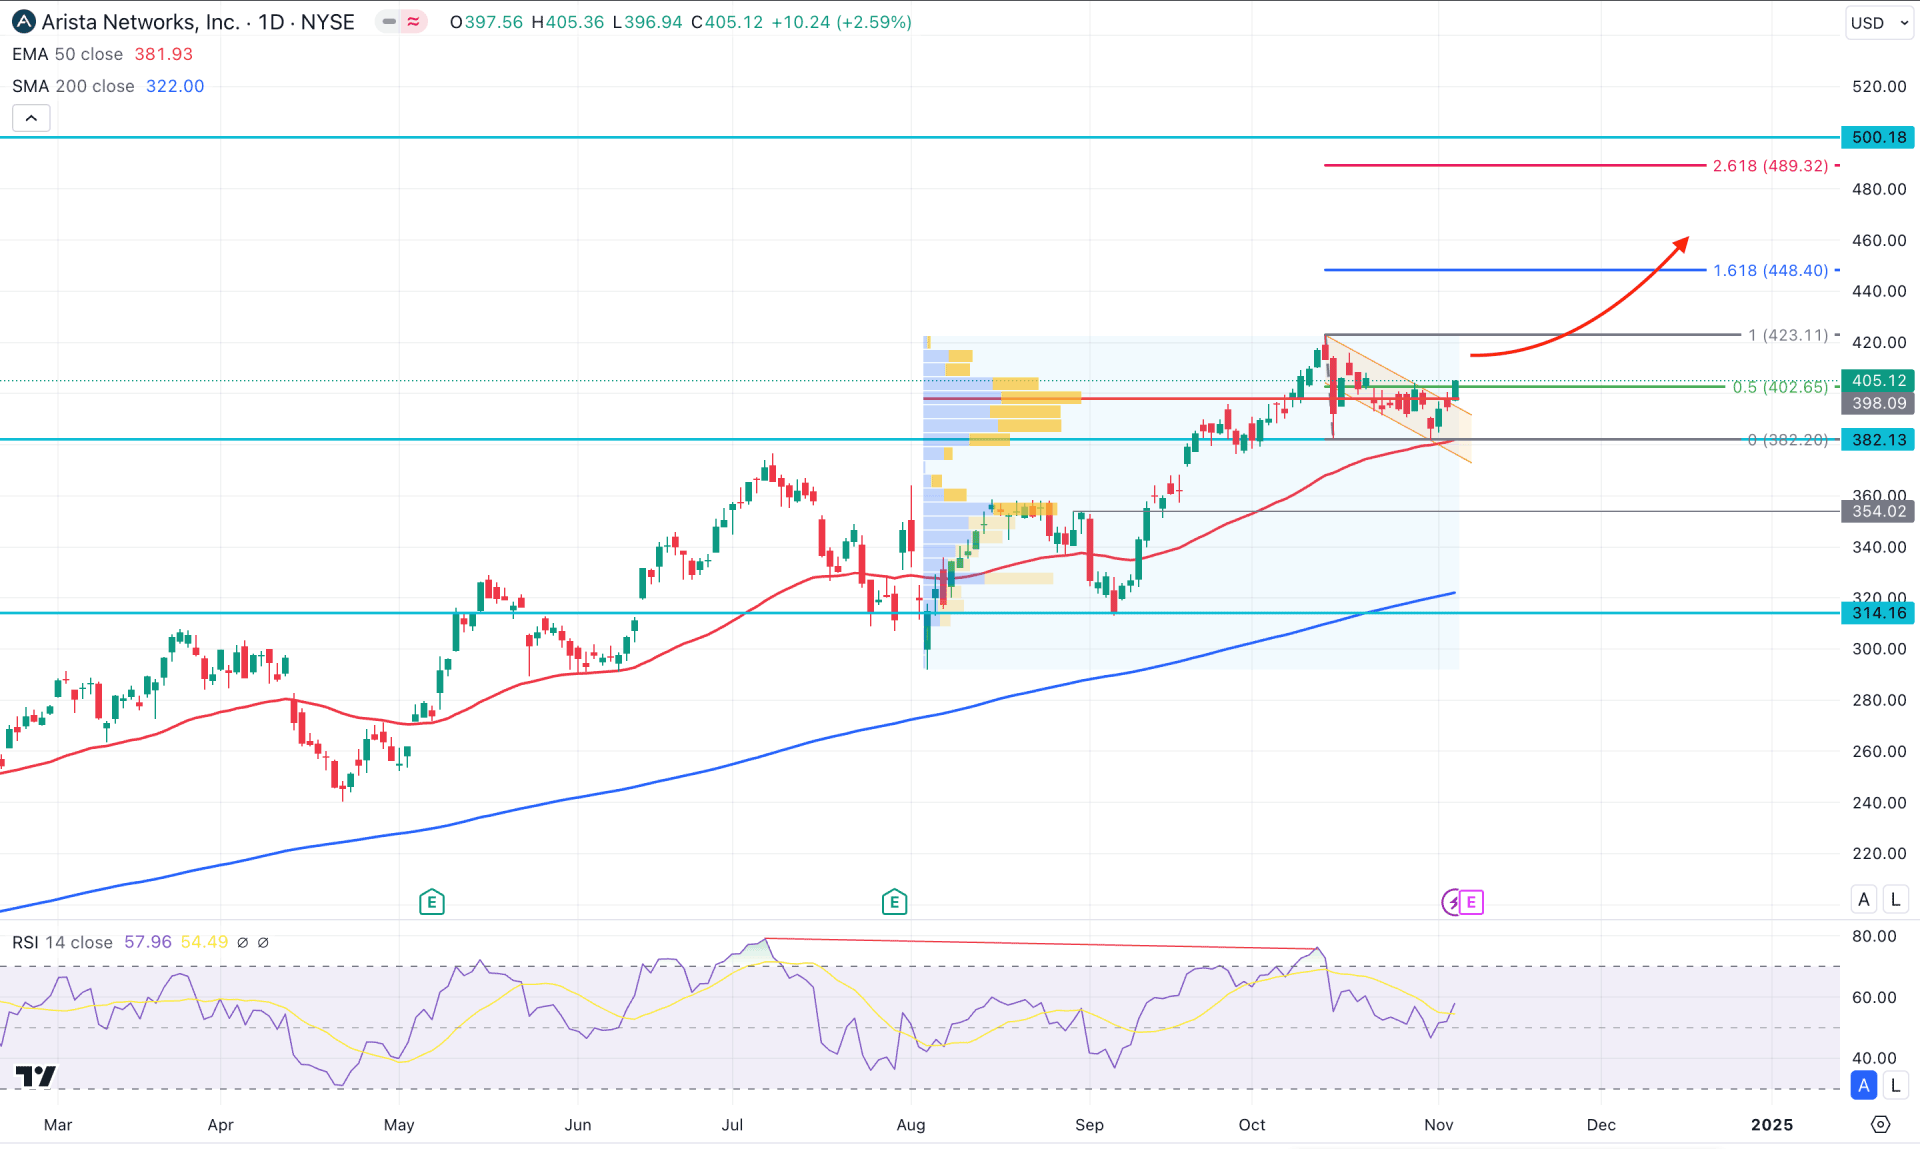
In the daily chart of ANET, a stable bullish trend is visible as the price has been moving higher since its inception. Also, the price has already provided an 85% gain this year, while the current price is trading with a 77% gain before the earnings report release.
Looking at the higher timeframe, the October 2024 close was potential for sellers as the monthly close came as a Shooting Star candlestick. As the current price is still trading above the October low, investors might consider it as a bullish continuation. Moreover, the recent weekly price is trading higher as the current price hovers above the multi-week high.
In the volume structure, the most recent daily candle is trading above the high volume line, suggesting a bullish accumulation within the descending channel.
In the main chart, the 200-day Simple Moving Average is below the September 2024 low, which signals a major support. Primarily, investors might consider the major market trend as bullish as long as the 200-day SMA is below the current price. The 50-day EMA is closer to the current price and is working as an immediate support. As both dynamic lines are below the current price, a Golden Cross continuation might work as a trend trading opportunity.
Based on the daily chart of ANET, the immediate buying is visible as the current price hovers above the channel resistance. It is a sign of a decent bullish continuation, aiming for the 448.40 level, before aiming for the 500.00 area.
On the bearish side, investors should monitor how the price trades above the 382.13 static line. A bearish daily candle below the 50-day EMA would be a bearish opportunity, aiming for the 320.00 psychological level.

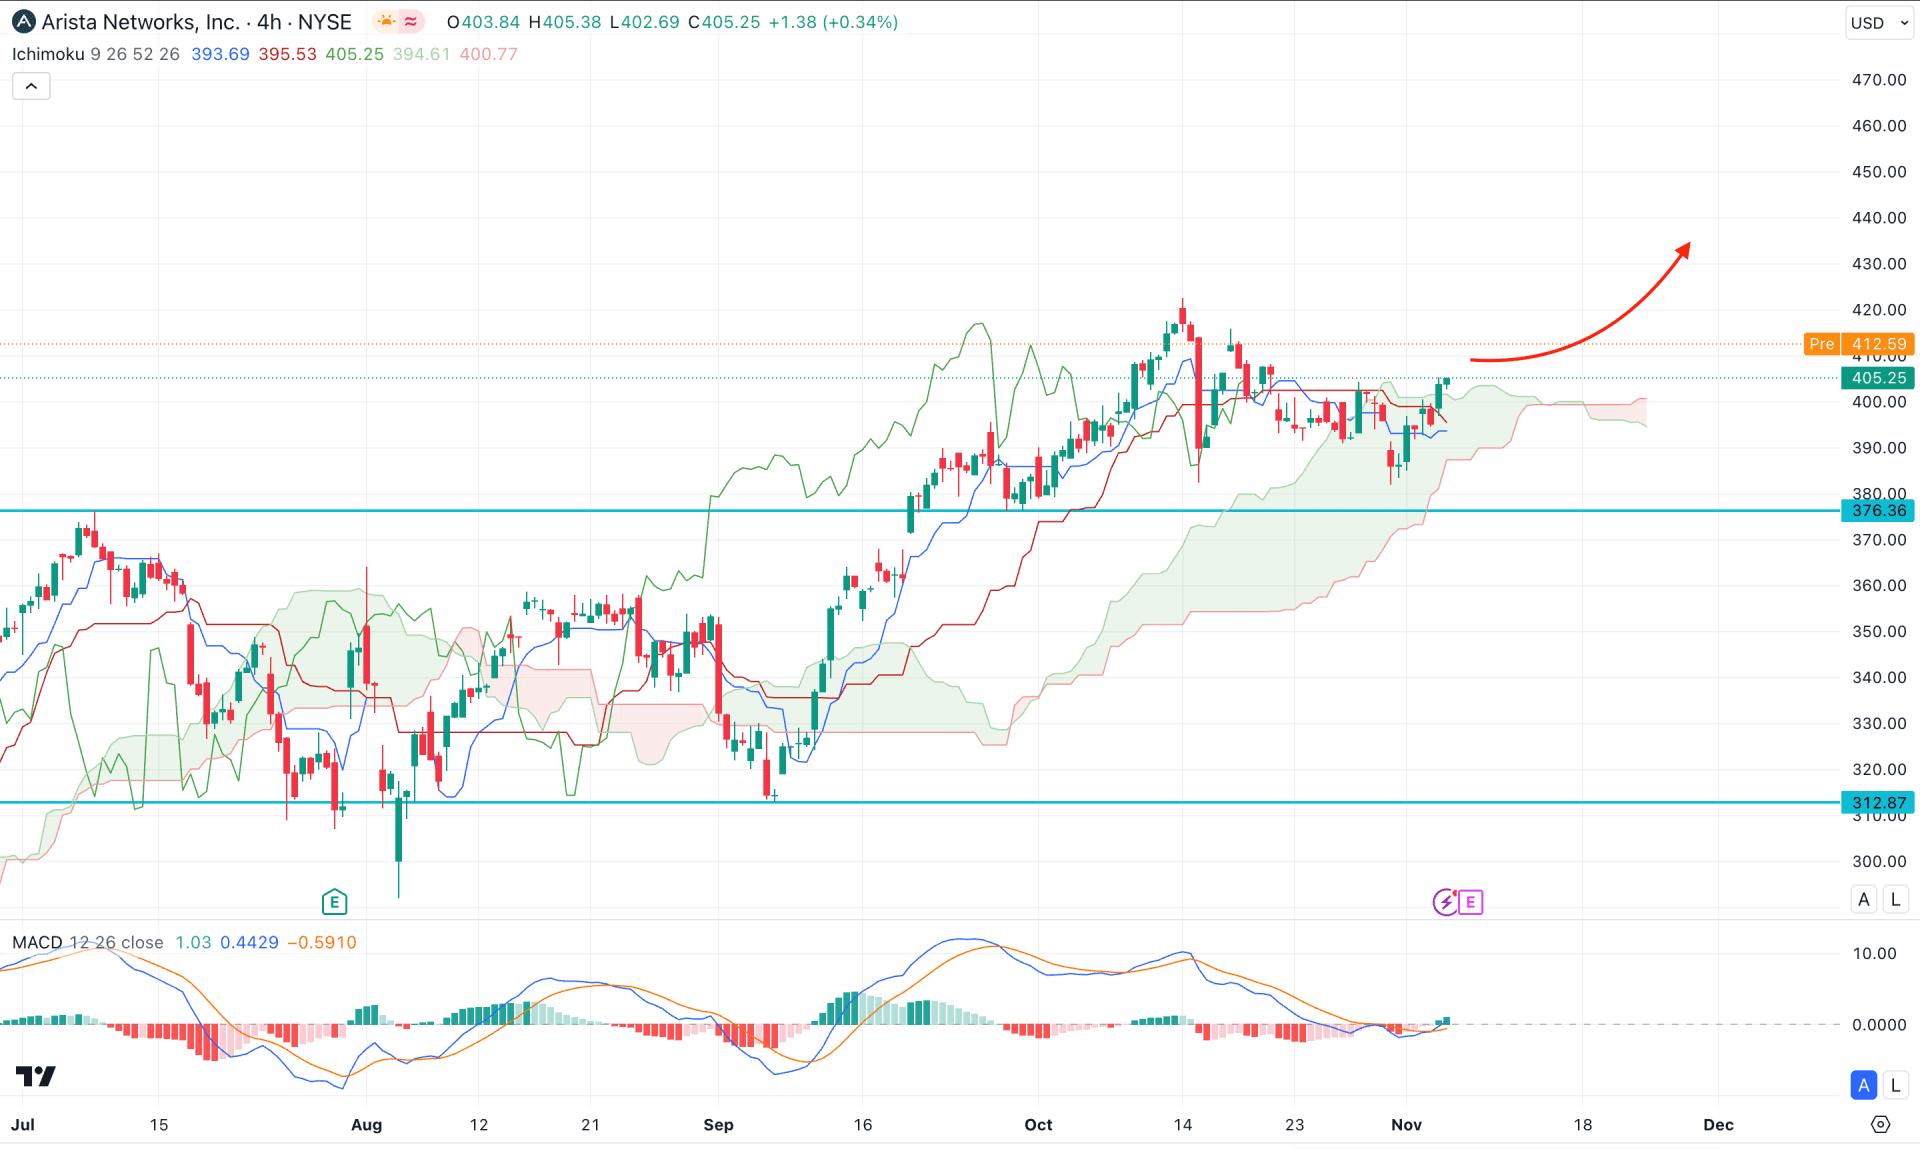
In the H4 timeframe, there is a strong bullish reversal above the 374.36 resistance level with a bullish V-shape recovery. It is a sign of a strong market reversal, from where a continuation is possible.
In the futures cloud, the Senkou Span A is below the Senkou Span B, suggesting a limit to bulls. The indicator window shows a different story, where the Histogram is above the neutral line.
Based on the H4 outlook, the immediate price action shows a bullish reversal above the dynamic Kijun Sen line, which might extend the bullish pressure toward the 450.00 psychological line.
On the bearish side, a downside correction is possible toward the Ichimoku Cloud zone, but a break below this line could invalidate the bullish possibility.

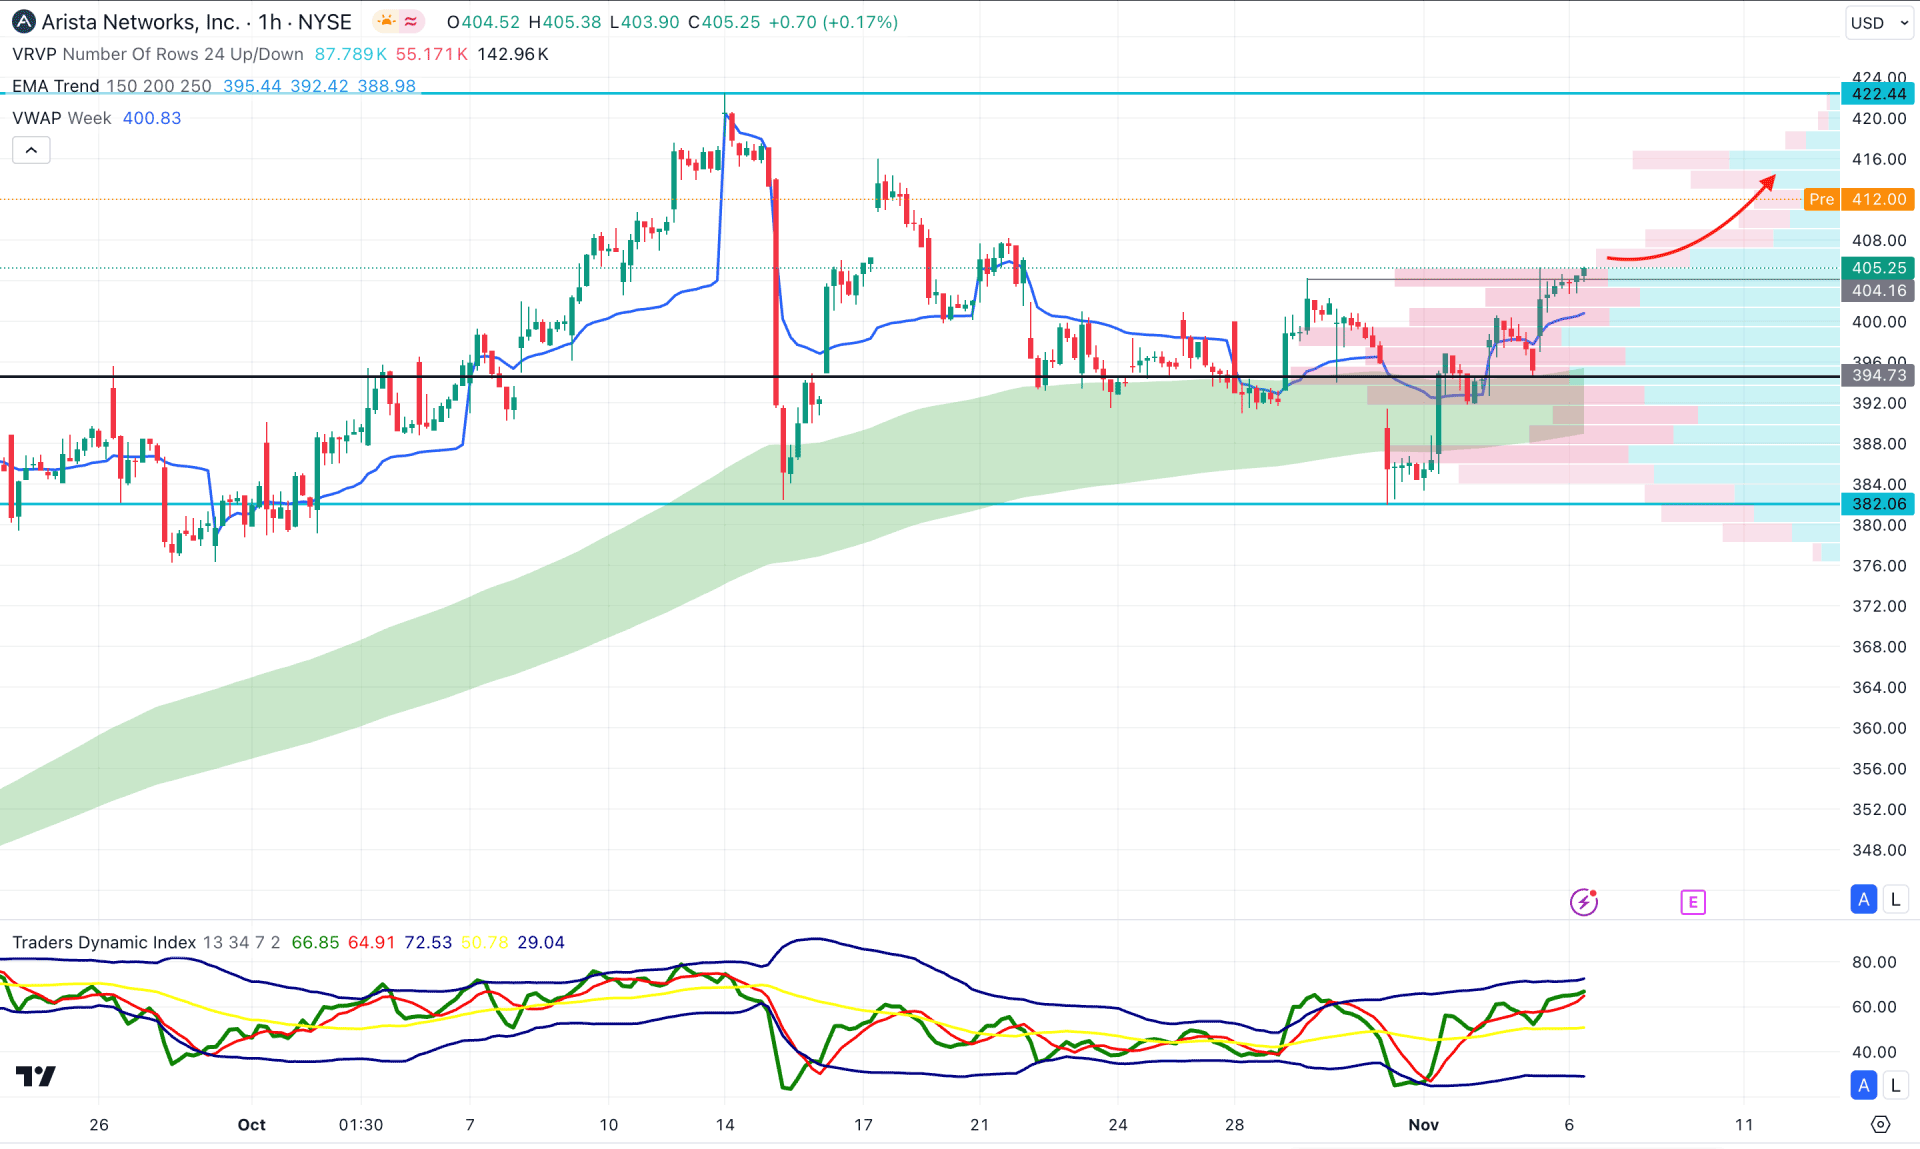
In the H1 timeframe, the ongoing buying pressure is present from the immediate bullish reversal at the visible range high volume line.
Moreover, the weekly VWAP line is below the current price, working as a bullish continuation signal. The Moving Average wave shows the same story, working as major support.
The current line in the Traders Dynamic Index is aiming higher, above the 50.00 line, which might be a strong bullish signal.
Based on this outlook, immediate buying pressure could extend and find resistance at the 422.44 level. However, a downside recovery below the 382.06 level might lower the price towards the 360.00 to 340.00 zone.
Based on the current multi-timeframe analysis, ANET can move higher as a valid bullish reversal is visible in the lower timeframe. However, a strong bearish exhaustion might invalidate the bullish pressure and lower the price by reversing the trend.