Published: June 21st, 2023
Arbitrum (ARB) is a highly anticipated cryptocurrency initiative that aims to increase Ethereum's efficiency and lower transaction fees. Despite facing some obstacles, it has established a firm market position.
Offchain Labs, a New York-based software development company, created the layer two scaling solution Arbitrum. It uses optimistic rollups, applications that use smart contracts to validate transactions off the Ethereum network. This method expedites processing and reduces costs for users.
ARB is the native token of the Arbitrum platform, allowing holders to vote on network proposals and trade them on exchanges. However, it is essential to note that ARB is not a standalone coin but rather a token based on Ethereum. Frequently, references to an "Arbitrum coin price prediction" are inaccurate.
Arbitrum is one of several available layer two scaling solutions, and its release this year has attracted attention. Despite initial obstacles, the project's integration with The Graph has rekindled interest and strengthened its position in the cryptocurrency market.
Let’s see the current market outlook of Arbitrum from the ARB/USDT technical analysis:
Arbitrum (ARB) launched trading on Binance in recent months, and as per the available data, the current market momentum is high potential for bulls.
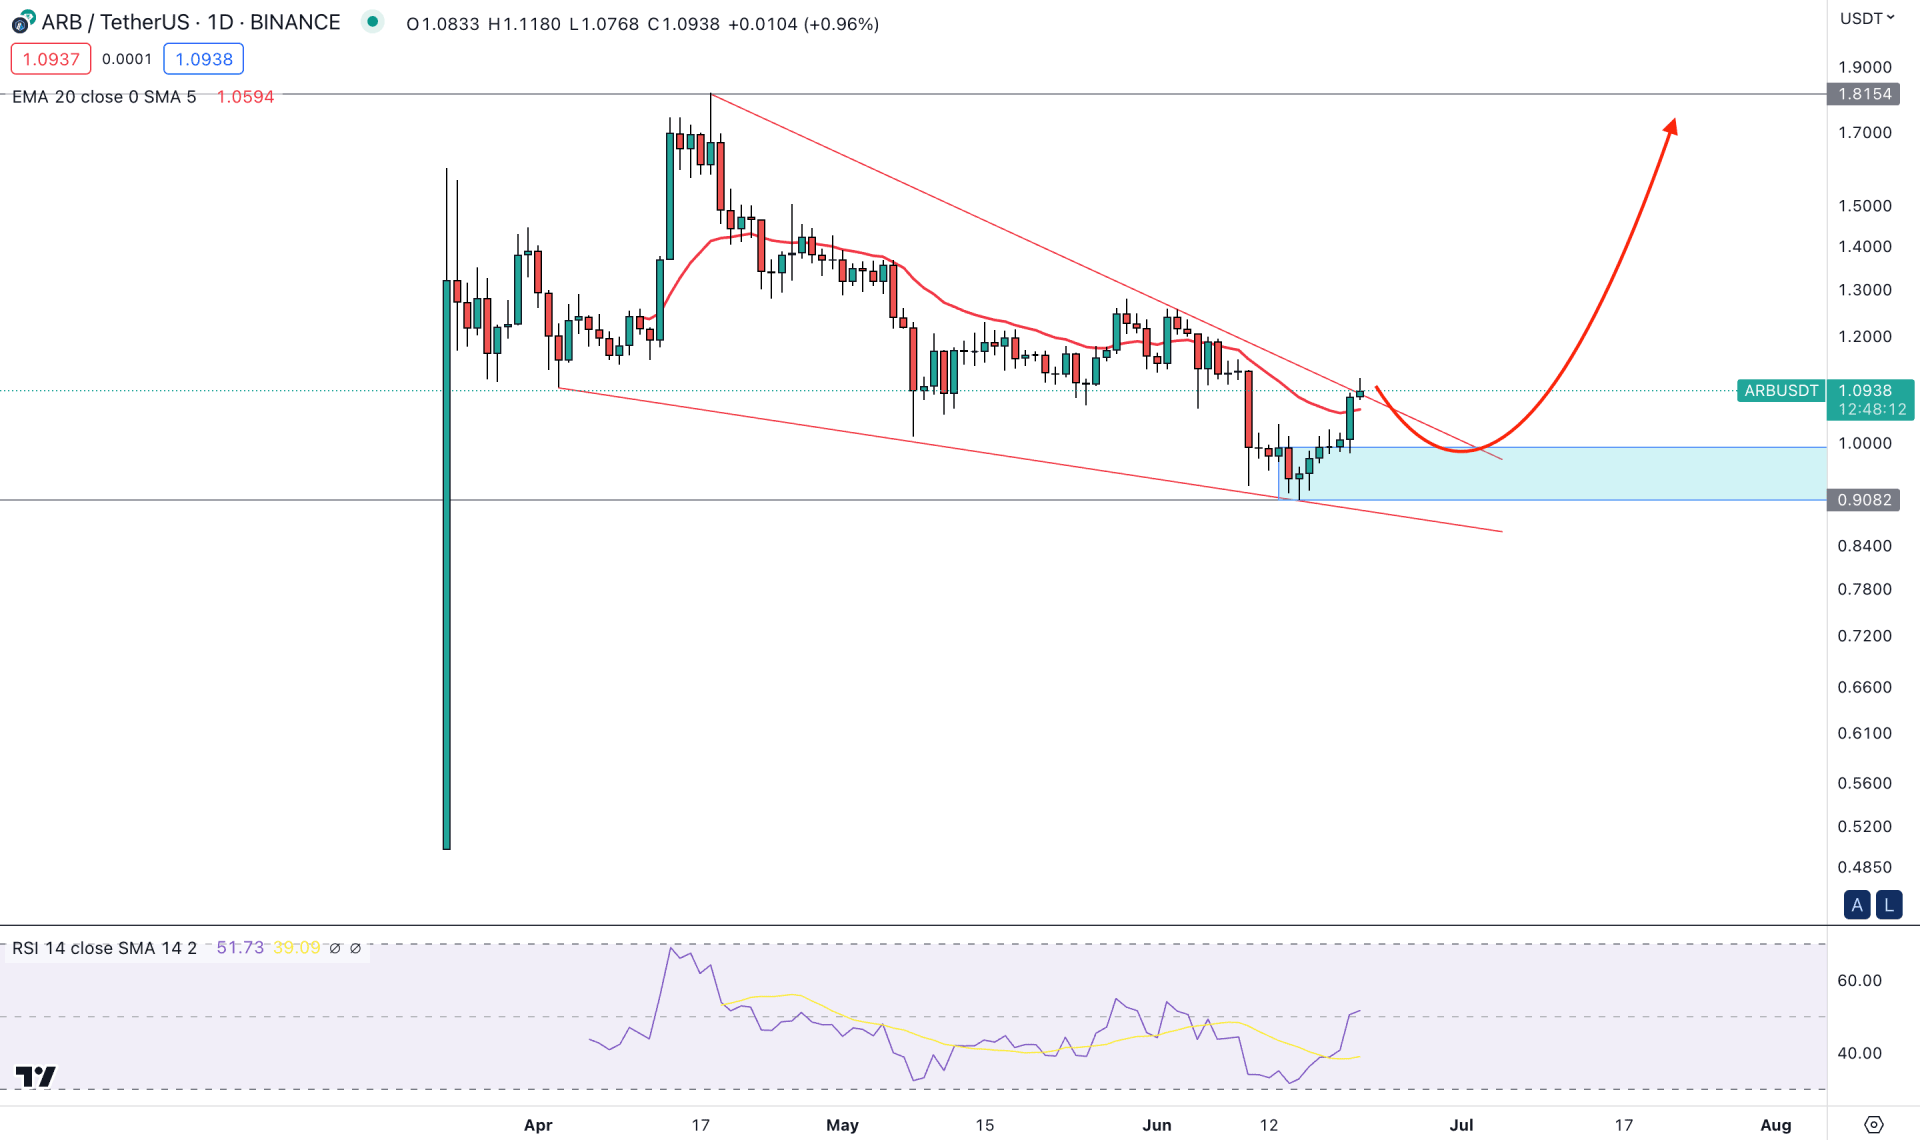
Since the launch, the price has gone sideways without any clear direction, but in the last three months, the downside correction provided a long opportunity from the price pattern.
The lower and higher low formations signal a falling wedge pattern, a strong bullish reversal opportunity. Proper validation from the wedge breakout with a daily price above the resistance level could increase the possibility of making a new all-time high in the coming days.
The bullish possibility is potent in the short-term market trend as a strong daily candle appeared above the dynamic 20 EMA line. However, the existing bull run left the 0.9943 to 0.9082 area as a valid demand zone.
The bullish possibility is also valid from the indicator window, where the current 14-period RSI shows a strong bullish position above the neutral 50.00 line. It opened the room for testing the overbought 70.00 level again in the coming days.
This daily structure requires a proper breakout above the Wedge resistance before aiming for a conservative long approach. However, the early breakout sign is available from the 20 EMA position.
In that case, an immediate correction and any strong bullish rejection from the 0.9943 to 0.9082 demand zone could offer an early bullish sign. In that case, the main aim is to test the 1.8153 all-time high level.
On the other hand, the bullish possibility is valid as long as the price trades above the 0.9000 key psychological level. A break below this level with a D1 candle could initiate a deeper correction towards the 0.6000 level.
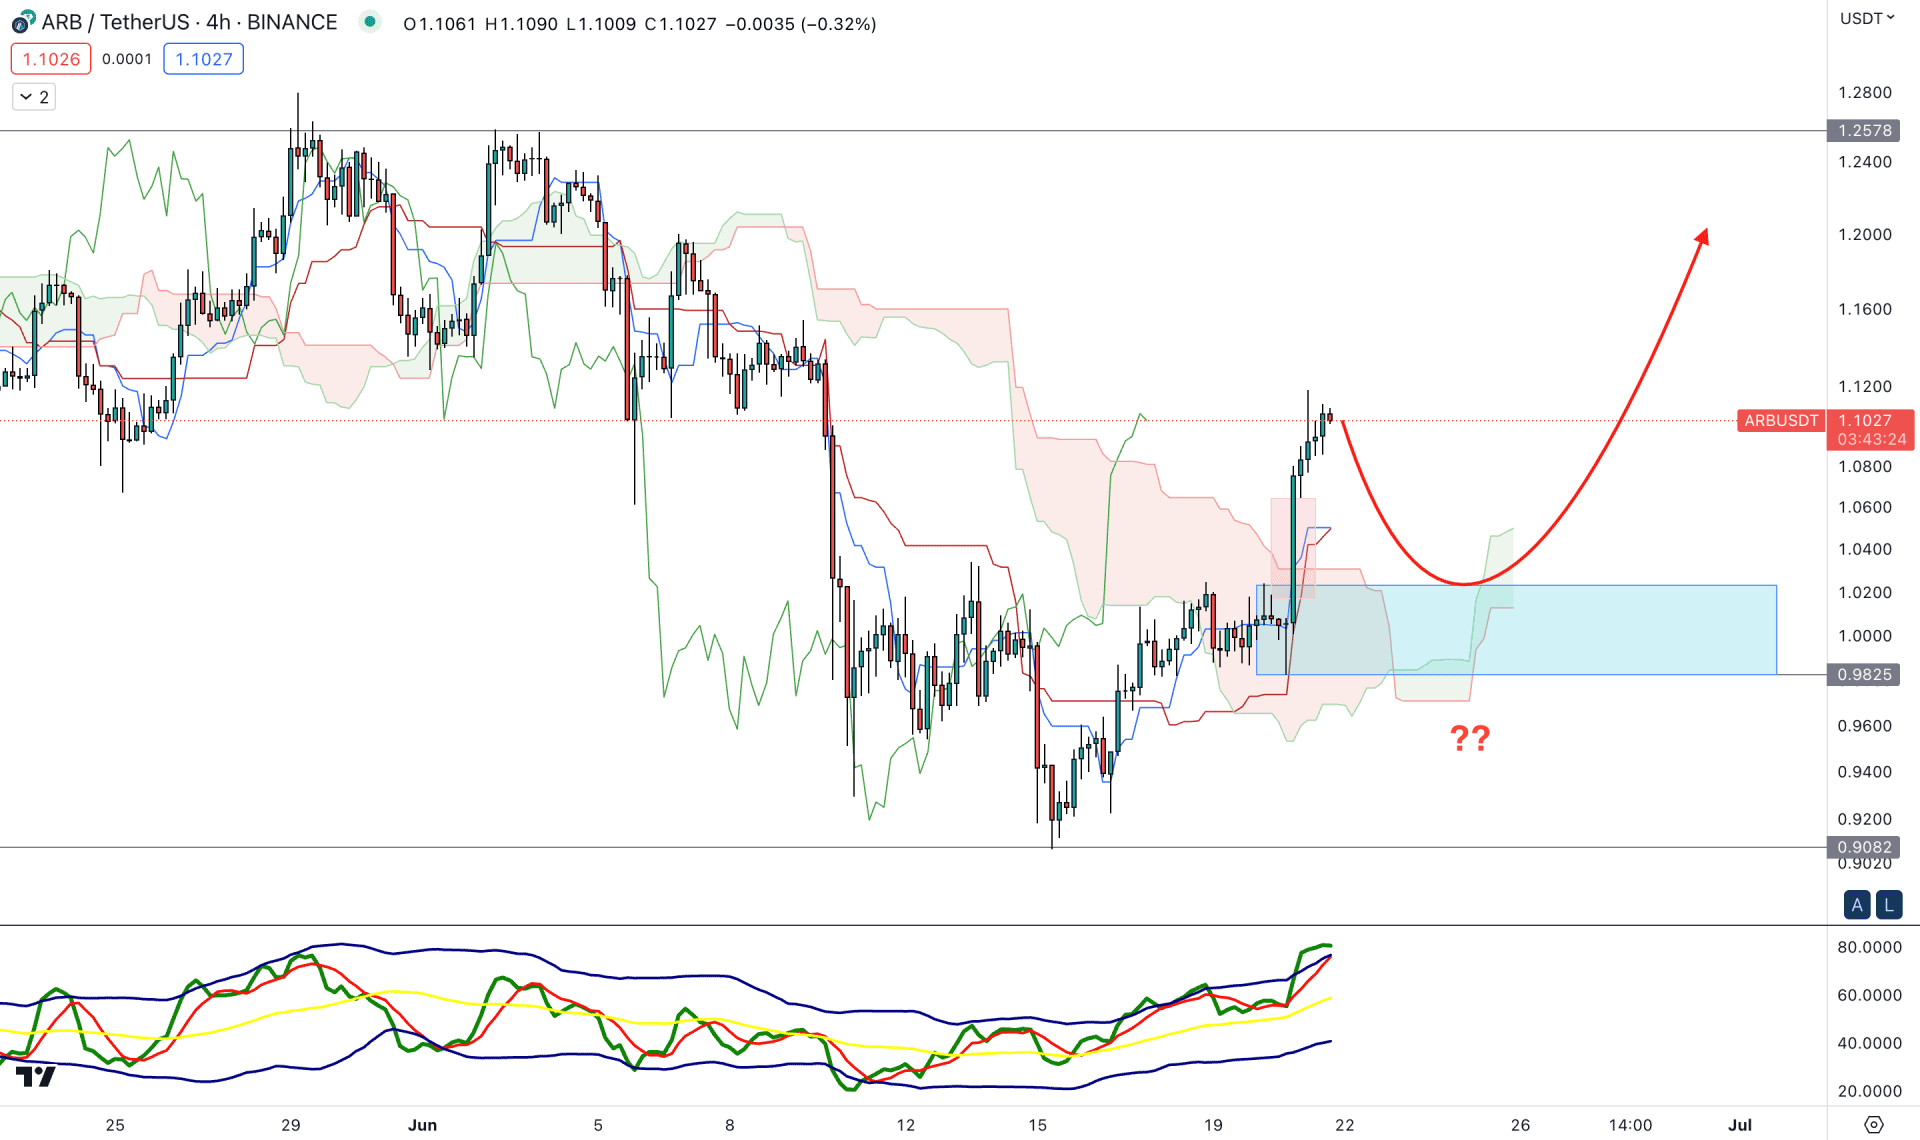
In the H4 timeframe, the bullish trend reversal is valid from the recent strong impulsive candle above the cloud support area. Later, bulls extended the buying pressure by holding the momentum for over a day. It is a sign that bulls are interested in this instrument, and any downside correction could increase the bullish possibility.
The upside pressure above the Kumo Cloud left price inefficiency, and properly mitigating the imbalance could offer a strong bullish opportunity. Below this level, a strong demand zone is present at the 1.0231 to 0.9821 area, which could be the ultimate barrier to the buying pressure.
In the indicator window, the current TDI level is at an overbought level, signaling a downside correction.
Based on this structure, investors should monitor how the price reacts at the dynamic Kijun Sen support, as any bullish rejection from this area could be a strong buying possibility targeting the 1.2400 level.
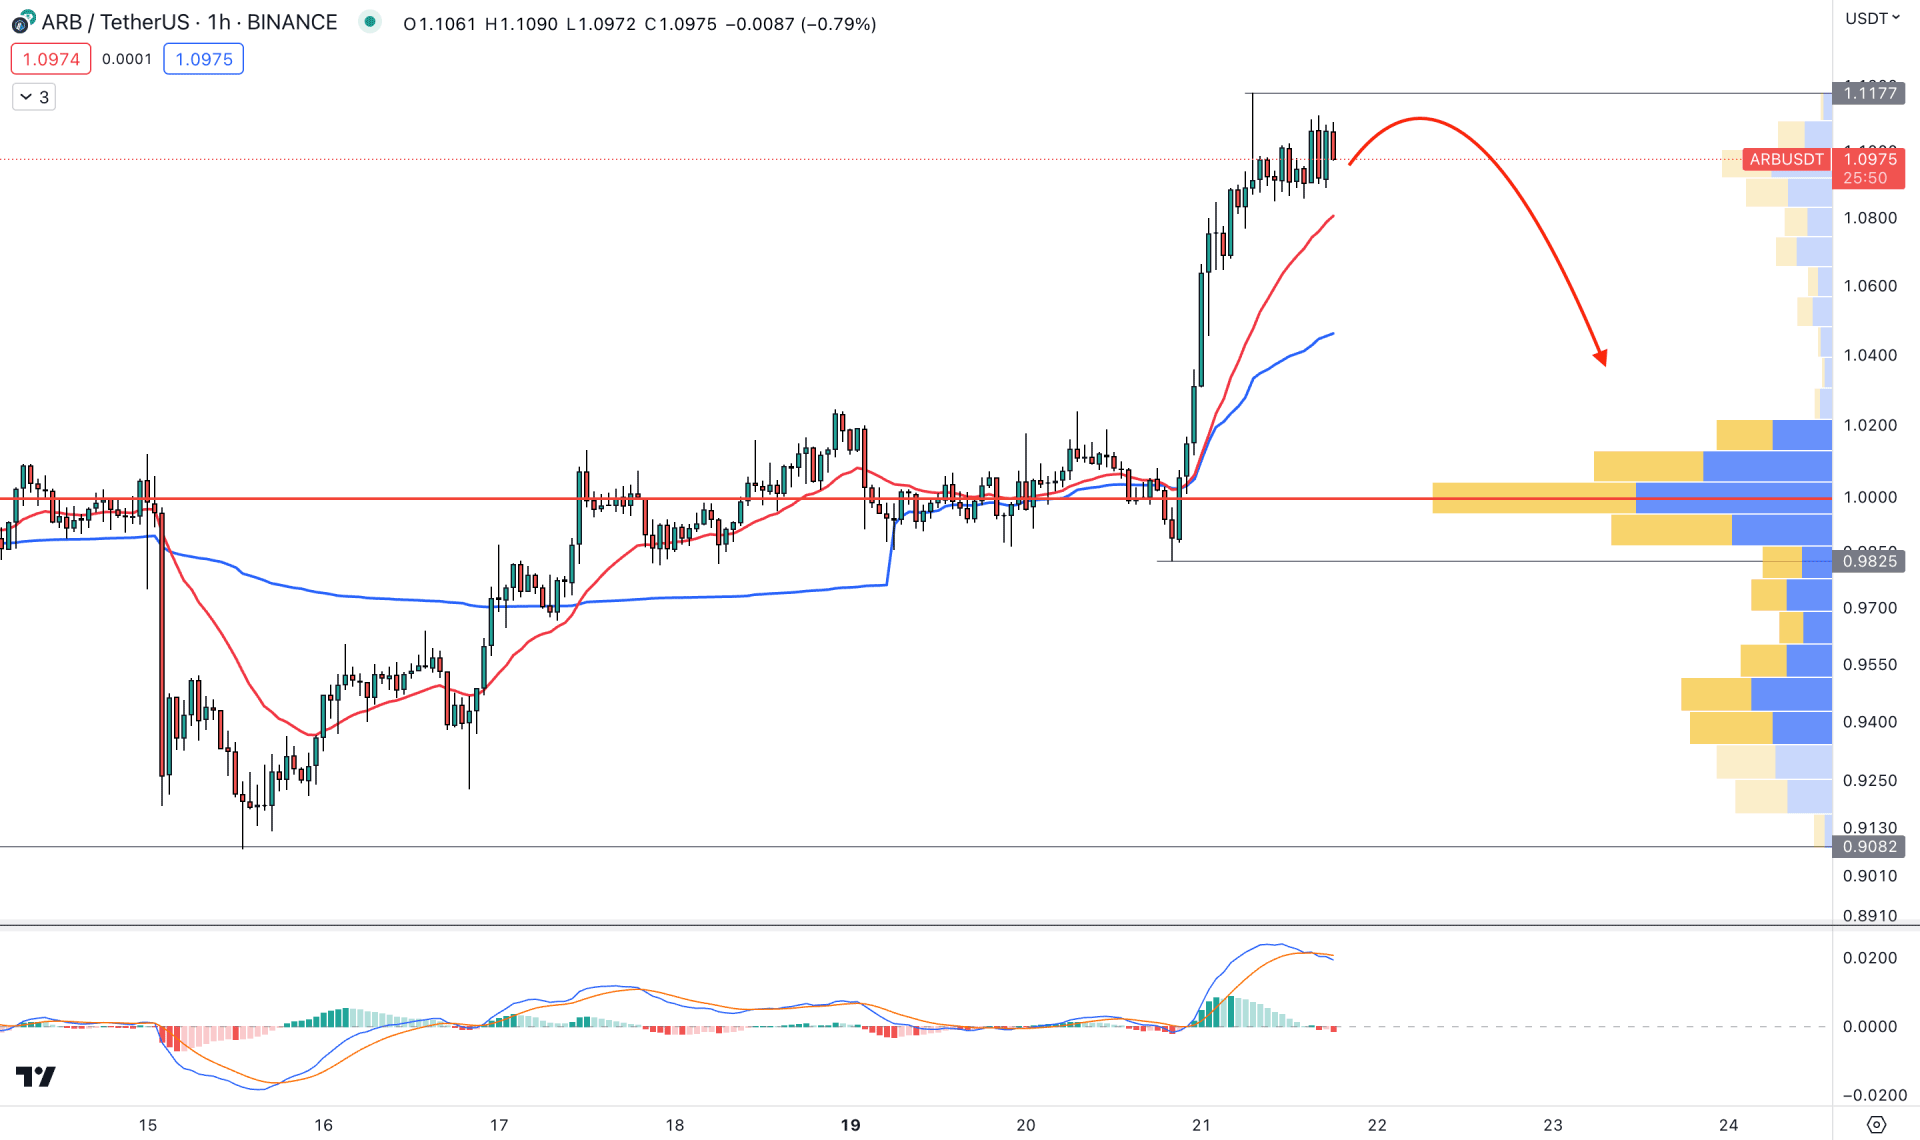
In the hourly chart, the current market structure for ARB/USDT is extremely bullish as the gap between the visible range and high volume level with the current price is extended.
Moreover, the current weekly VWAP and dynamic 20 EMA are below the price with an upward slope. It is a sign that the market outlook is bullish, but some downside correction is still pending.
Based on this outlook, we may expect the bearish pressure to come in this pair, where an additional bullish rejection from dynamic 20 EMA support could be a short-term buying opportunity.
On the other hand, breaking below the 0.9825 level with a bearish H4 candle could eliminate the bullish possibility at any time.
Based on the current market outlook, ARB/USDT is more likely to extend the buying pressure in the coming days. However, a minor downward pressure is pending in the intraday chart and investors might grab the early buying opportunity on the valid rejection.


