Published: August 20th, 2025
Arbitrum's total value locked (TVL) for decentralized finance (DeFi) has risen to $3.39 billion, as per the latest report. The expansion is a result of growing trading volume on the Ethereum network, which in turn drives more activity on Layer-2 solutions (L2s) such as Arbitrum.
Another report showed that Arbitrum's TVL has risen gradually over the last four weeks to reach a so far this year peak of $3.39 billion.
A rising TVL indicates increased network traffic and liquidity. It implies that more money is being invested in intelligent agreements for decentralized finance operations, such as lending and trading.
Similar to Ethereum's current network activity, Arbitrum is seeing an increase in customer demand. Over the previous several weeks, Ethereum's average operational address count has increased by 33%, while the volume of transactions has increased by 10%, according to Artemis.
This kind of increase in user demand for Ethereum causes a lot of activity to spill over into L2s. Users who wish to escape traffic on the primary Ethereum chain are drawn to these networks because they offer quicker transaction speeds and cheaper fees.
ARB's substantial trading volume demonstrates that the movement is supported by significant participation rather than weak liquidity, and its rising price indicates that demand exceeds supply.
Let's see the upcoming price direction from the ARB/USDT technical analysis:
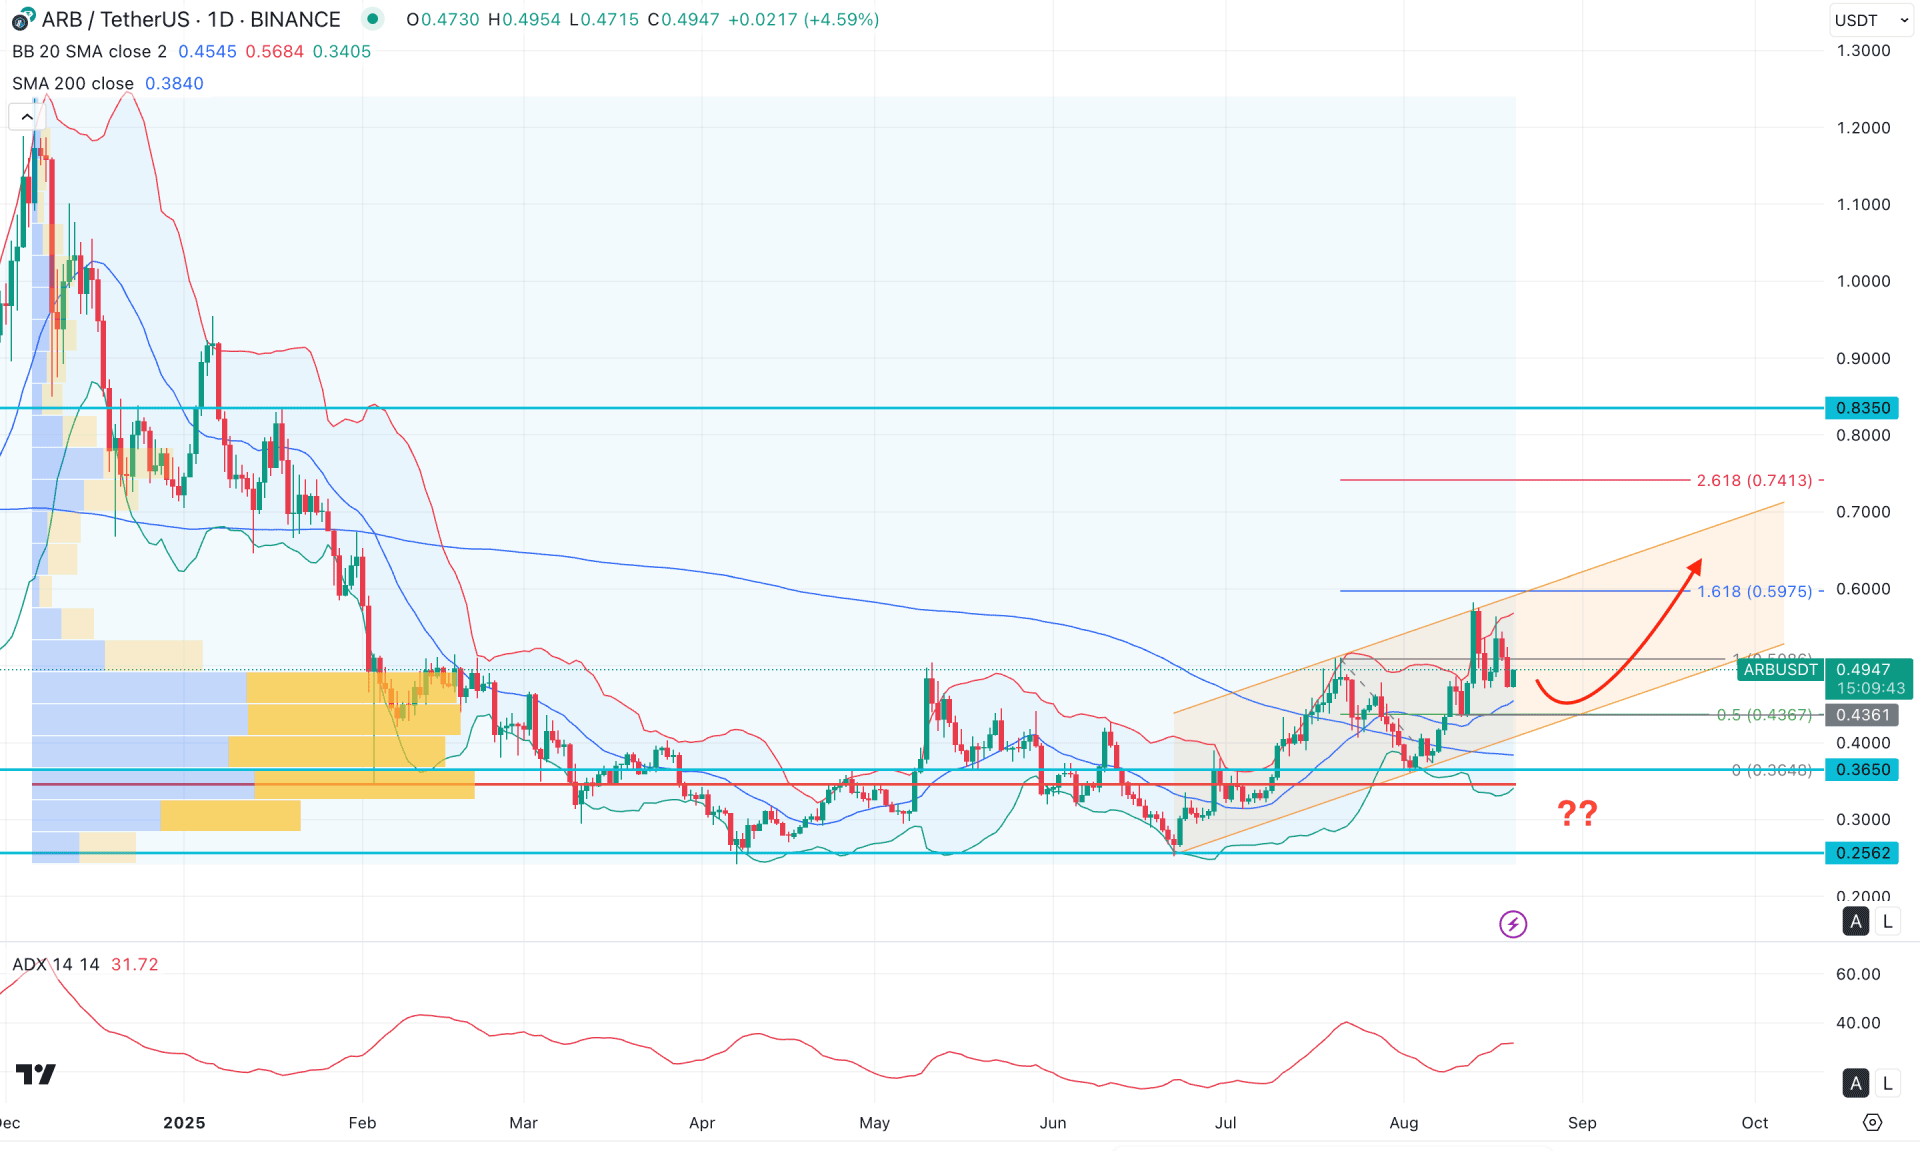
In the daily chart of ARB/USDT, the broader market momentum is bullish as the recent price has found a bottom before making consecutive higher highs. Although the price is aiming higher, the ongoing momentum remains sideways. Primarily, a range extension is possible, but a reliable long signal might only appear after the price reaches the channel support.
In the higher timeframe, the price is still trading within a discounted zone, with sideways momentum clearly visible on the monthly chart. After multiple indecision candles, the current price is aiming higher, above the July 2025 high. In this case, investors should monitor how the price reacts at that level, as a successful close above it could signal a potential bullish reversal.
On the weekly timeframe, a bullish two-bar continuation pattern is visible, with the current price hovering around weekly resistance. This indicates a buy-side liquidity sweep, from which a notable downside recovery may occur.
From a volume perspective, buying pressure remains strong, as the largest activity level since December 2025 lies below the current price.
Moreover, the daily chart shows that momentum is still upward. After facing resistance at the upper Bollinger Band, the price made a corrective pullback. However, it is finding support near the mid-Bollinger Band level, reinforced by the 200-day simple moving average. Additionally, the Bollinger Bands have widened, with the lower band sloping upward in a high-volume area – supporting the bullish outlook.
On the other hand, the Average Directional Index (ADX) has rebounded and moved above the 20.00 line, signaling strengthening momentum.
Based on the global market outlook, investors should closely monitor how the price behaves within the ascending channel. The primary downside risk is an extension toward the lower Bollinger Band area. In such a case, bullish signals from the 0.4360–0.3650 support zone could present a long opportunity, targeting the 0.7000 psychological level.
Alternatively, the recent price action shows that the general resistance has already been retested, with downside pressure building. If bearish momentum extends and the price closes below the 0.3450 support, it could be an alarming sign for bulls. In that scenario, the price might revisit the 0.2562 low before forming another bullish opportunity.
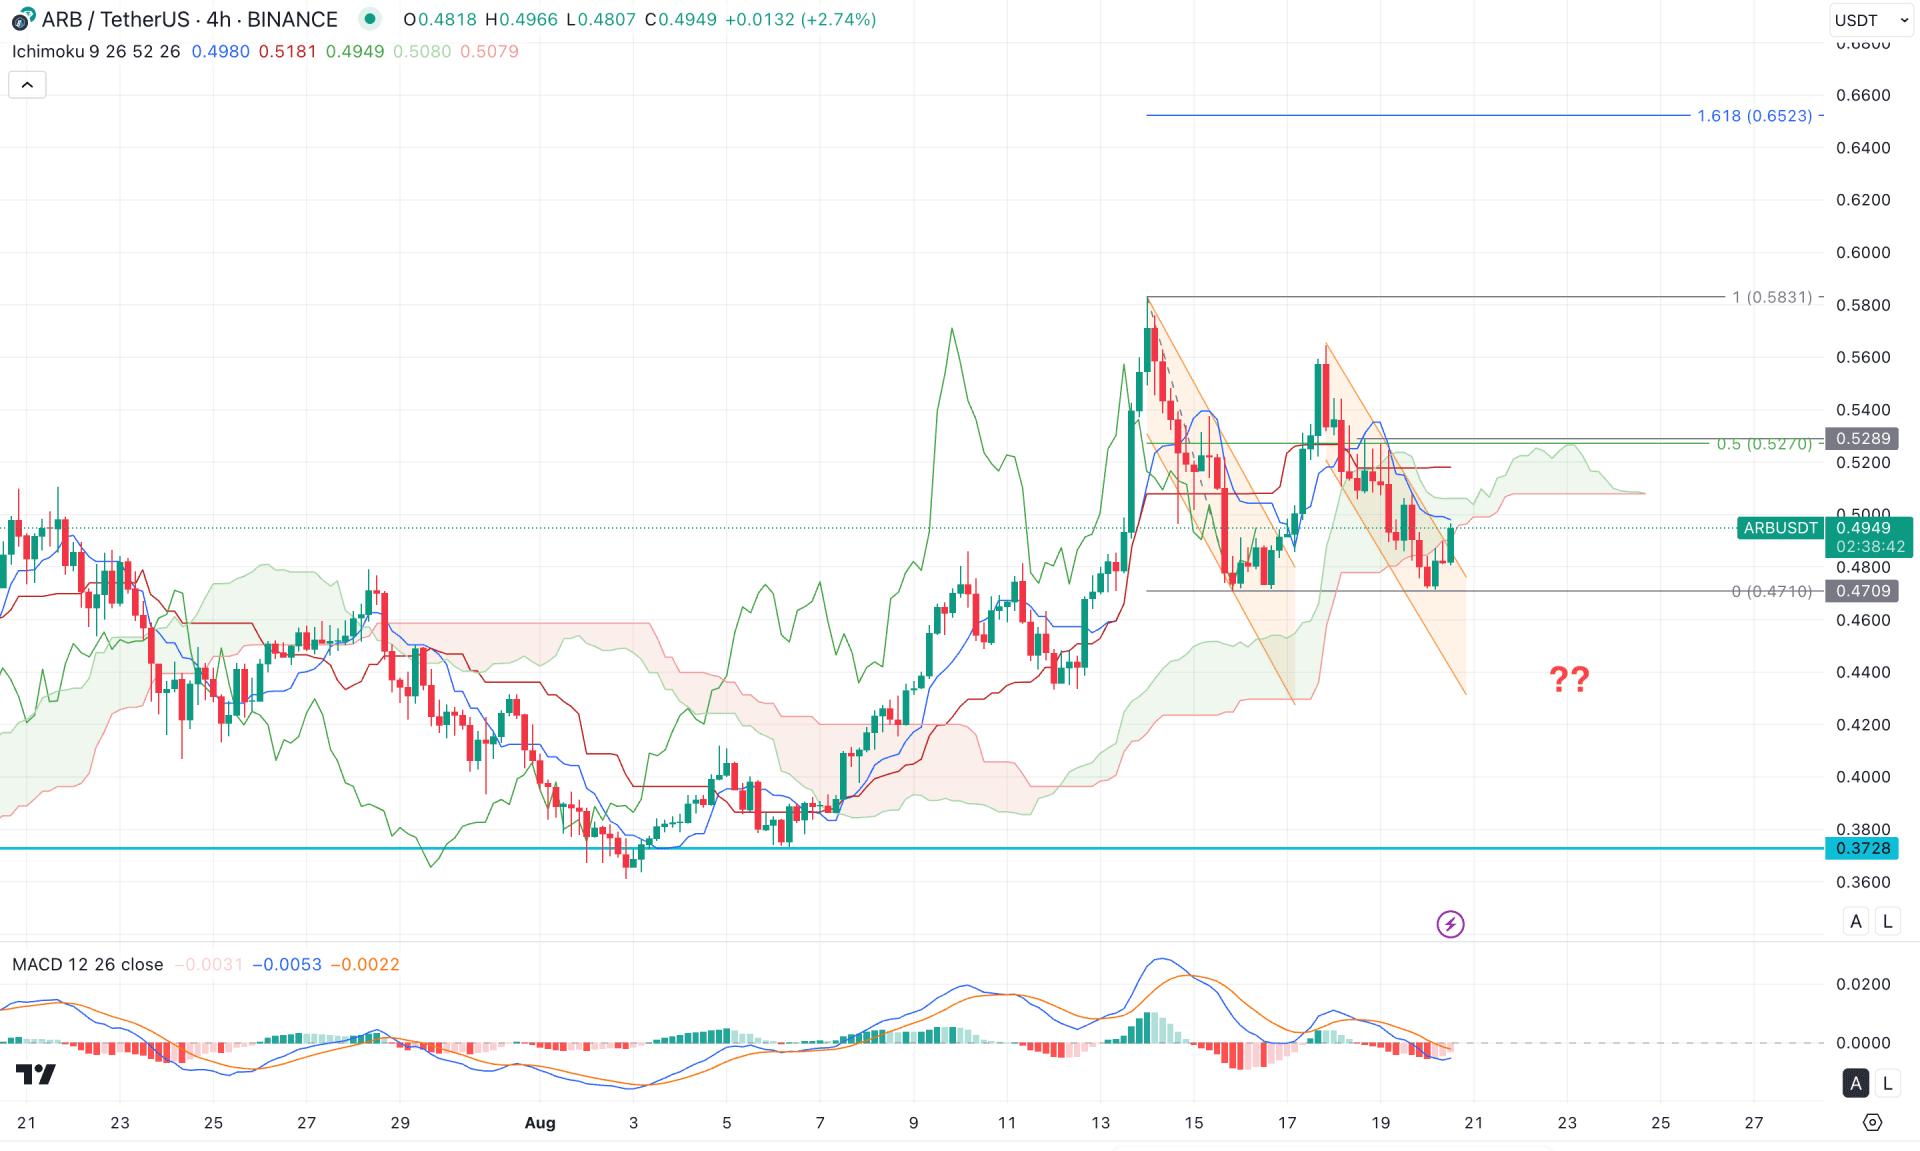
In the 4-hour timeframe, the recent price is showing sideways momentum above the Kumo Cloud area. Primarily, this indicates a failure to hold the price at the bullish zone, from where a recovery is still possible. Moreover, the future cloud has flipped, with both lines converging, signaling sideways bullish pressure.
In the secondary indicator window, the price action shows a different story. The bearish MACD histogram has failed to extend downside pressure and has reached the neutral zone. Meanwhile, the MACD signal line has entered negative territory before flattening. In this case, additional downside pressure on the main chart could push the signal line lower, but a bullish crossover from the higher zone could present a long opportunity.
Based on the 4-hour market outlook, investors should monitor how the price behaves within the current descending channel. A bullish breakout with a stable price above the 0.5289 level could be a potential long opportunity, targeting the 0.6523 Fibonacci extension level.
However, the price is still trading within a consolidation zone, with a bearish crossover in the dynamic lines visible and no stable close below the Kumo area. In this case, failure to overcome the 0.5289 level, followed by a clear rejection below the dynamic support, could offer a short-term opportunity targeting the 0.4400 psychological level.
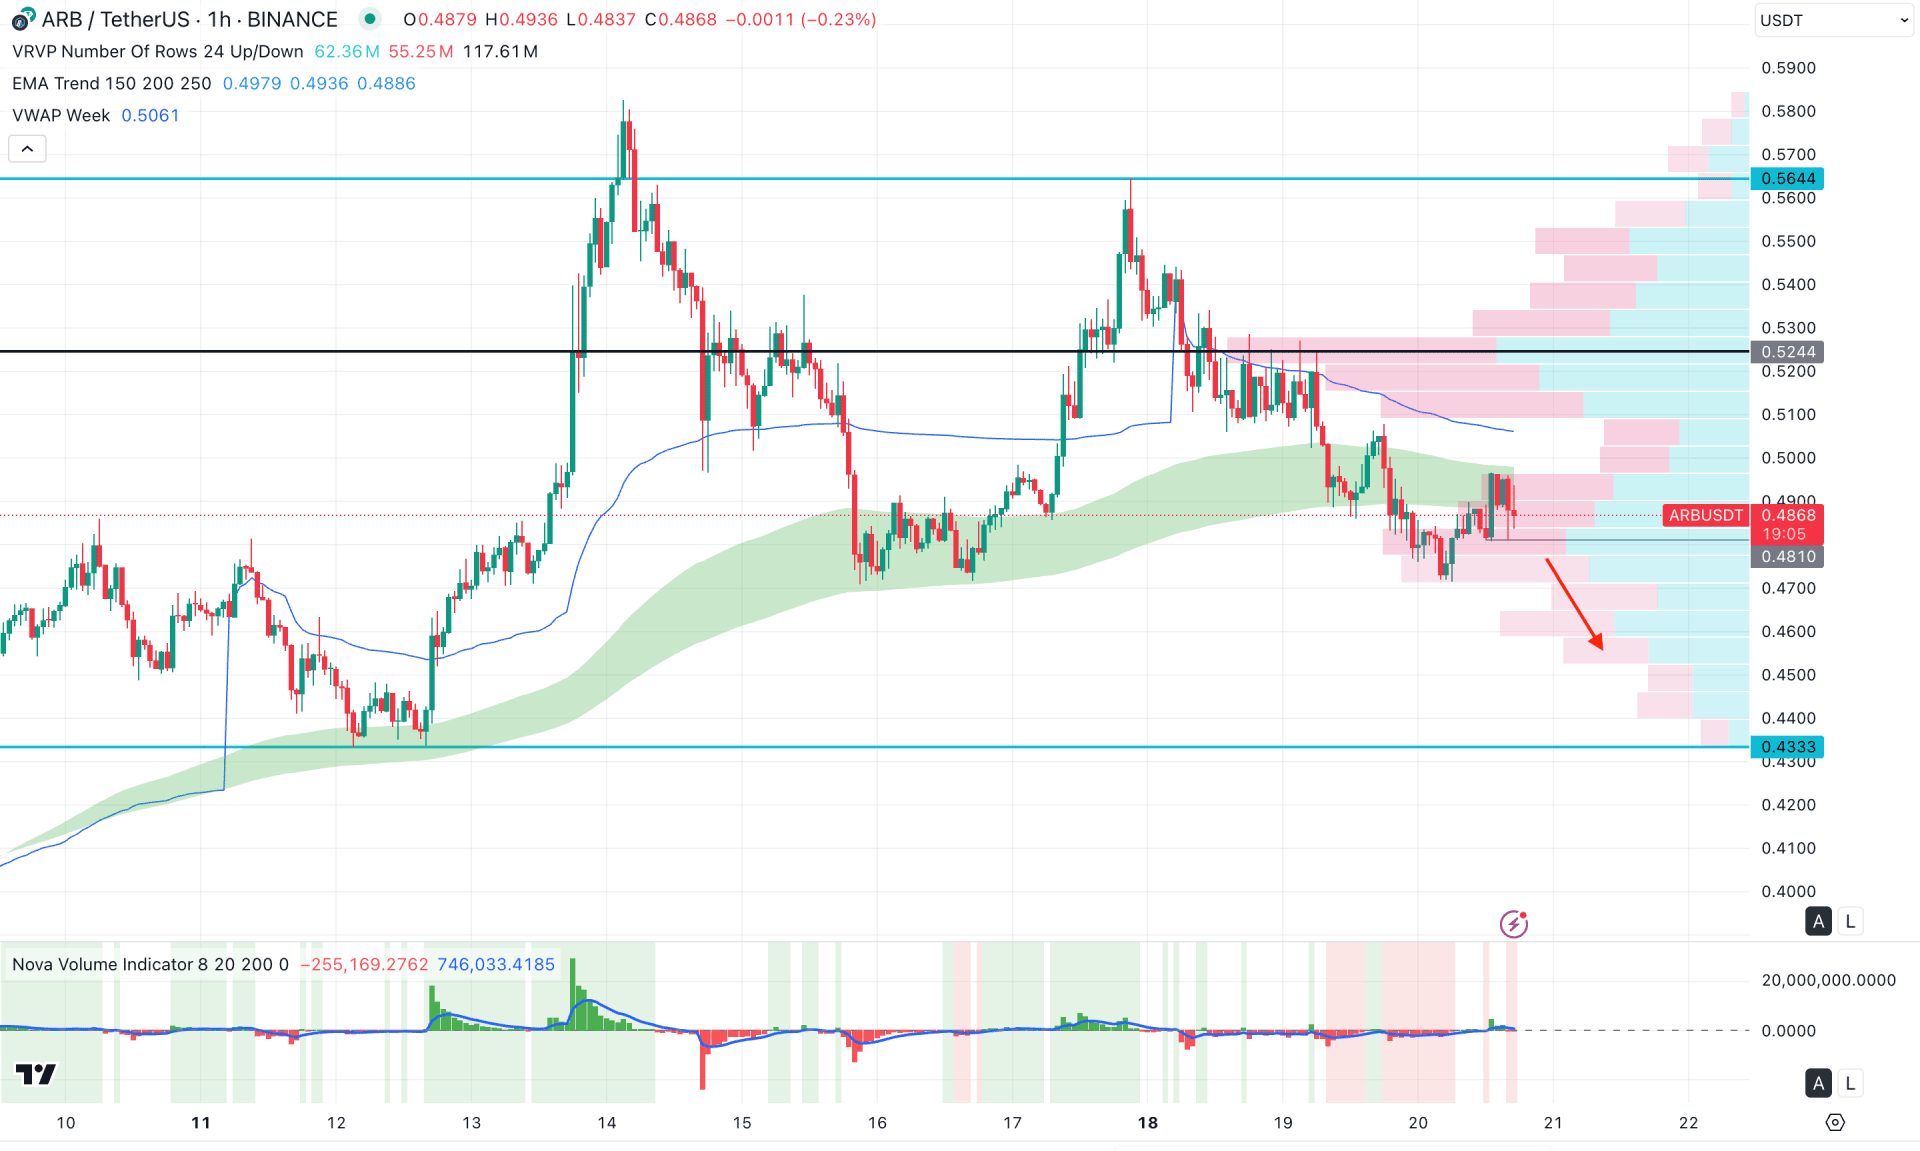
In the hourly timeframe, an ongoing intraday bearish pressure is present as the current price is hovering below the dynamic VWAP level. Moreover, the Moving Average wave is above the current price, working as an immediate resistance.
On the other hand, the intraday high volume level is above the VWAP line, which signals a strong selling pressure in the market. Moreover, the Volume Histogram shows a weakness to bulls as the current vertical line is losing its positive momentum.
Based on this overall intraday outlook, an ongoing selling pressure is present, where the current price is trading at the premium zone. In that case, a downside recovery below the 0.4810 support level could be an immediate short opportunity aiming for the 0.4333 level.
The alternative trading approach is to wait for the price to create a bottom before moving above the dynamic VWAP line. In that case, a long opportunity might open, where the main aim would be to test the 0.5800 area.
Based on the overall market outlook, ARB/USDT is trading within a bullish momentum where the price is likely to extend higher as a channel extension. As the intraday price is lower, a valid bottom formation with a decent bullish recovery might offer an early long opportunity.


