Published: August 15th, 2024
The price of Aptos increased dramatically by 16% as it gained traction. The likelihood of an uptrend in the coin has increased due to its recent surge. In recent sessions, it has done incredibly well, increasing by more than 25% every week.
Furthermore, there appeared to have been a substantial inflow of derivatives contracts along with the recent surge. The analysts claim that the derivatives contracts have experienced strong growth of more than 50%, which has pushed the price nearer to the higher sways.
In recent discussions, the Aptos coin has done incredibly well, increasing by almost 25% weekly. The cryptocurrency dropped nearly 30% concurrent with the general market decline. Nevertheless, the recent rebound has been swift and very strong, suggesting that the trend may continue.
Analysts believe that derivatives traders are primarily responsible for the recent price increase. The open interest info has increased significantly over the past two sessions by 50%, suggesting that buyers are making an impressive rebound.
As of August 15th, there were almost $45 million worth of open contracts. However, as the analyst noted today, the number of open agreements increased significantly to $67 million, signifying an almost $22 million increase. An increase in open contracts frequently indicates that the asset price will continue.
Let's see the further aspect of this coin from the APT/USDT technical analysis:

The APT/USDT daily price showed a valid pump and dump scheme, making a counter-impulsive bearish pressure from the 19.41 top. As a result, the price came down and formed a new yearly low. However, the cheaper price with a future growth possibility could be a potential investment opportunity in this coin but it should come with a valid price action.
Looking at the higher timeframe, the monthly candle became sideways since July 2024, suggesting a weaker selling pressure. Also, the ongoing candle in August moved higher from the July low but remains below the 7.07 monthly resistance. In that case, an ongoing buying pressure with a valid consolidation above the 7.07 level could be a potential long opportunity in this pair.
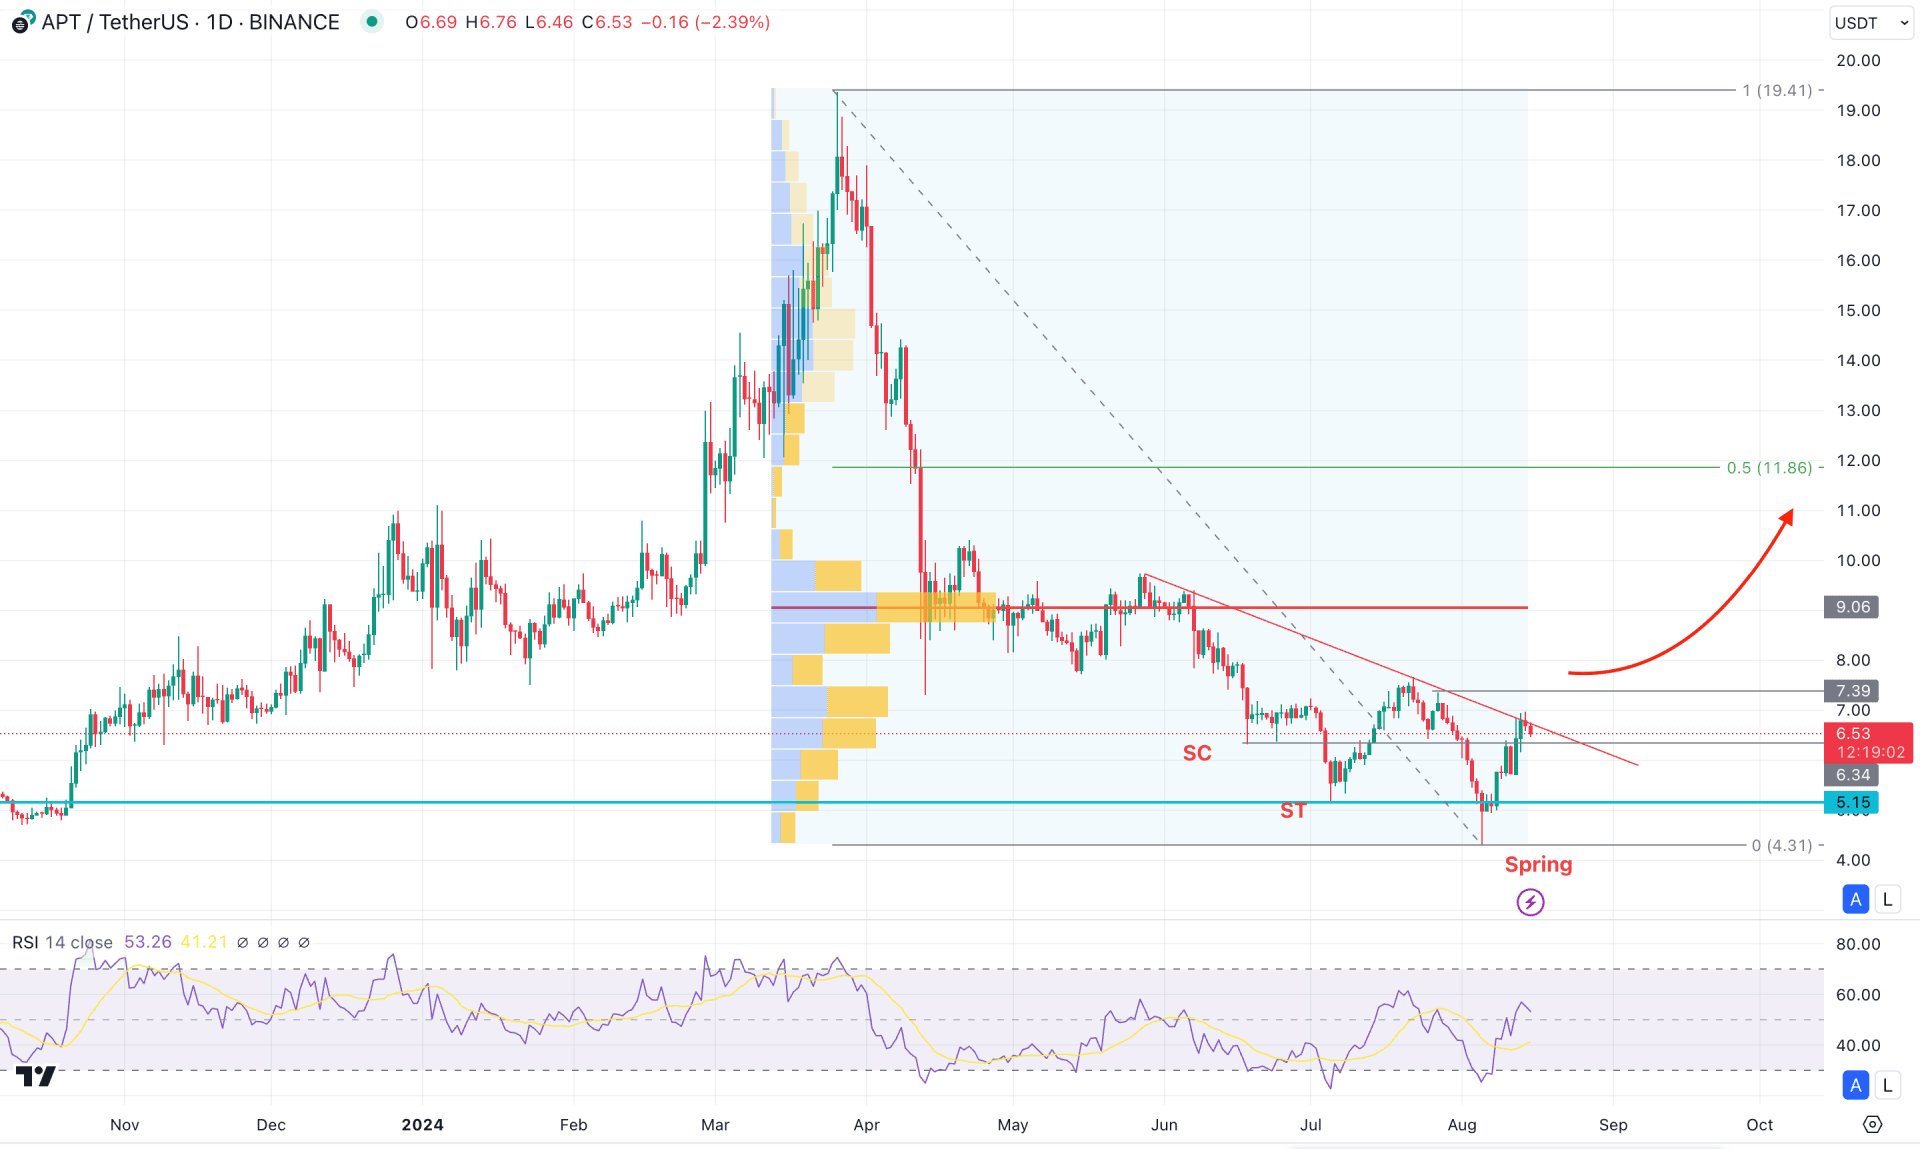
Coming to the daily chart. The recent selling pressure after having a redistribution phase signals a bottom formation from the Wyckoff accumulation. The Selling Climax and Secondary test are clear in the above image, from where the Sprice came with a massive sell-side liquidity sweep. However, the pattern is yet to be completed as a proper breakout is pending. Before making the 4.310 level a valid bottom, the price should form a valid descending trendline breakout with a stable market above the 7.39 high.
In the secondary indicator window, the bullish possibility is visible from the Relative Strength Index (RSI) as the current level hovers above the 50.00 neutral point.
Based on the daily market outlook of APT/USDT, the first bullish signal might come from a valid break above the 7.39 level. In that case, the upside pressure might reach the 50% Fibonacci Retracement level of the current swing swing at the 11.86 level.
On the other hand, a minor downside pressure is possible as the current price faces pressure from the channel resistance. However, a bearish daily close below the 5.15 level might resume the existing trend below the 4.00 area.

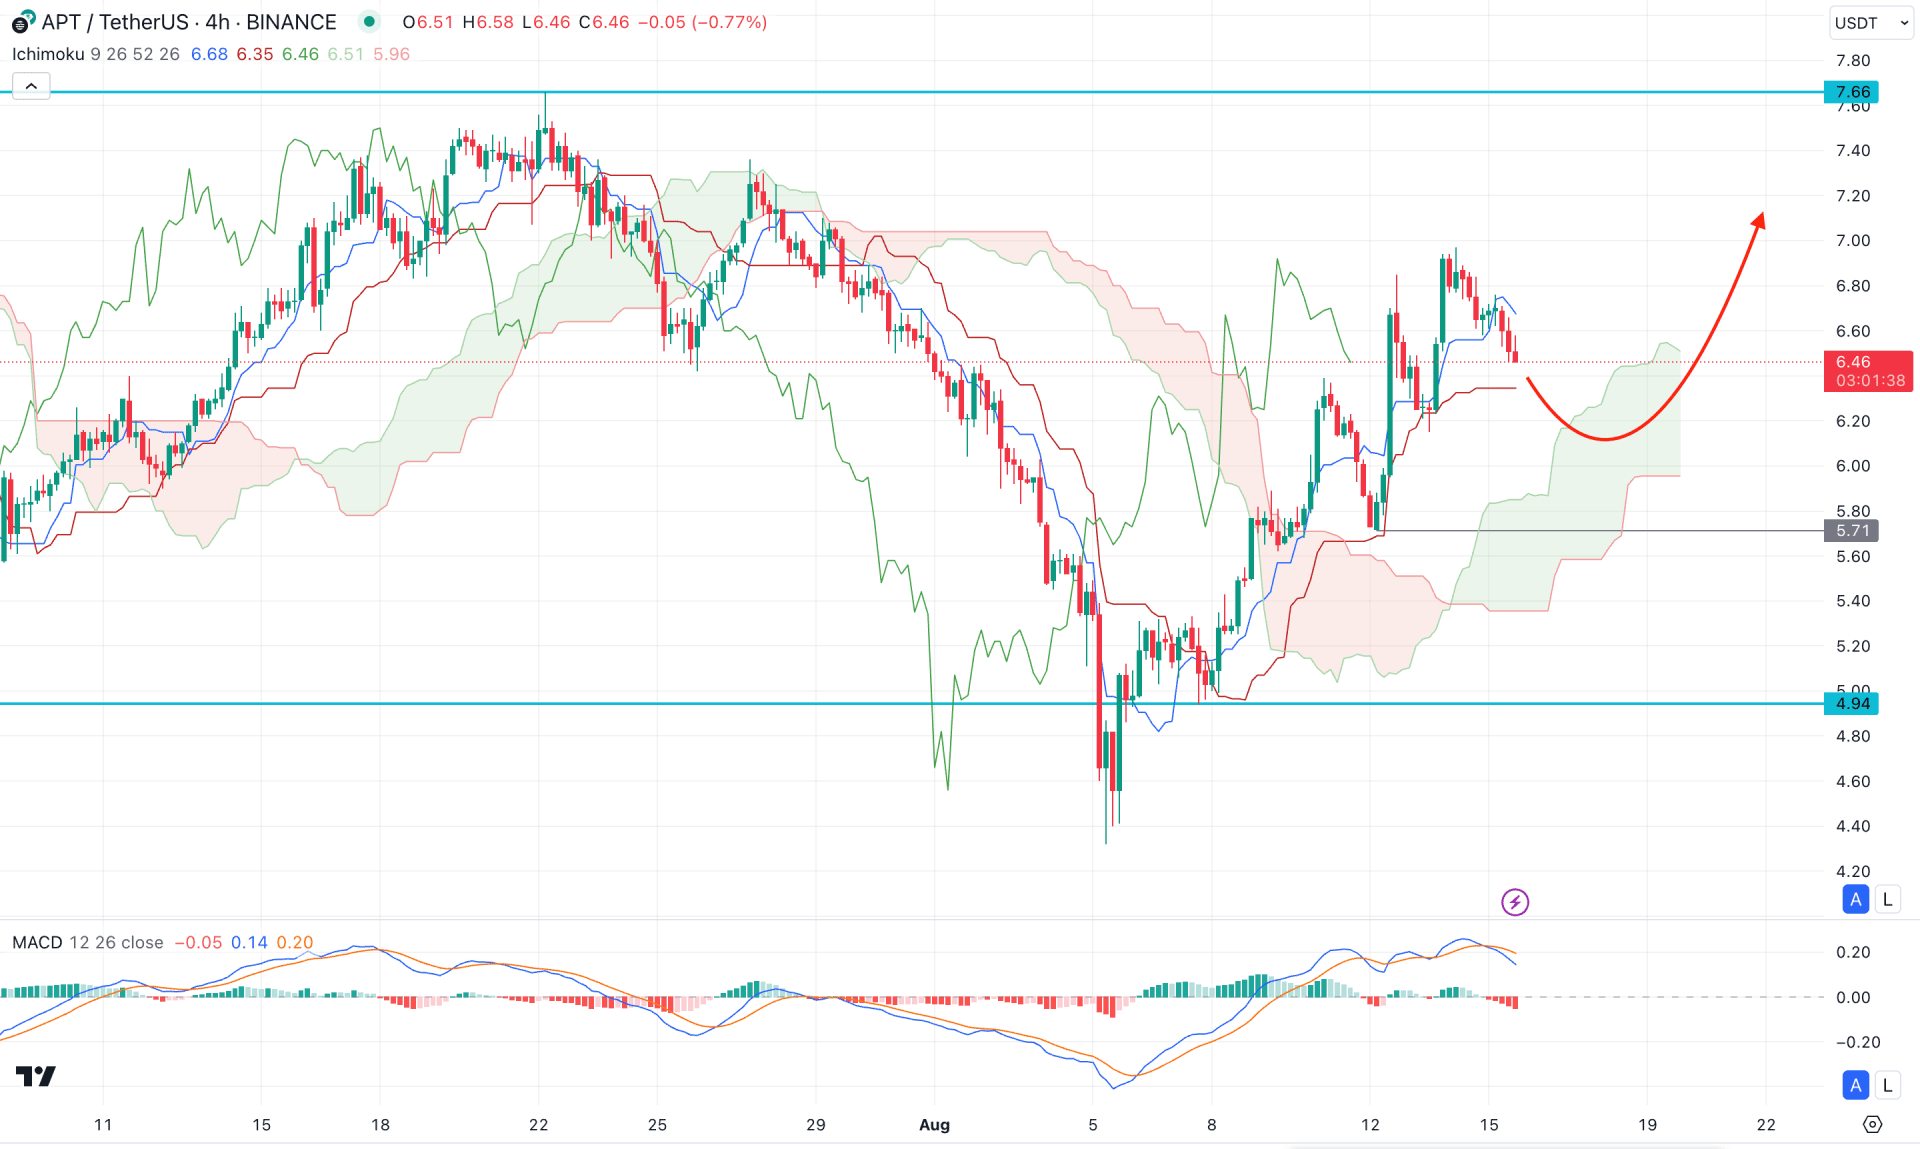
In the H4 timeframe, the recent price showed a bullish V-shape recovery and moved above the Cloud zone. It is a sign of a valid market reversal, from where a bullish signal might come from a valid price action formation.
In the secondary indicator window, the MACD Histogram remains below the neutral line, while the Signal line forms a bearish crossover. This is a sign of valid downside pressure in the market, from which a trend shift might need confirmation from the MACD indicator.
Based on this outlook, an extended bearish correction is possible, where the near-term support level is at 5.71. Primarily, a bullish rebound from the 6.000 to 5.700 zone could offer a long opportunity, aiming for the 7.800 psychological level.
The alternative approach is to find a bearish H4 candle below the 5.600 level, which could open the room to reach the 4.940 support line.

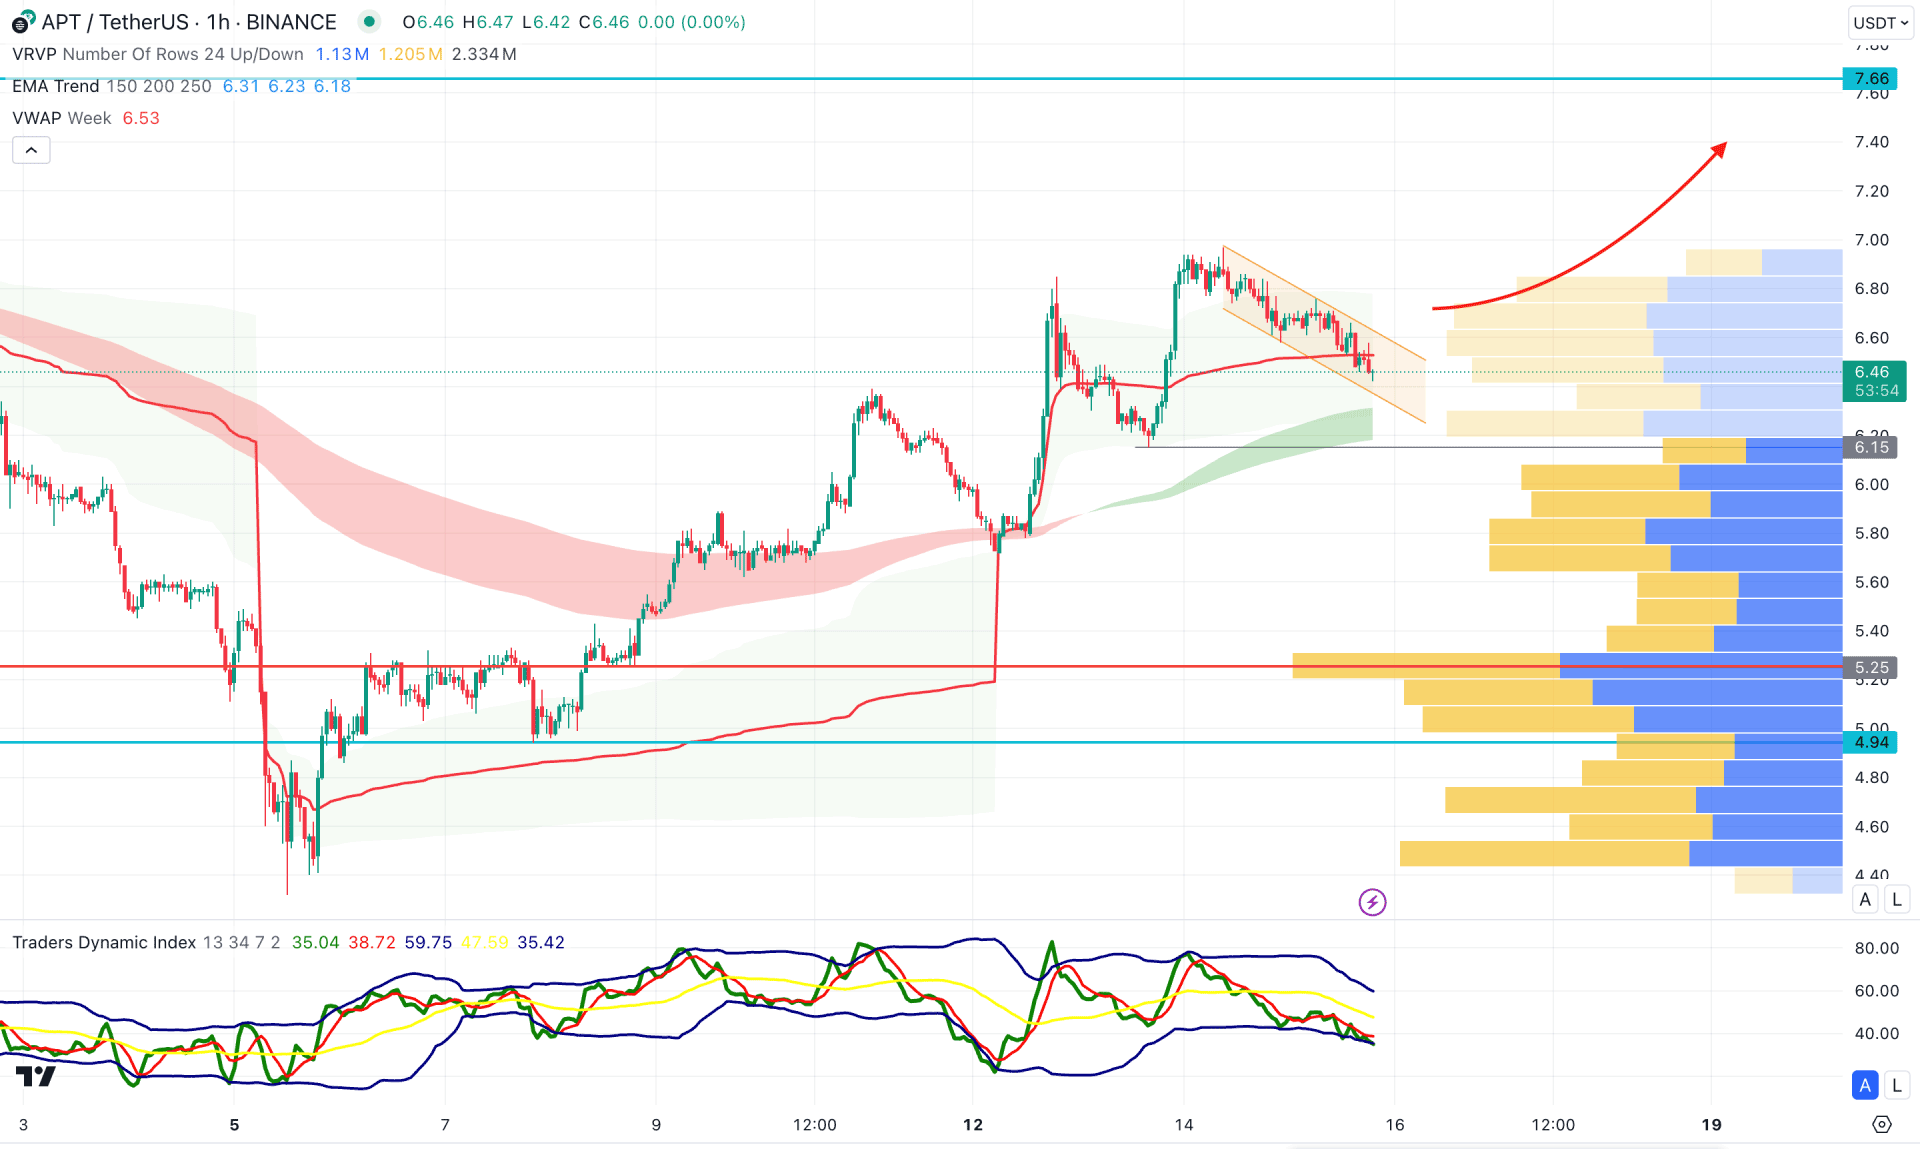
In the hourly time frame, the current price trades within a descending channel from where a valid breakout could be a long opportunity. Moreover, the immediate static support level is visible at the 6.150 level, supporting the buying possibility.
In the broader context, the MA wave remains steady below the current price, while the Traders Dynamic Index (TDI) is at the lower band area.
Based on this outlook, a downside correction is possible, but a valid bullish reversal from the 6.150 to 5.600 area could be a long opportunity, aiming for the 7.600 level.
Based on the current market structure, APTUSD bulls could join the market any time, where a valid break from the Wyckoff Spring could open a long opportunity. Investors should closely monitor the hourly price as a valid reversal from the near-term support level could provide an early signal.