
Published: August 5th, 2025
AppLovin reported $1.48 billion in revenue last quarter, rising 40.3% year over year and 7.3% above analysts' revenue projections. With EBITDA forecasts for the upcoming quarter surpassing analysts' expectations and a substantial beat of analysts' EBITDA projections, the company had a robust quarter.
Analysts predict that AppLovin's sales will increase 18% year over year to $1.27 billion this quarter, which would be a slowdown from the 44% gain it saw in the same period last year. It is anticipated that adjusted profit will be $2.32 per share.
Over the past 30 days, most analysts who follow the company have reaffirmed their projections, indicating that they expect the company to continue on its current trajectory as it reports its results. Over the past two years, AppLovin has exceeded top-line predictions by an average of 5.2% and just missed Wall Street's projections of revenue once.
We can get an idea of what to expect from AppLovin's competitors in the marketing and sales software market because several of them have already released their Q2 results. BigCommerce announced revenues increased 3.2%, exceeding projections by 1.3%, while Freshworks surpassed the expectations of analysts by 2.9% with year-over-year sales growth of 17.5%.
Concerns regarding the viability of the economy in 2025 have been highlighted by discussions surrounding potential tariffs and changes to corporate taxes. The group has fallen short overall, with its stock price down 3% per share over the past month, whereas some of the firms in marketing and sales software have performed well in this volatile environment.
Let's see the complete price prediction from the APP technical analysis:
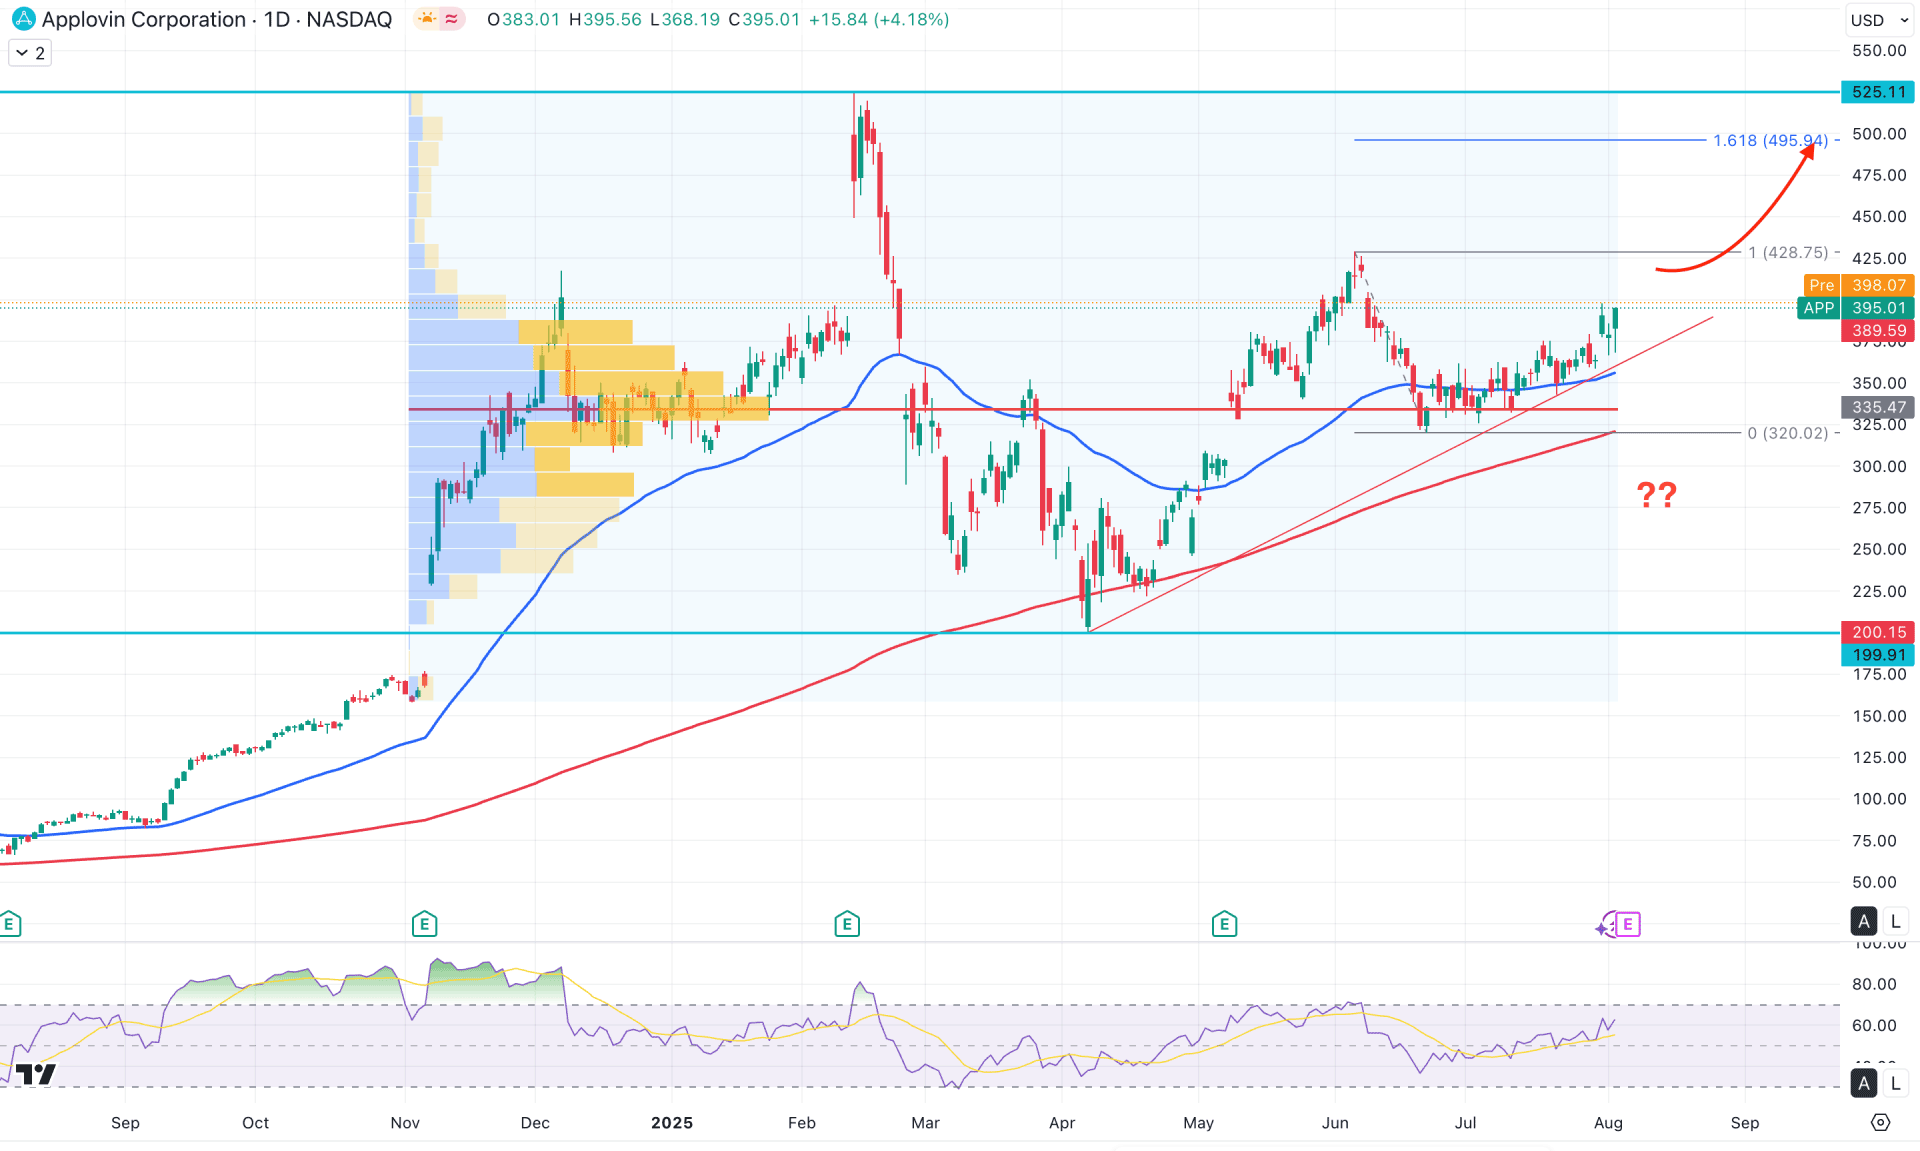
In the daily chart of APP stock, ongoing downside pressure is evident from the 525.11 top, from where a decent bullish recovery is possible. Investors should closely monitor how the near-term price action unfolds, as a solid buying pressure from a reliable support area is needed to anticipate a long approach.
Before identifying a trading opportunity, it is essential to analyse the higher timeframe price action to understand the overall market flow. Based on the monthly chart, the recent candle is trading at a resistance level after forming a valid bullish inside bar pattern. As the price hovers below the May 2025 high, a potential bullish breakout could validate the continuation of the long-term uptrend. Moreover, the weekly timeframe shows a diamond pattern, where a valid bullish trendline breakout is acting as a continuation signal.
In the daily chart, the most recent price action shows a valid recovery from the high-volume node, but the most actively traded level since November 2024 is at the 335.54 level. Primarily, a bullish rally is evident above this high-volume level, indicating a potential breakout.
On the other hand, the 200-day SMA remains steady below the key 320.00 support level, acting as a significant source of buying pressure. Following this sentiment, the 50-day exponential moving average is providing immediate support, helping maintain the buying momentum along a vertical trendline.
In other technical indicators, the Relative Strength Index (RSI) looks positive as it remains above the 50.00 neutral level. However, the 70.00 overbought threshold has not been reached in the past three months, suggesting further upside potential. The strength of the trend is supported by the Average Directional Index (ADX), which is currently hovering at 21.04 – above the satisfactory 20.00 level. As long as the ADX remains steadily upward, investors may expect the ongoing buying pressure to persist.
Based on the overall market outlook, the primary strategy for this stock is to look for long opportunities as long as the price remains supported by the rising moving averages. However, before entering any long positions, investors should closely monitor the price reaction at the 4.00 to 8.75 key resistance level. A bullish breakout above this zone would invalidate the consolidation pattern from June 2025 and signal the presence of strong upside liquidity. In that case, a fresh bullish signal may emerge, and the price could surpass the $5.00–$5.11 all-time high level.
On the downside, several support barriers exist below the near-term levels, with the 200-day simple moving average acting as the major floor. If a bearish breakout occurs below the trendline support and the price consolidates below the 320.02 level, a short opportunity could arise, targeting 200.15.
However, a valid liquidity zone is also present between the 280.00–220.00 area, making a bounce from this range possible. In that case, a valid recovery above the 50-day exponential moving average would be needed before attempting to break above the 500.00 psychological level.
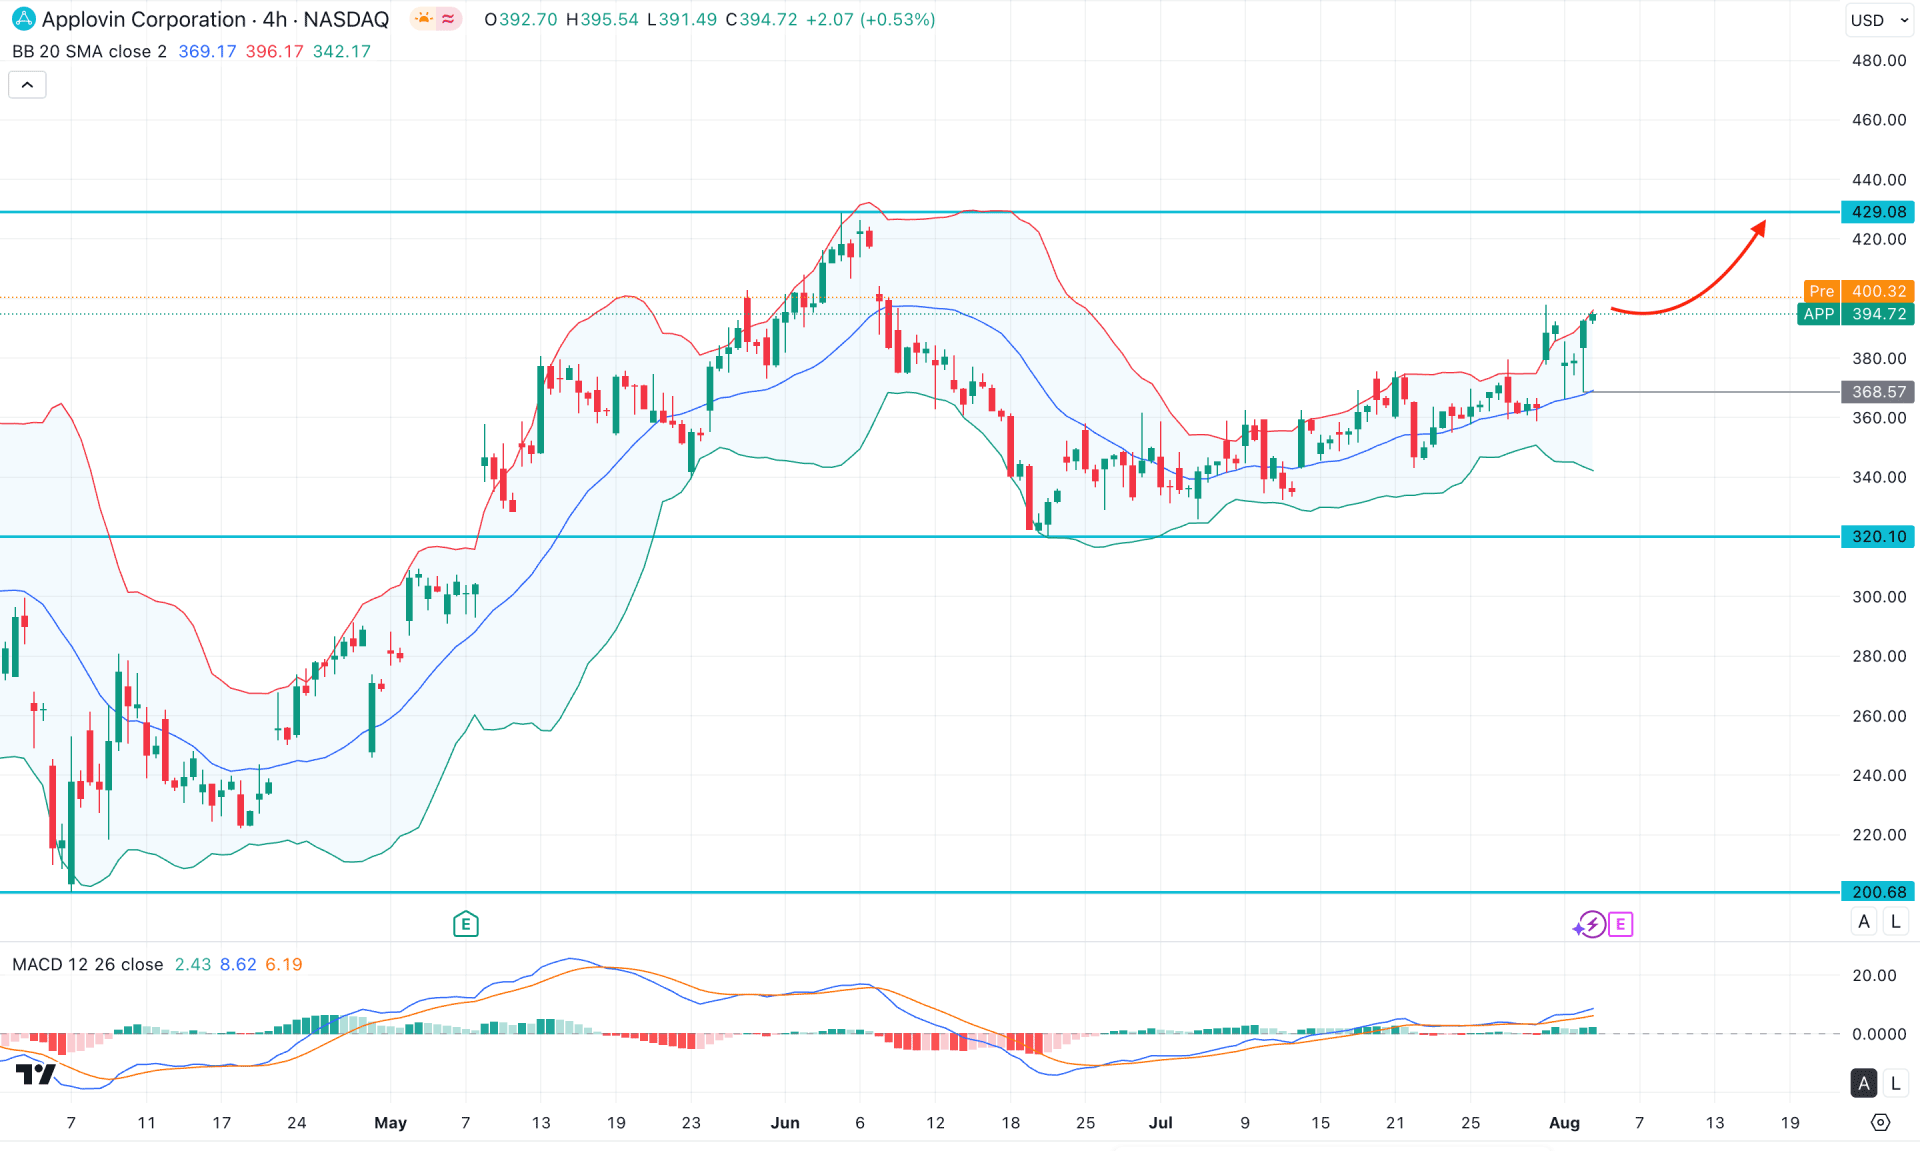
In the H4 timeframe, APP stock is trading within a corrective trend, with immediate resistance visible at the upper Bollinger Band. Although the price is facing resistance, the broader market outlook still requires a bullish confirmation.
In the secondary indicator window, the MACD histogram maintains a positive outlook, while the signal line is positioned above the neutral point. This indicates a corrective bullish trend, although signs of a potential top formation are emerging.
Based on the four-hour outlook, a minor downside correction is possible, as the price has reached the upper Bollinger Band resistance area. However, a bullish rebound remains likely as long as the mid-Bollinger Band remains untested.
In this scenario, the primary focus should be on seeking long opportunities, with the main target set at the 429.08 resistance level. On the other hand, a bearish discount is possible if the price fails to maintain momentum above the mid-Bollinger Band.
In that case, immediate support is located at the 320.10 level, with further downside potential toward the 300.00 psychological level.
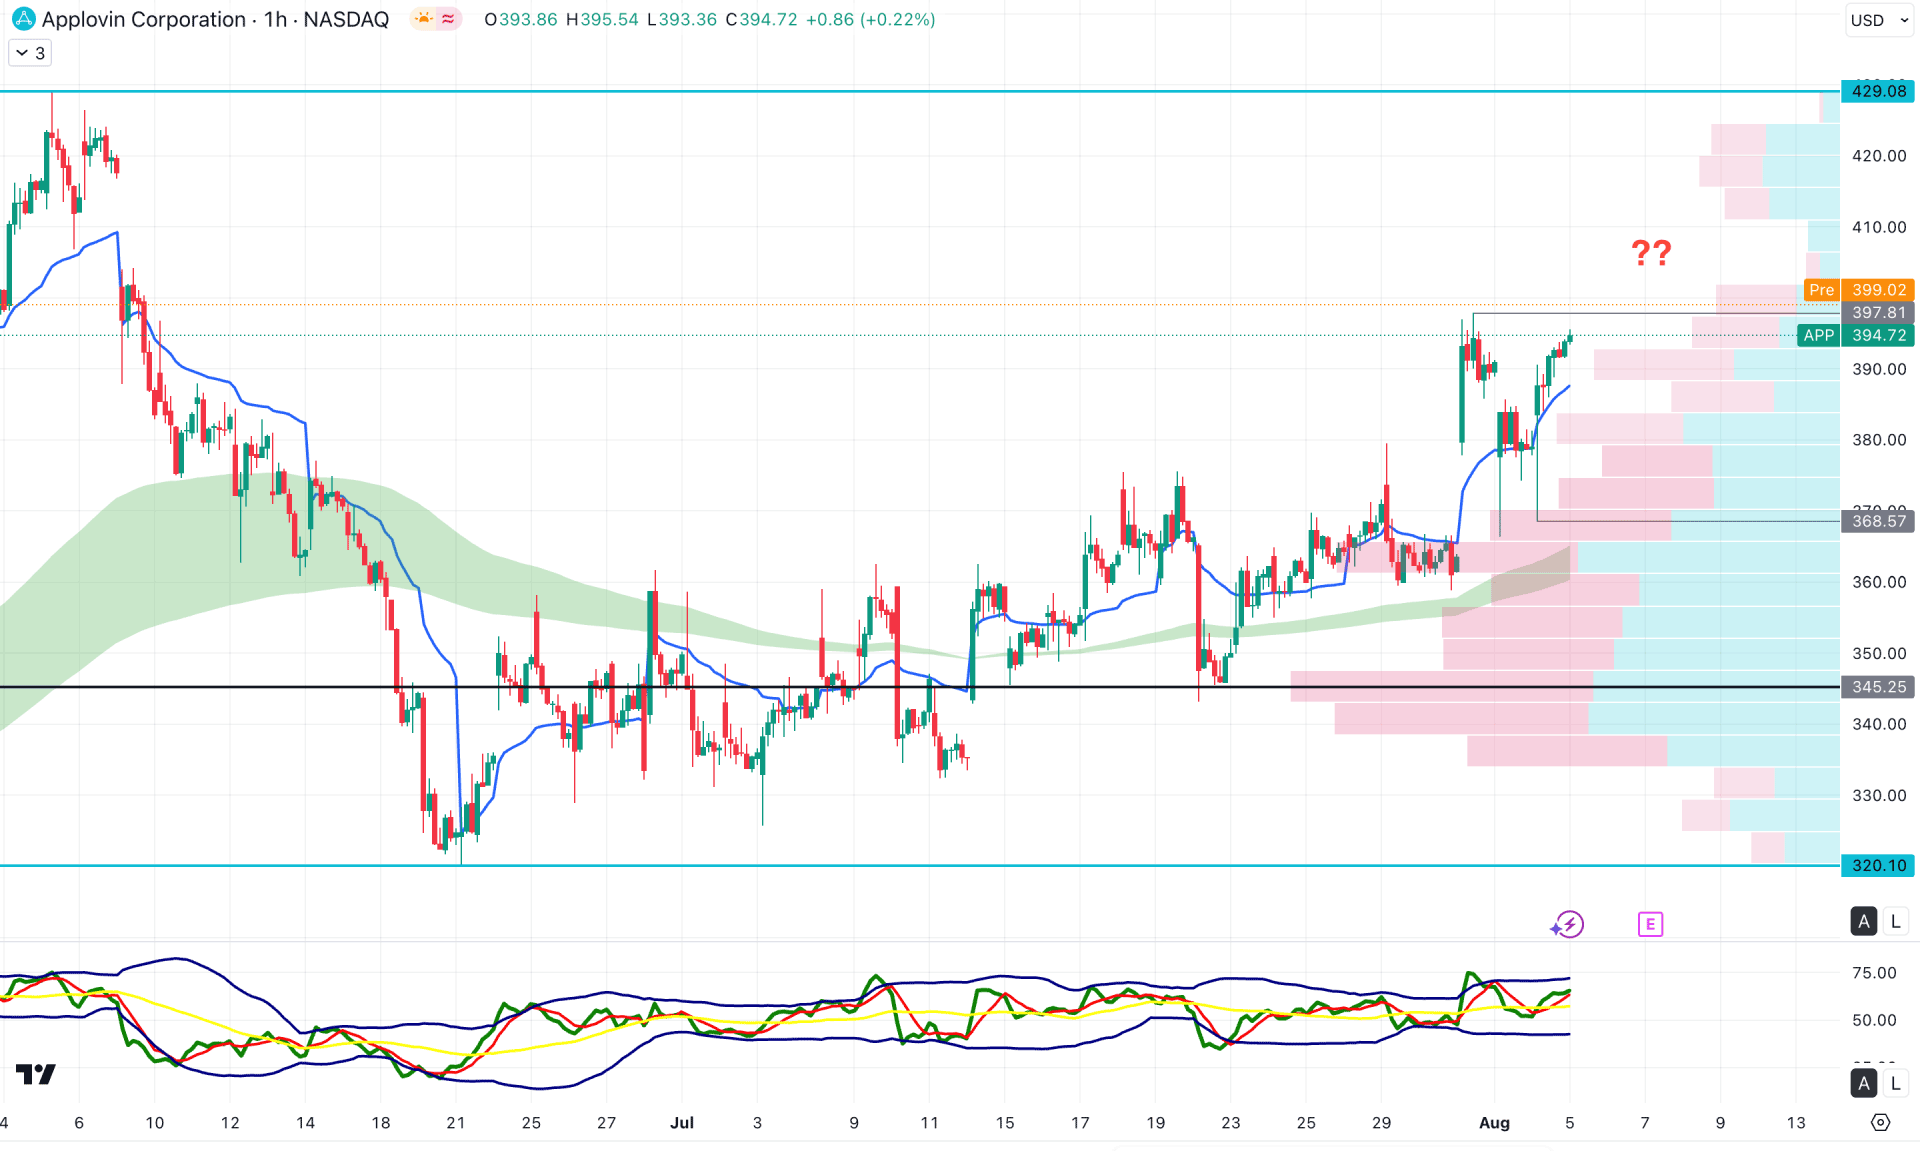
In the hourly timeframe, the current price is trading within a bullish momentum as the dynamic EMA wave is below the current price. Moreover, the intraday high volume line is hovering below the 360.00 low, suggesting a confluence of buying pressure.
In the secondary indicator window, the Traders Dynamic Index (TDI) remains above the 50.00 neutral line, suggesting buyers' presence in the market.
Based on the intraday market outlook, the price is facing resistance from the 397.81 high, which needs to be overcome before opening any long position.
Based on the broader market outlook, APP is trading within bullish pressure, where a fundamental push can take the price higher above the existing all-time high level. However, the intraday price is trading at the premium zone, from where a discounted level might be needed before going for a long approach.


