
Published: May 6th, 2026
The analysts' estimate for Applovin Corp's earnings for the upcoming quarter is $3.4, representing ϧa 103.6% increase over the quarter reported a year ago. With a consensus estimate of $1.77 billion, revenues are expected to expand by 19.5% annually.
Despite the stock's 24% decrease over the last six months compared to the industry's 8% decline, the sell-off was insufficient to support values. ARM is still trading at a forward twelve-month cost-to-earnings ratio of 27.19x, higher than the sector's average of 23.01x.
AppLovin's integrated marketplace continues to exhibit significant structural advantages. Strong operating momentum is being produced by the combination of Axon 2.0 model improvements and MAX's real-time bidding infrastructure. This has been clear since the final quarter of 2025, when management expressed optimism that sequential growth would continue.
The company's ability to raise conversion rates from historically low single-digit levels to a broader, more stable range remains a crucial long-term lever. Increasing the diversity of advertisers beyond gaming and continuous model improvement enhances this potential. AppLovin benefits from growing demand and advantageous take rates as more bidders join the ecosystem, positioning the platform for long-term monetisation gains and share growth.
Let's see the further outlook from the APP price analysis:
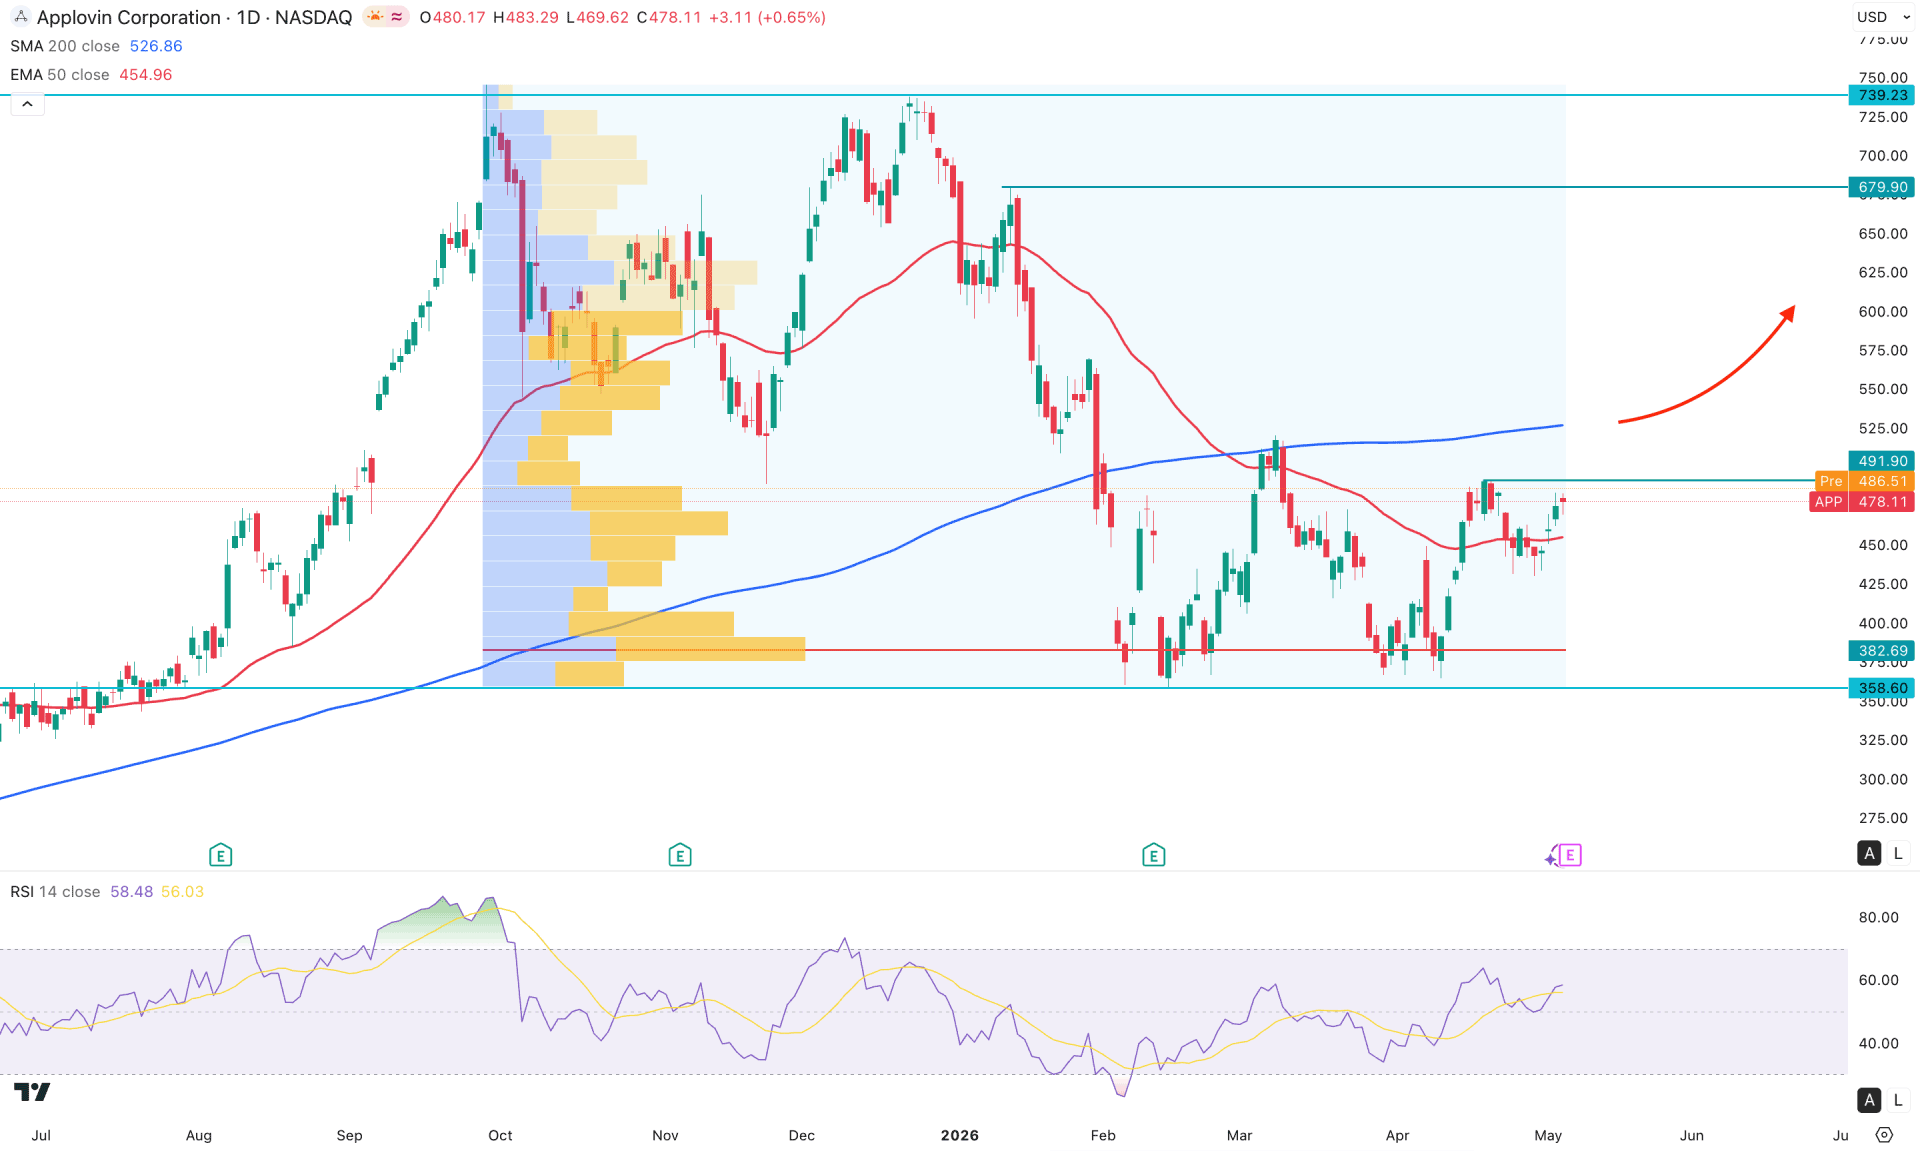
In the daily chart of Apple stock, a strong pump and dump is visible, and the most recent price is consolidating at the bottom with a possible bullish pre-breakout structure. As the recent price is holding momentum at the bottom with multiple failures to create a new swing low, the primary anticipation is to look for a bullish breakout.
Looking at the higher timeframe, strong bearish pressure is visible from the all-time high area, but the monthly chart suggests a valid bullish reversal candlestick at the 400.00 psychological area. As long as the most recent price trades above the existing monthly flip zone, a bullish continuation is highly possible. The weekly timeframe shows a different story, where sideways momentum is visible. A bullish push is needed above the weekly resistance level, which can validate the market reversal.
In terms of volume, sufficient orders are present below the current price, which signals active buying pressure in the market. As per the volume indicator, the largest activity level in October 2025 is at the 382.69 level, which is within the recent consolidation and below the current price. As the price has found multiple valid bullish reversals from this area, we may expect the price to move higher after getting valid confirmation.
In the main price chart, the 50-day EMA is holding the buying pressure, as multiple candles are present above this line. However, the 200-day SMA is still above the current price, and the momentum is flat.
In the secondary indicator, the Relative Strength Index is having a bullish rebound from the 50.00 neutral point. The existing momentum suggests a possibility of testing the 70.00 upper level.
Based on the current market outlook, the recent bullish rebound at the 491.59 level signals a possible cup and handle breakout. As the price is having a minor U-shaped rebound at the resistance area, a valid break with a daily close above the 491.90 level could increase the long possibility towards the 679.90 level. In that case, sustained buying pressure with consolidation above the 200 SMA could increase bullish momentum, targeting beyond the 739.29 level.
On the bear side, the price is still trading below the 200 SMA. Failure to hold the price above the 50-day EMA could increase the possibility of testing the 358.60 key support level. However, bearish impulsive pressure from the current price area, with a daily close below the 382.69 high volume level, might invalidate the bullish possibility and push the price towards the 250.00 level as a deeper correction.
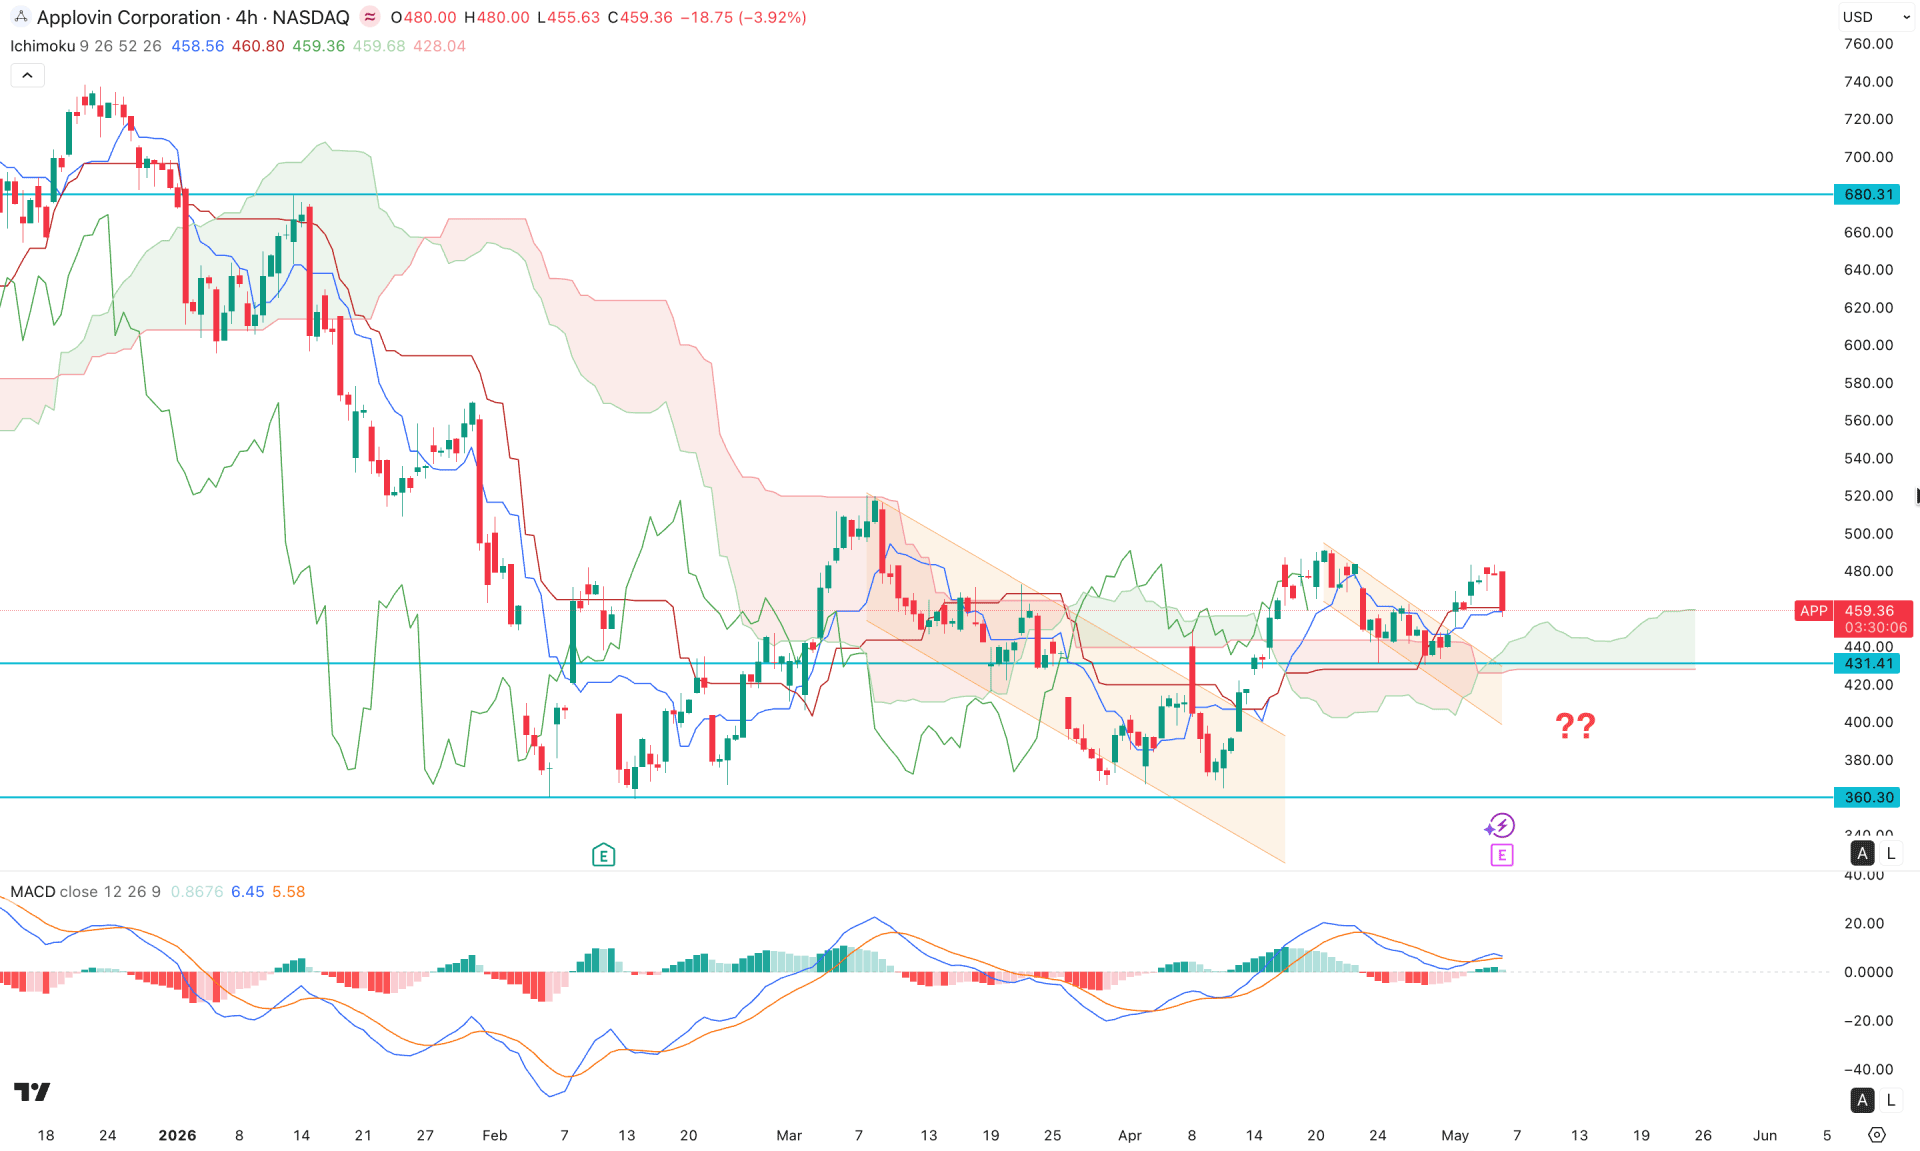
In the H4 timeframe of APP, the recent price shows a bullish break above the cloud area with a valid retest. As the most recent price is facing support from the dynamic line, investors should closely monitor how the price reacts at the cloud support.
In the future cloud, both lines are heading upward, which signals a possible bullish continuation. However, the existing market momentum is still bearish, so sufficient confirmation is needed before validating the bullish reversal.
The indicator window shows corrective market pressure, where the current MACD signal line is above the neutral area with an extremely sideways histogram.
Based on this outlook, a failure to hold the price above the 431.41 support level could take the price towards the 360.30 area. However, the 440.00 to 360.30 area would be a valid buy zone, as a bullish rebound with stable price action above the Kijun-sen level might open room for testing the 680.31 key resistance level.
However, a failure to hold the price at 360.30 could be an alarming sign for bulls, as the price may enter an extended downside correction.
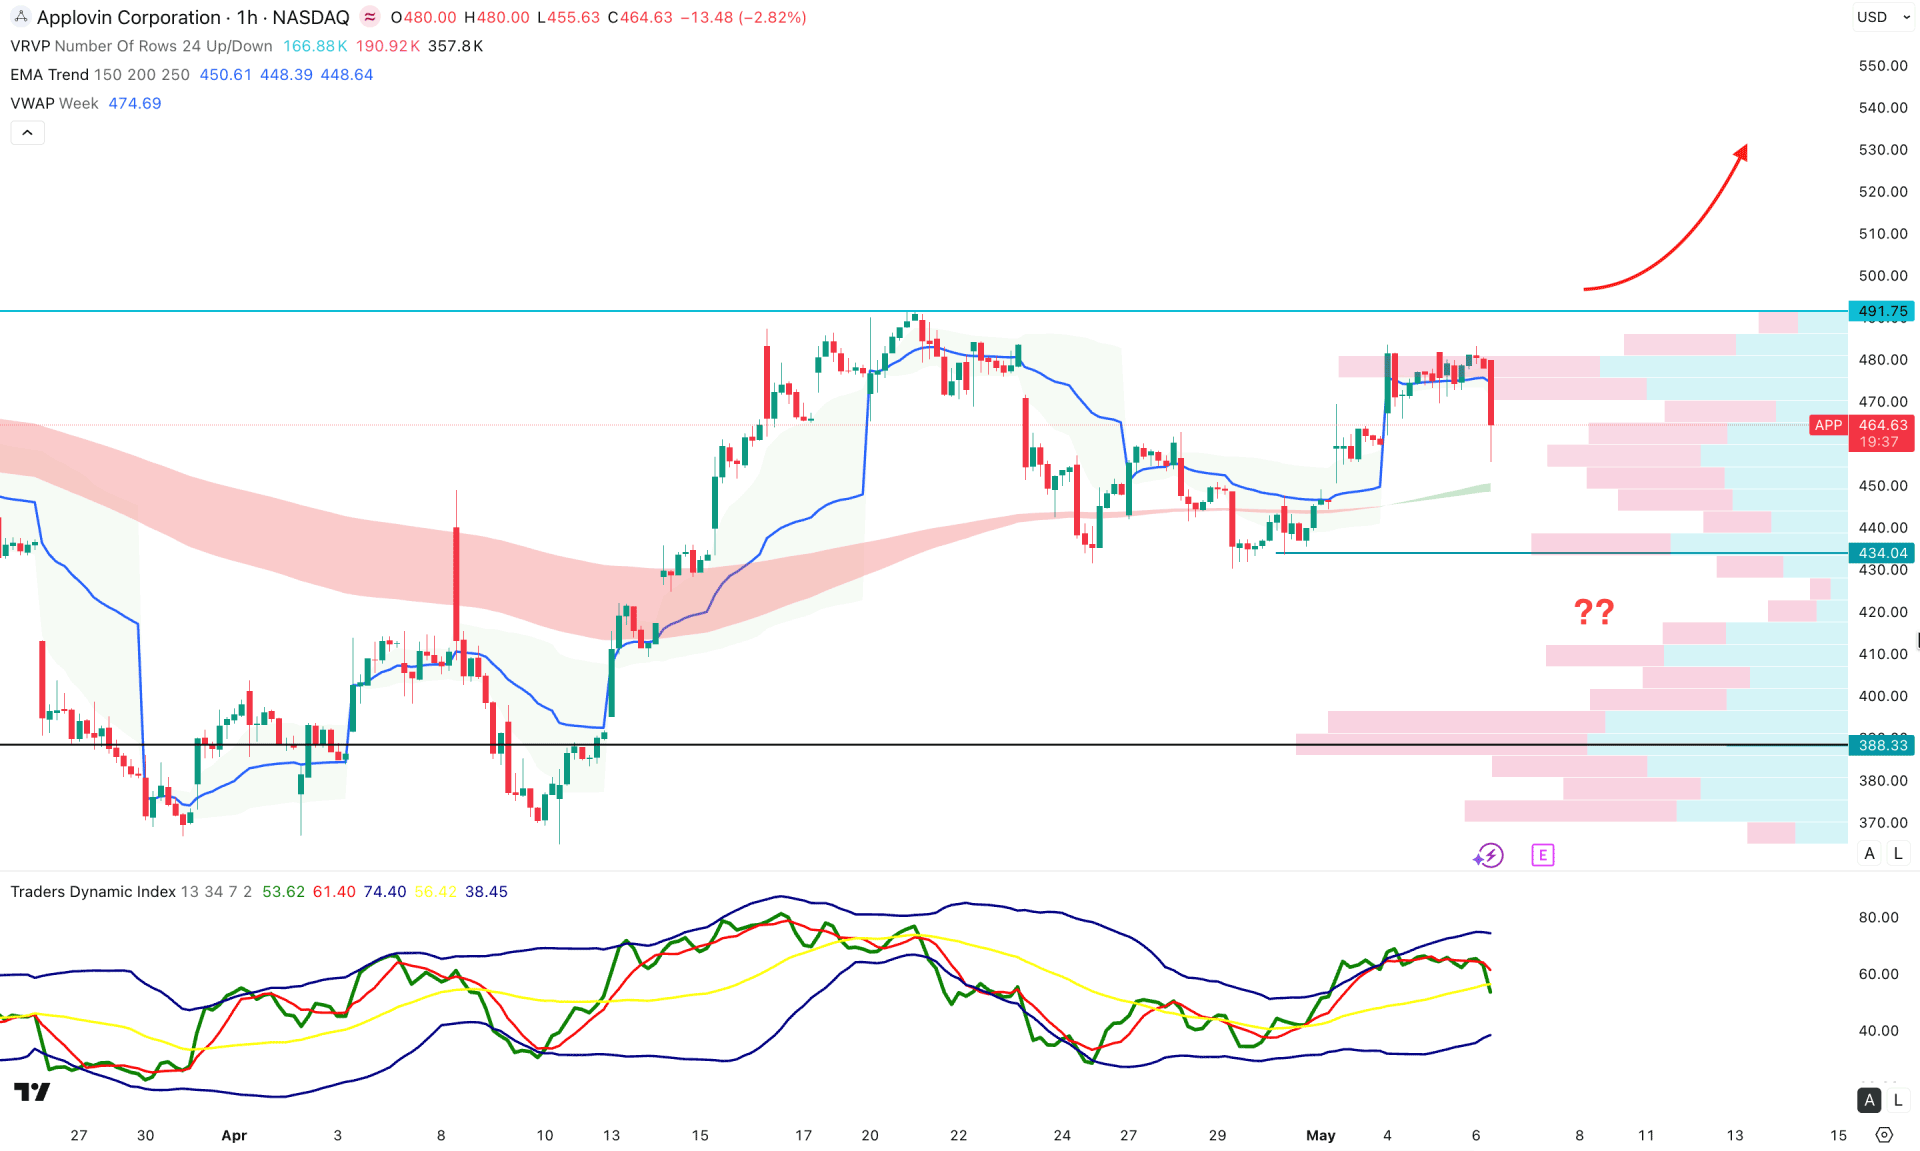
In the hourly timeframe, the APP price is trading within corrective momentum, and the most recent price is moving sideways in the intraday premium area. The high-volume line is far below the current price, indicating a possible mean-reversion scenario.
The indicator window shows a different story: the traders' dynamic index is trending downward from the midline, signaling selling pressure in the market.
Moreover, the Traders' Dynamic Index is sloping below the 50.00 neutral line, signaling a bearish attempt in the market.
Based on this outlook, the immediate support level is located at the 434.04 level, which could be tested before validating a long entry. In that case, any bullish rebound from the 434.04 to 388.33 area, with price staying above the VWAP line, could open room for a move toward the 500.00 level.
Moreover, any immediate bullish pressure that holds above the 500.00 psychological level could offer an immediate long opportunity.
Based on the overall market structure, APP is trading in an extreme bearish zone, from where a proper validation could resume the long-term bullish trend at any time. The price is forming a cup-and-handle pattern, but near-term resistance remains intact. A valid break with a daily candle above the near-term resistance could be a potential long opportunity, following the major market trend.


