
Published: November 4th, 2025
AppLovin could report revenue of $1.34 billion in the coming quarter, which would be a slower growth than the 38.6% gain it saw in the same period last year.
It is anticipated that adjusted earnings will be $2.49 per share. Over the past 30 days, the company's analysts have largely reaffirmed their projections, indicating that they expect the business to continue on its current trajectory as it enters results.
Over the past two years, AppLovin has twice fallen short of Wall Street's revenue projections. Share prices in the marketing and sales software sector have dropped 1.2% per share over the past month, giving investors a rather stable hand going into earnings.
As far as the price is appropriate, a corporation repurchasing its own shares might make a lot of sense when it has more money than it understands what to do.
Let's see the future outlook of this stock from the APP market analysis:
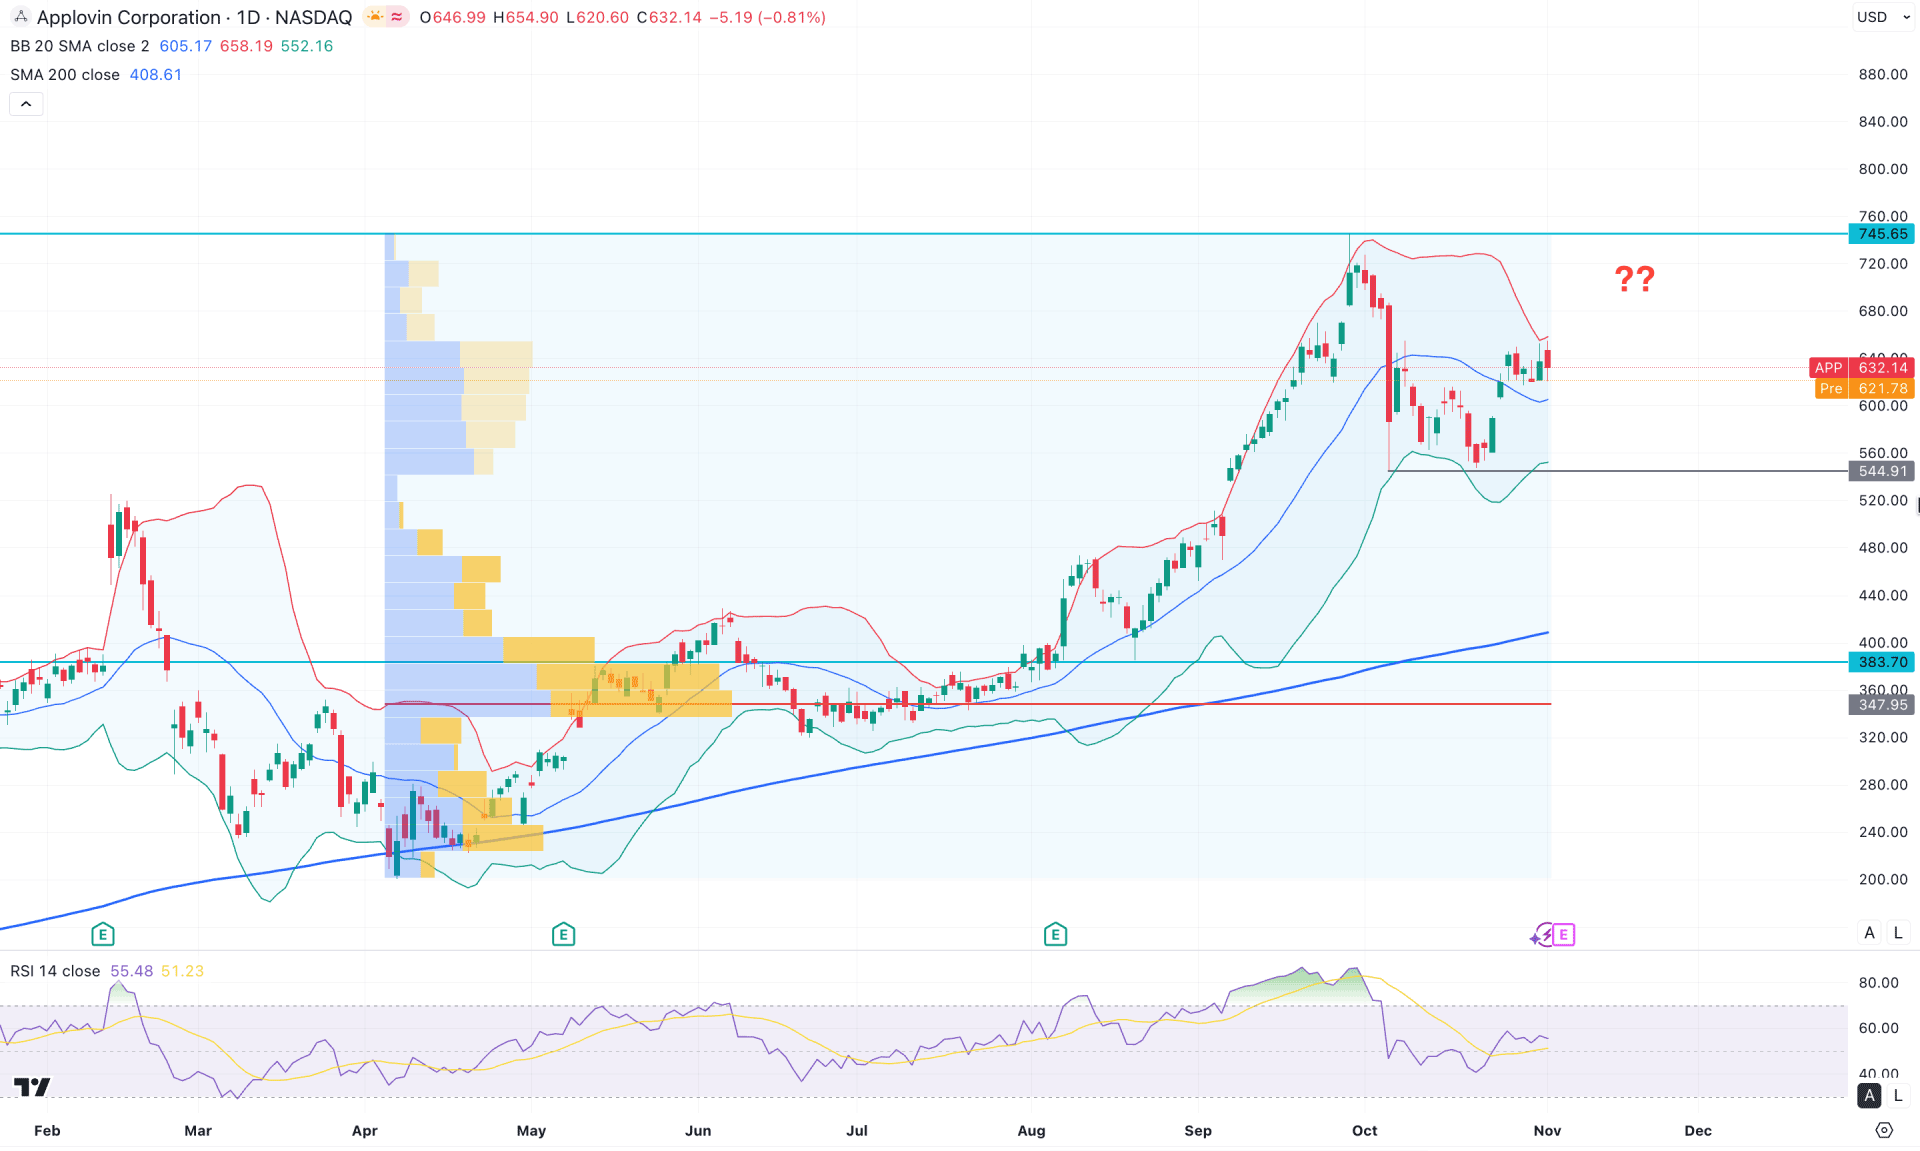
In the daily chart of APP, the overall market momentum is bullish as the price has been rising steadily since the beginning of 2025. After accumulating sufficient sell-side liquidity from March to May, the price continued to climb, reaching a new all-time high in September 2025. As the most recent price action is moving sideways after this peak, investors might anticipate a potential trend continuation opportunity.
Looking at the higher timeframe, the sideways market momentum is evident in the monthly chart. A clearer structure is visible on the weekly timeframe, where the price is consolidating within a rectangle pattern. In this case, a bullish rebound from the 549.12 level could validate a long opportunity once a rectangle pattern breakout occurs.
In terms of volume, market momentum remains strong, as the largest activity zone since April 2025 lies well below the current price. However, a minor downside correction is still pending as a mean reversion, given that the upper boundary is almost 45% above the current level.
On the main price chart, a solid support base has formed around the 544.91 level, from which bullish momentum previously resumed. In the most recent chart, a bullish recovery is clearly visible above the mid-band internal line, suggesting persistent buying pressure in the market. Moreover, the 200-day simple moving average continues to rise, crossing above the high-volume zone, which further indicates major bullish strength.
In the secondary indicator window, the Relative Strength Index (RSI) remains sideways just above the 50.0 level, indicating a neutral phase. However, a closer consolidation may be needed before a renewed buying impulse can be confirmed.
Based on the market structure, a minor downward correction is still pending, with immediate support expected near the 600.00 level. As long as the price holds above the 544.91 level, investors may anticipate a bullish continuation. On the upside, the immediate resistance to watch is around 720.00, followed by the 800.00 level or higher.
An alternative trading approach would be to look for a failure to hold above the mid-band line, which could increase the likelihood of a retest toward the 544.59 level. Below this support, a strong imbalance zone exists, which might be filled if the price drops to test the 200-day simple moving average, currently around the 400.00 area.
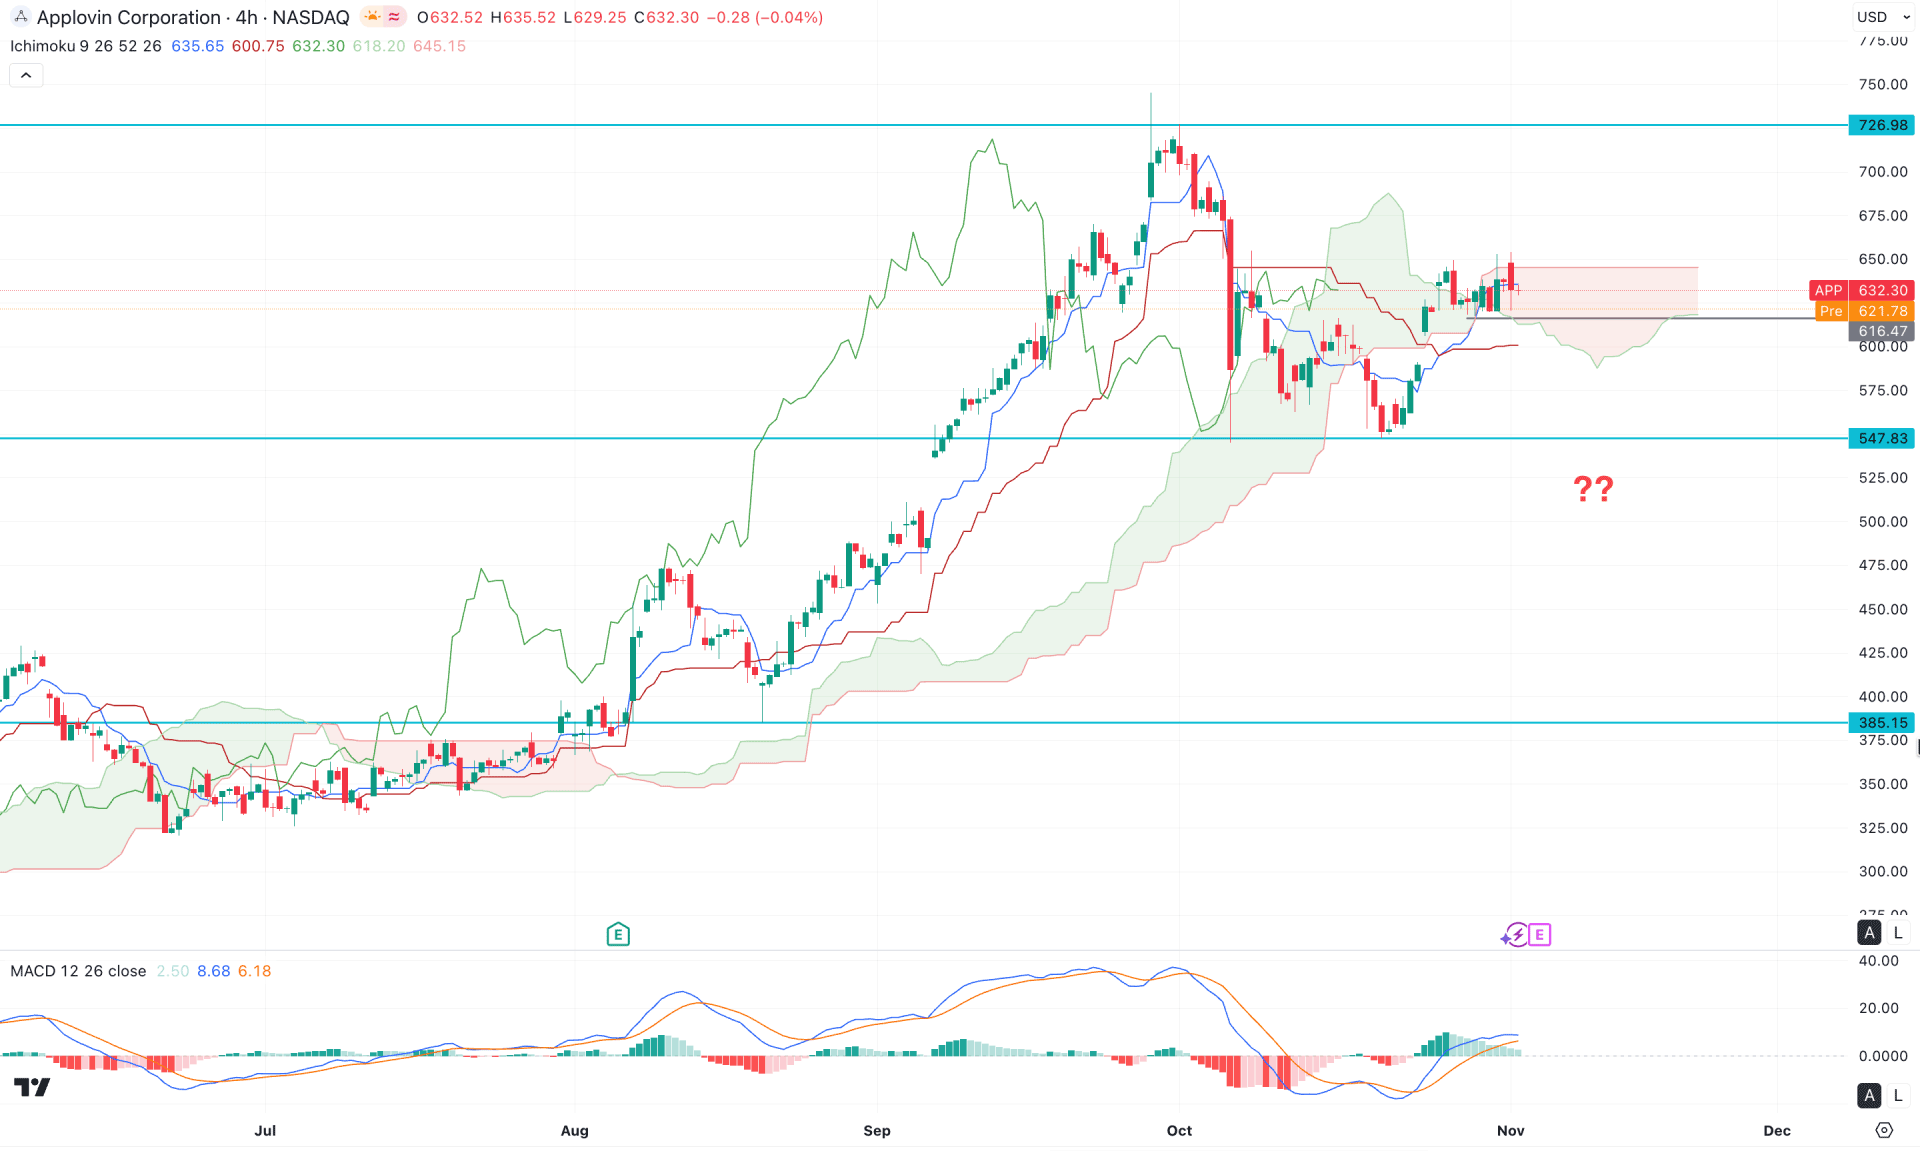
In the four-hour timeframe, the APP stock is trading sideways within the Ichimoku cloud area, where the future cloud also indicates a neutral to sideways momentum.
In the secondary indicator window, the MACD histogram has started to lose its bullish pressure and is nearing the neutral zone. Moreover, the signal line has reached a peak, and a bearish crossover is pending in the positive zone before any significant selling pressure can be anticipated on the main chart.
Based on the market structure, a failure to hold above the 616.47 level could present a potential short opportunity, with the ultimate downside target set at 547.83, and an extended move possibly reaching the 400.02 area.
Alternatively, a bullish trading approach could be to look for another swing high formation above the 650.00 level, where the next upside target would be around 726.96.
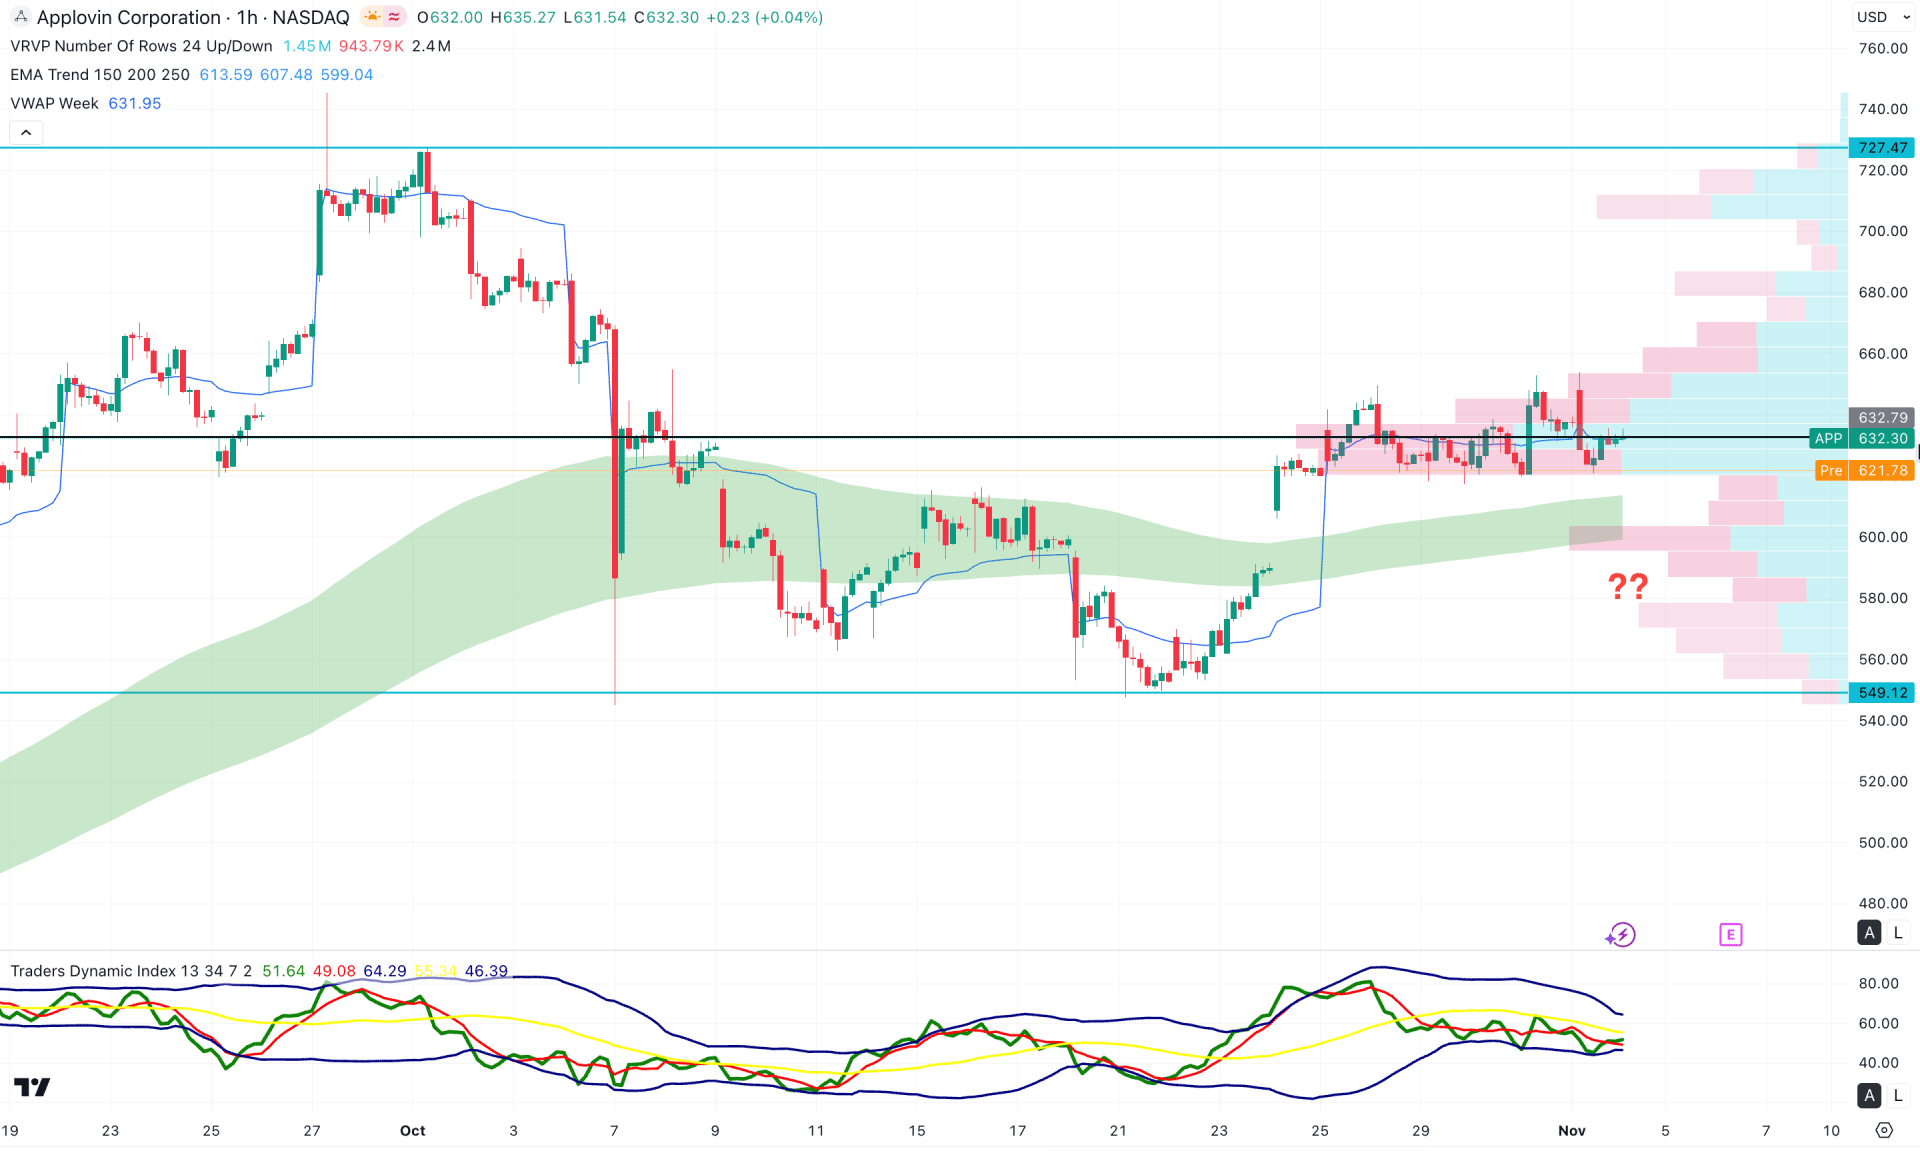
In the hourly timeframe, the bullish momentum is also evident, as the current price is trading in line with the internal high level. Moreover, the traders' dynamic index (TDI) indicates a bullish bias, with the current line hovering just below the 50.00 neutral zone.
Based on this outlook, a bullish breakout, supported by the rising exponential moving average (EMA) wave, could offer a potential long opportunity targeting the 727.47 level. In that case, buying pressure above the 660.00 level would be crucial to confirm further upside momentum.
On the other hand, a failure to hold above the 600.00 psychological level could be a bearish signal, as it may extend the downside correction toward the 549.12 level.
Based on the market structure, APP is more likely to extend its bullish momentum, supported by strong buying pressure. As the internal price consolidates, a potential long opportunity may emerge once a range breakout occurs.


