
Published: May 14th, 2025
Applied Materials' state-of-the-art logic, high-performance DRAM, compute memory, stacking technology, and sophisticated packaging can allow it to benefit from the increasing use of artificial intelligence (AI).
The company's Semiconductor Systems division is expected to perform better in the financial second quarter due to the rising demand for advanced chips needed to power AI-centric data centers.
On the other hand, growing hostilities between the US and China are not good for semiconductor firms. This probably hampered the segment's top-line growth. Other obstacles probably included supply-chain limitations and shifts in the purchasing habits of important clients. The business projects Semiconductor Systems' sales to reach $5.3 billion in the second period of fiscal 2025. At $5.3 billion, analysts estimate represents an 8.2% increase over the actual for the same quarter last year.
The increasing use of OLED screens and increased equipment revenues to Chinese LCD producers may have helped Applied Materials' Display and nearby market division sales. It estimates this division will generate about $250 million in revenue in the second quarter. The second-quarter revenues of the Display and Nearby Markets sector are also expected to reach $250 million, representing a 39.8% rise over the previous year.
With a future of a year of price-to-sales (P/S) of 4.6X versus the industry average of 7.51X, AMAT is now trading at a discount.
Additionally, AMAT will benefit from the demand for semiconductors generated by AI. The business has achieved great advancements in producing advanced chips, especially in high-bandwidth memory, gate-all-around (GAA) transistors, and sophisticated packaging. These developments are essential for enabling quicker and less energy-consuming AI processing.
Let's see the further outlook of this stock from the AMAT technical analysis:
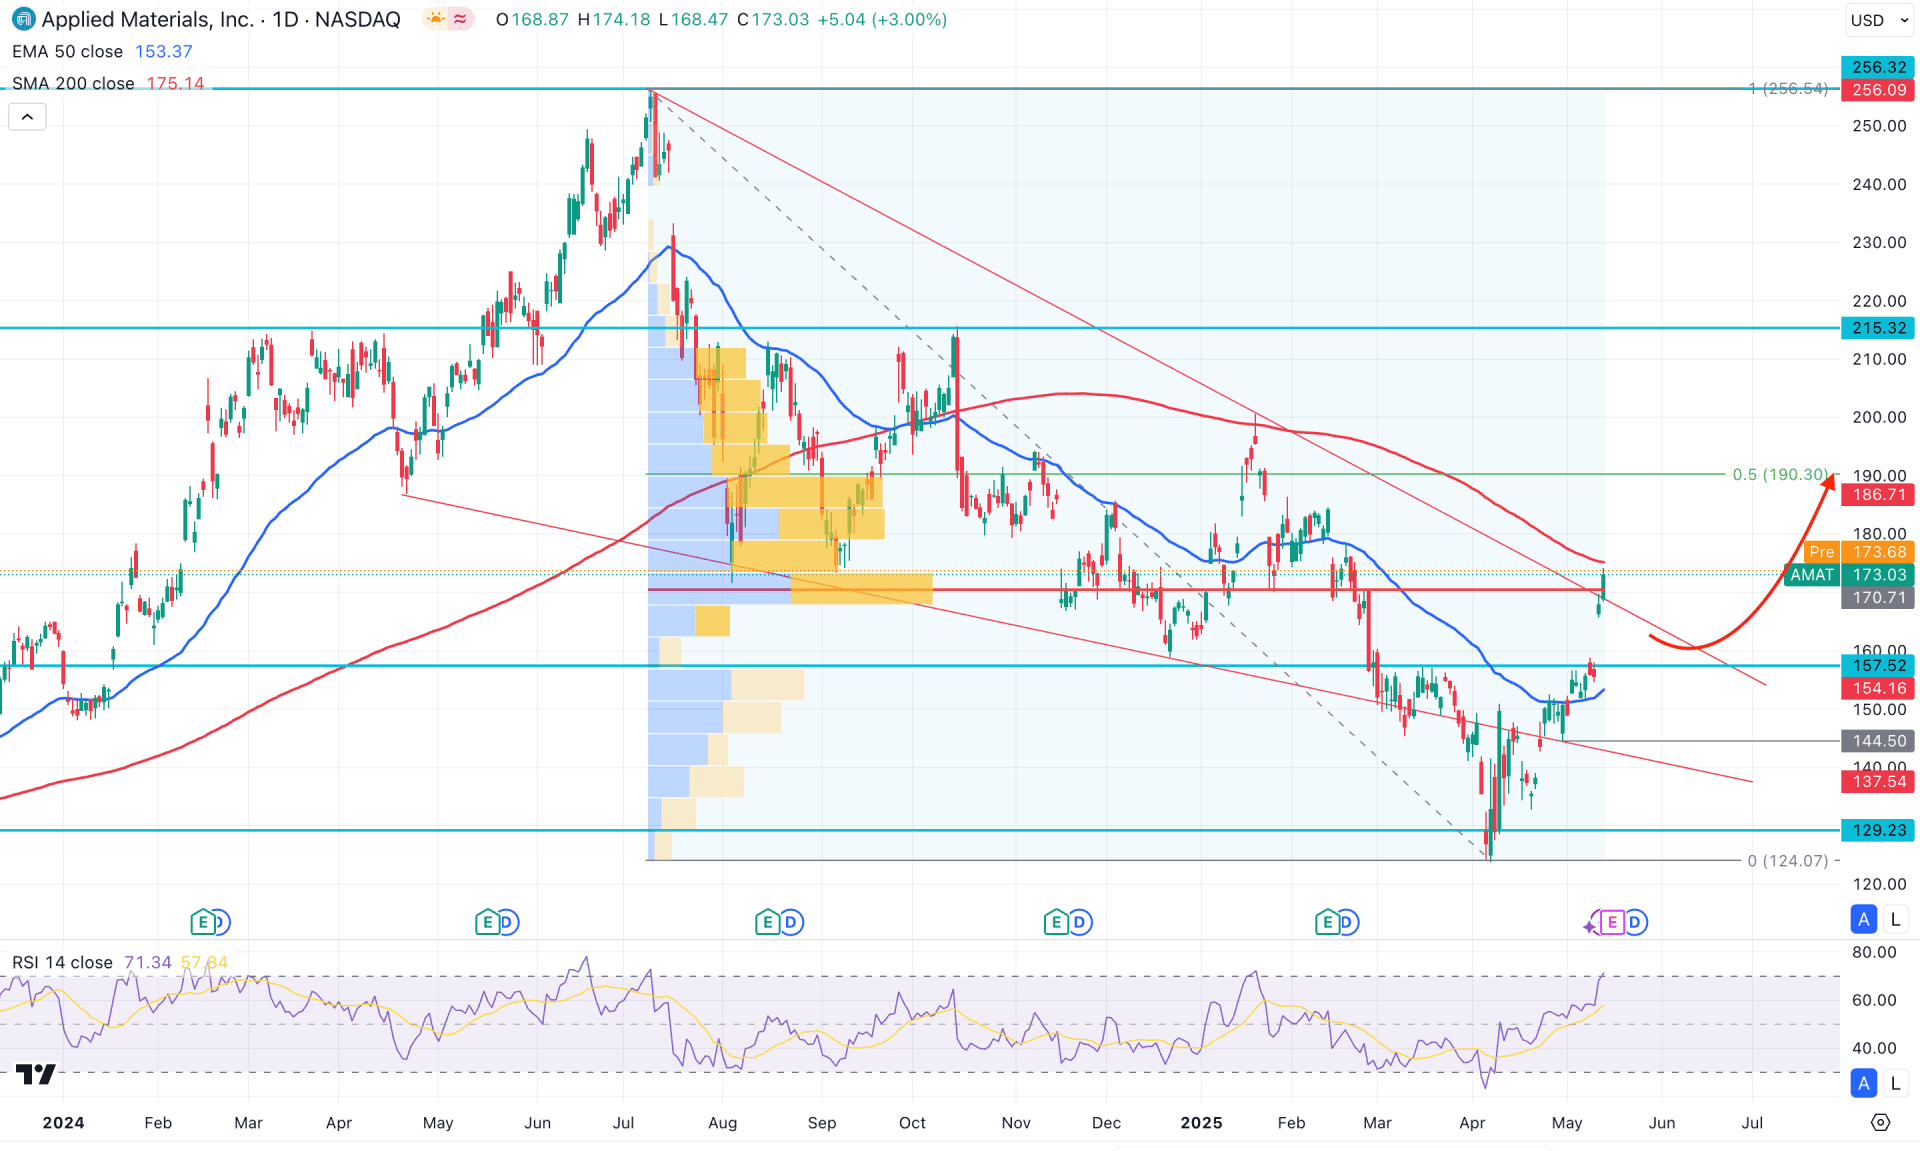
The recent price pattern on the daily chart of AMAT suggests a potential bullish reversal from the wedge breakout, although a valid confirmation is still pending. On the higher time frames, bullish momentum remains strong, as the latest monthly candle formed a hammer at the yearly low. A valid bullish rebound is also visible on the weekly chart, indicating a likely continuation.
Regarding volume structure, the bullish possibility is moderate, as the highest activity level since July 2024 is at the 170.71 level. Therefore, investors should monitor how the price reacts around this high-activity area, where the primary expectation is a bullish range breakout that could extend the current uptrend.
On the daily chart, a bullish V-shaped recovery has pushed the price above the 50-day EMA, suggesting a potential trend reversal. Additionally, the 200-day SMA stands as the immediate resistance level, at the high-volume area.
Looking at the Relative Strength Index (RSI), the price is currently trading in the overbought zone, with the RSI line finding resistance at the 70.00 level.
Considering the overall structure, a bullish recovery has formed, but further confirmation is needed before entering a long position. Currently, the price is still trading below the 200-day moving average, indicating a moderate chance of a downside correction. In that case, any reversal from the 174.00 to 186.71 area with a daily close below the 200-day SMA could signal a short opportunity, targeting the 157.57 level.
On the other hand, the long-term outlook remains bullish, supported by the hammer candlestick formation on the monthly chart. Furthermore, a breakout with a daily correction at the wedge resistance would signal renewed buying pressure. In this scenario, any bullish reversal from the 165.00–174.16 area could present a long opportunity, aiming for the 256.09 resistance level.
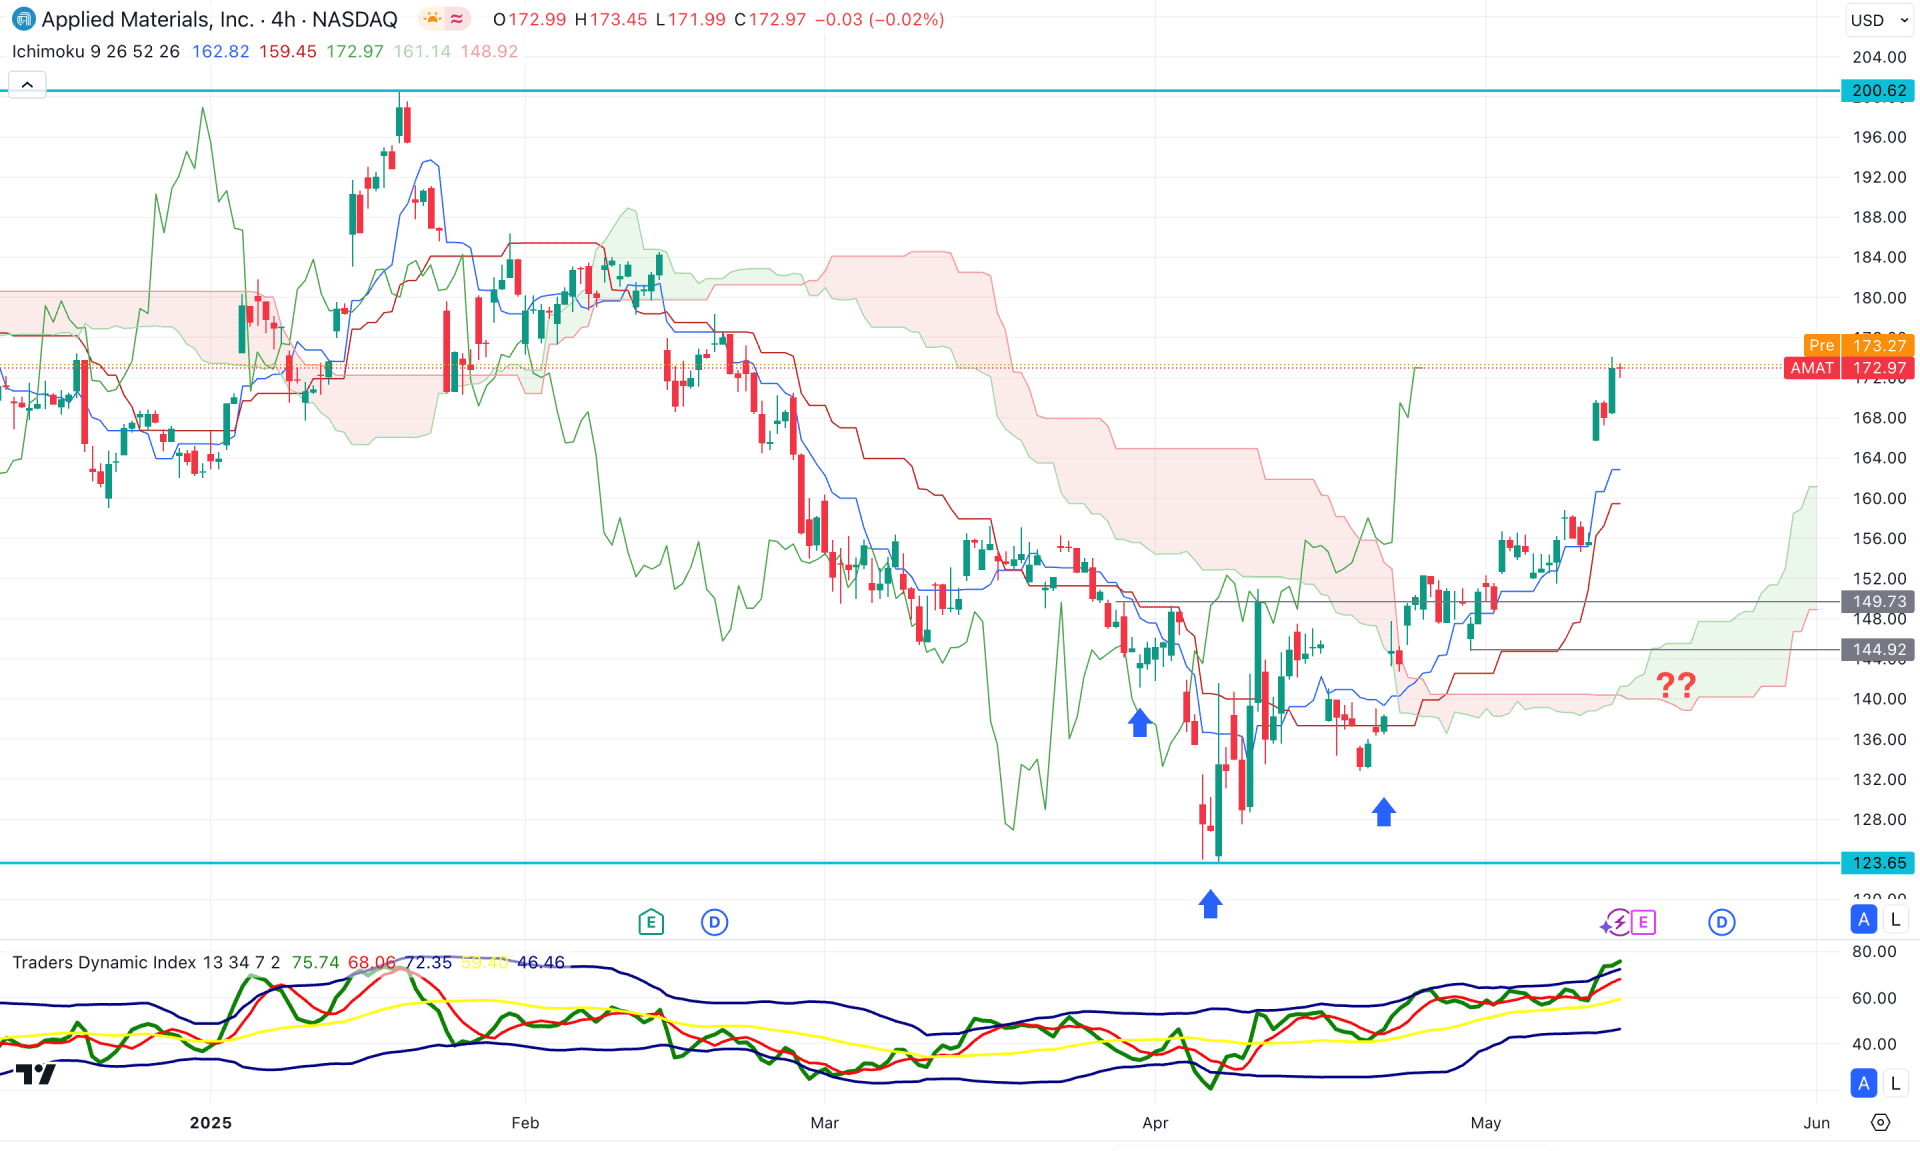
In the H4 chart of AMAT, the recent price showed a solid bottom from where a valid bullish rebound is visible. Moreover, a bullish breakout above the Ichimoku Kumo Cloud is visible, which is an additional bullish signal.
In the indicator window, the Traders Dynamic Index (TDI) has reached the highest level in a month, suggesting an extreme buying pressure. However, a bearish rebound below the 50.00 TDI line could signal a downside recovery from the top.
Based on this outlook, the current price is overextended above the dynamic Kijun Sen support, from where a decent bearish recovery is pending. In that case, a bearish H4 candle below the 157.89 gap support could be a short opportunity, aiming for the 140.00 level. Moreover, a bearish price action below the Kumo Cloud level could be a bearish continuation signal aiming for the 123.69 support level.
On the other hand, a rebound from the dynamic Kijun Sen support with a bullish reversal candlestick formation could be a potential long opportunity, aiming for the 200.00 psychological line.
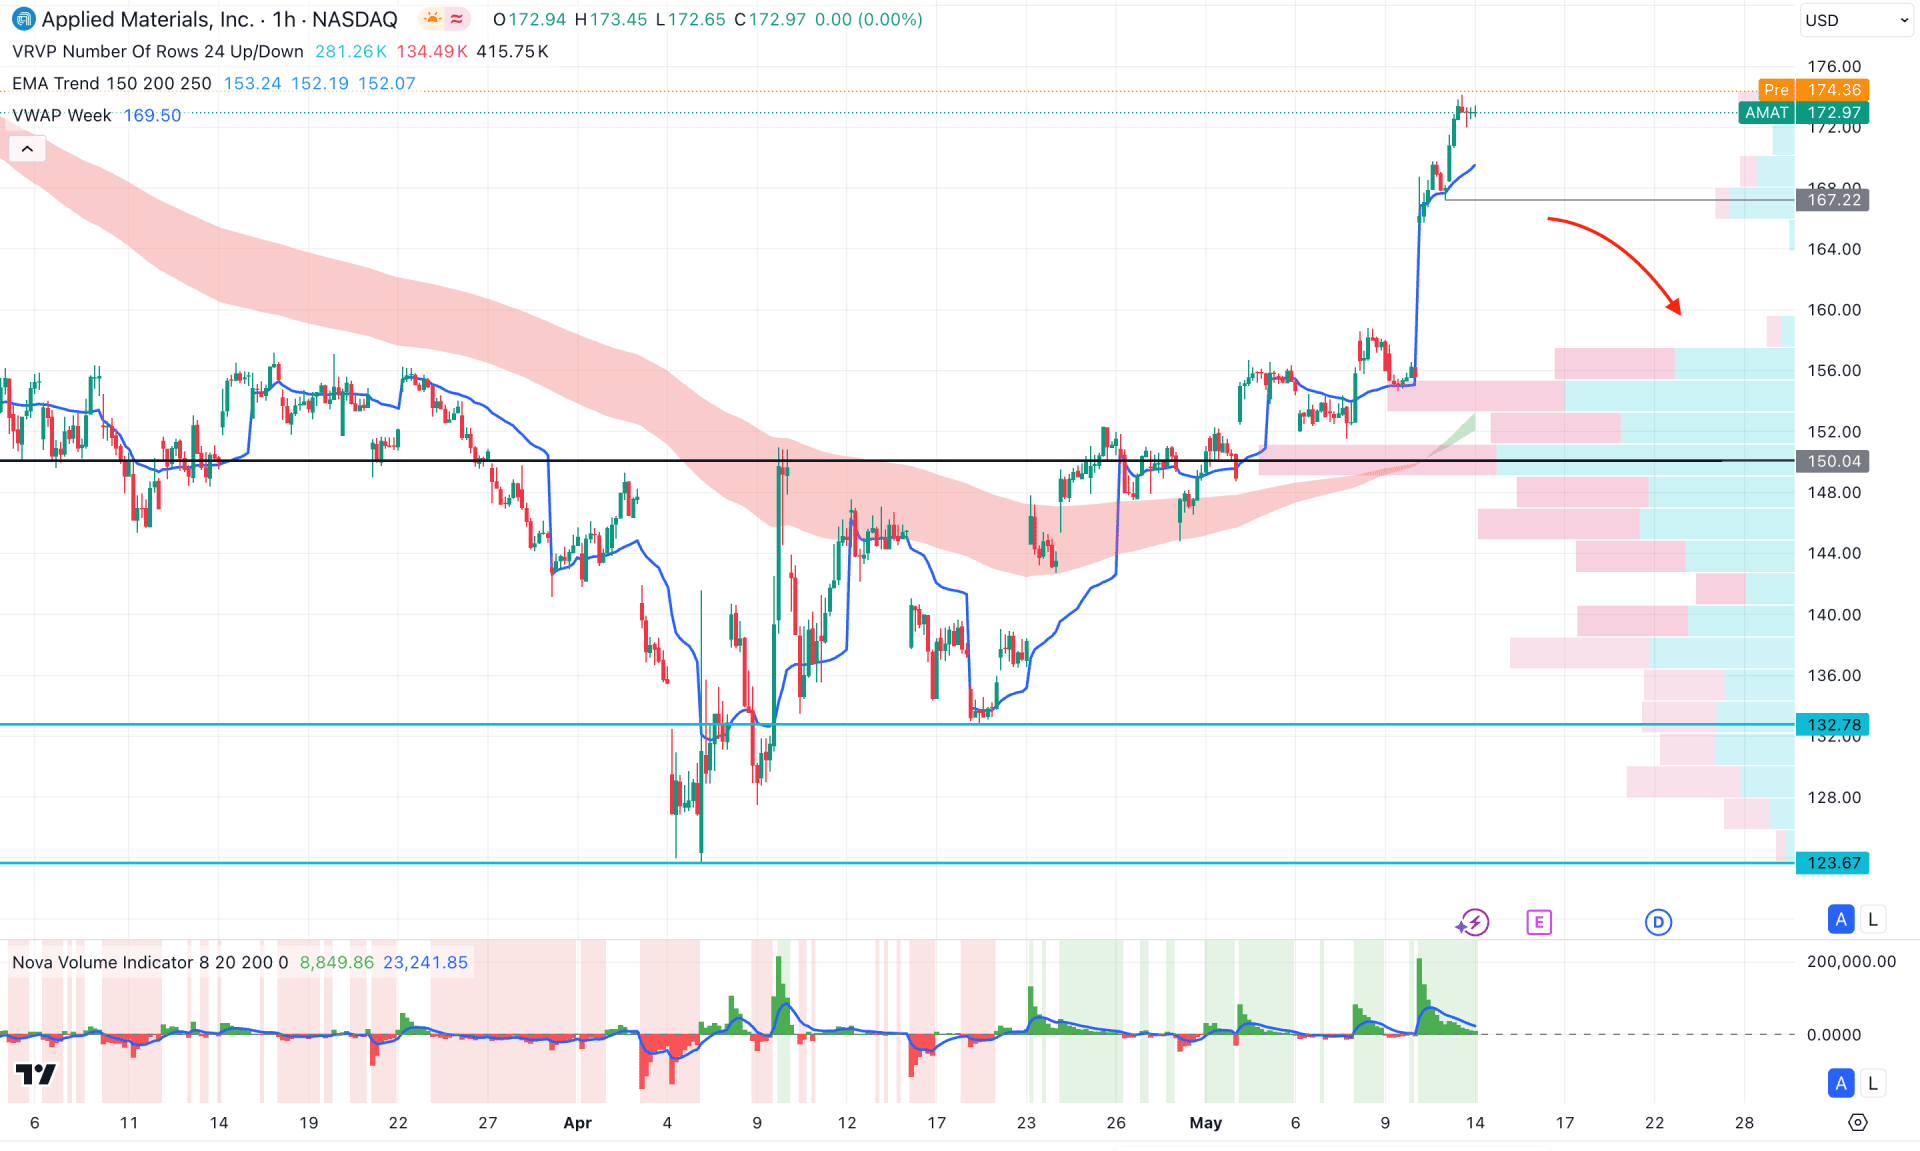
In the hourly time frame, the intraday bullish continuation momentum is clear where the current price hovers above crucial intraday highs. Moreover, the visible range high volume line is below the current price, working as a crucial support. The Moving Average wave is also below the current price with a bullish crossover at the high volume area.
In the meantime, the indicator window suggests a rebound from the bullish peak, which could cause a bearish trend reversal.
Based on this outlook, a bearish H1 candle below the 167.22 support level could be a sell opportunity, aiming for the 148.00 level. However, a bullish rebound from the 160.00 to 152.00 zone is possible, from where a long opportunity might come.
Based on the current market outlook, AMAT is more likely to form a bullish signal after validating the descending wedge breakout with a proper correction. In that case, the intraday price could be an early long opportunity, as a proper validation is seen in the hourly chart.


